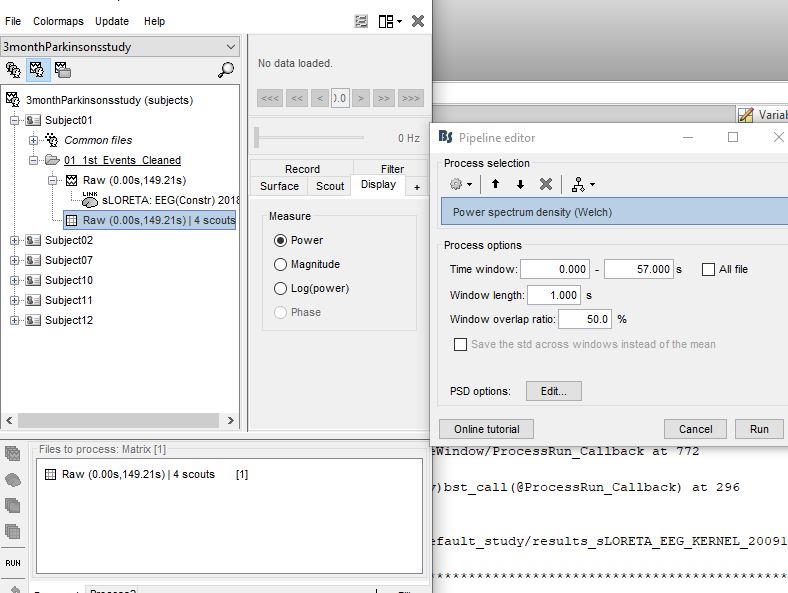
I have a 3 min recording of source converted EEG data. I used minimum norm imaging sLORETA. I extracted my source data using -> extract--> scouts time series for 4 regions of interest using the desikan-Killiany scout and created my matrix file of 4 scouts with source data points per millisecond. I then moved my source matrix into 'files to process' clicked on ;process user matrix' and ran a PSD welch to obtain power values. Here is a picture
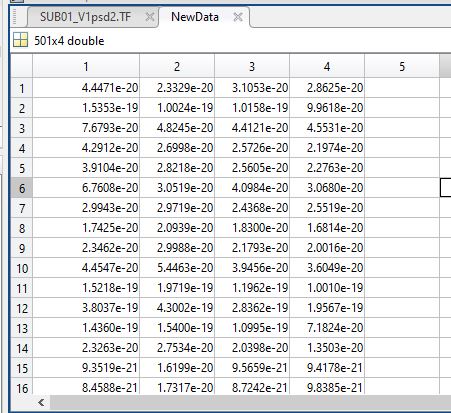
My PSD power data popped up underneath my source matrix file and i exported my PSD values to matlab. Here a pic of the values i obtained. My sources are on the x axis and my mean Hz values are on the y. I've never seen numbers so small in my life. This is also my first time working with sloreta source data, so i don't know what to expect. Is this normal? Did i do something wrong?
Anyway, if i didnt, are these absolute power values? Do these values require further computation to get them into "normal" looking units if they are not already in abs units? For my next step i just want to average across frequency bands and obtain my mean values for Delta, theta etc.... I know how to do that, but i dont know what these numbers mean and why they are so small.
. I extracted my source data using -> extract--> scouts time series for 4 regions of interest using the desikan-Killiany scout and created my matrix file of 4 scouts with source data points per millisecond. I then moved my source matrix into 'files to process' clicked on ;process user matrix' and ran a PSD welch to obtain power values
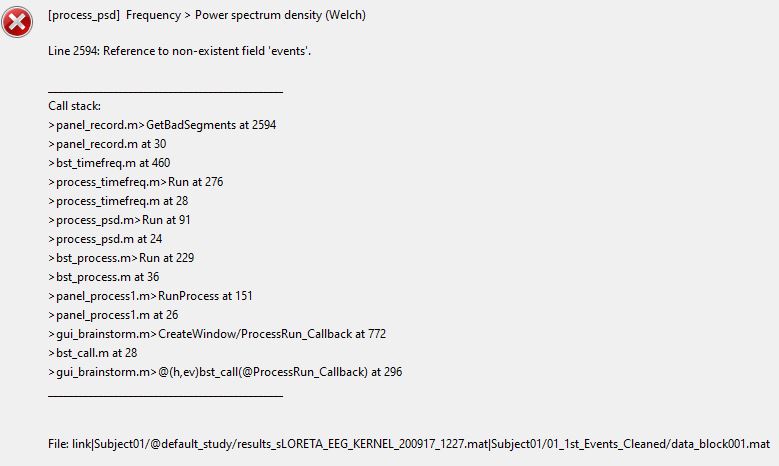
Simpler solution: select the source file and run the PSD process and select the scouts you want. You don't need to extract the scouts time series explicitly first.
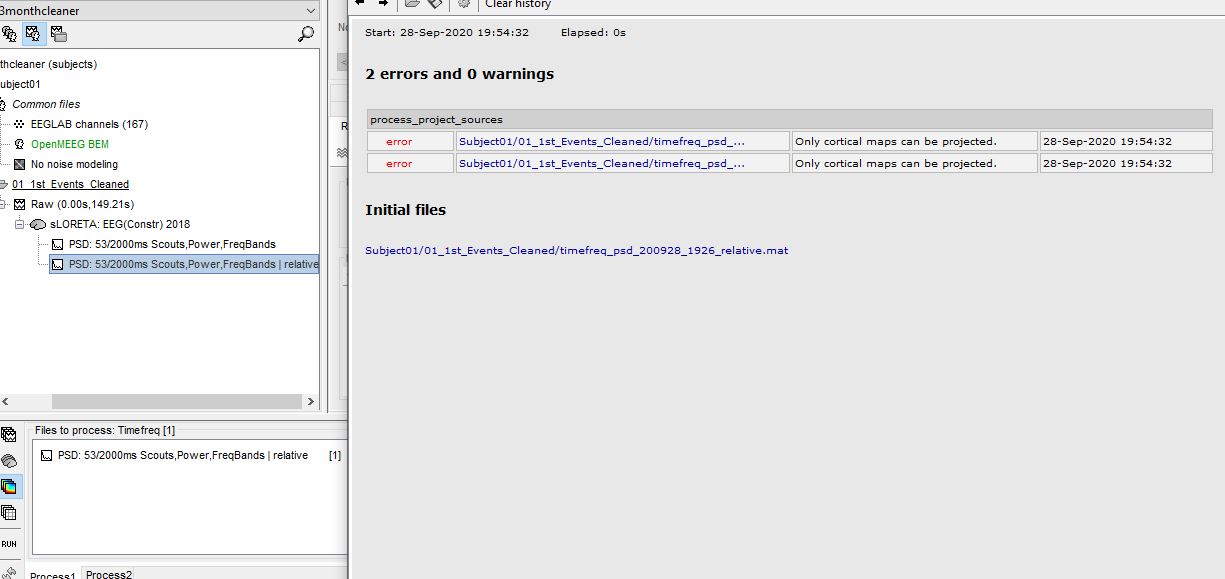
Thanks very much. If it select the source file i unfortunately get this error. This is why i've been using the matrix file. Not sure why this is happening
Hi Francois,
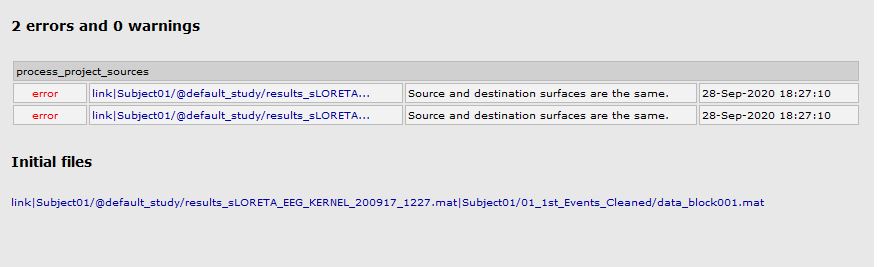
I actually do not remember what i clicked to get that error, but i think it is related. I am now getting another error here. I moved my PSD relative power frequency spectrum into files to process --> frequency --> project on default anatomy and i get the following error.
1st error message:
You tried to project the source maps onto the surface it was computed from.
2nd error message:
You estimated the sources for a few scouts only (hence the tag "Scouts" in the file name). Only full cortical maps can be projected to a different cortex (option "Use scouts" disabled).