Dear Francois,
I wanted to ask you if there is a chance to extract the values of the time-series activation of the selected scouts. Also to extract the values of the power of a certain frequency band. I am interested in performing correlation between those values and behavioral analysis. I have been checking the function for extracting values, time-series and time, but im not able to get any values that i can work with.
Thank you for any kind of help you can provide!.
Cheers
Joan Paul
1 Like
Hi Joan Paul,
You would like to extract these values from where to where?
To compute the scouts time series and save them as a new file in the database, use the process “Extract > Scout time series”.
To compute the power in a specific frequency band, use the processes “Frequency > Power spectrum density” (no time dimension) or “Time-frequency” / “Hilbert transform” (time-frequency).
To load these values into your Matlab workspace or export them to a different file format, use the popup sub-menu “File”:
http://neuroimage.usc.edu/brainstorm/Tutorials/ExploreAnatomy#Interaction_with_the_file_system
Or simply load the files with the corresponding function: in_bst_matrix() or in_bst_timefreq(): read the help directly in the code of these functions.
http://neuroimage.usc.edu/brainstorm/Tutorials/ArtifactsFilter#On_the_hard_drive
http://neuroimage.usc.edu/brainstorm/Tutorials/TimeFrequency#On_the_hard_drive
Francois
thanks for your answer Francois,
Im sorry for not been specific in my answer. I have already performed a wavelet time-frequency analysis and source location on my data. What i am interested now is to be able to extract a numerical value of the mean of the theta frequency power and scout time series within a certain time period for each subject. It would be possible to extract this values to create an excel document which i can import to SPSS later on?.
I want to perform correlations between this values and the behavioral data. I would like to see how these brain activation patterns are related to the performance on the task. And also how the brain activation pattern defer between experimental groups.
Thank you very much
To average a time window and a frequency band:
- Put the time-frequency decomposition of the scouts time series in Process1 (you can put all the files you have at once)
- Use the process “Extract > Extract values”, select the options “average selected time window” and “average selected frequency bands”
- If you selected more than one file, the option “concatenate” defines in which dimensions the various input files are stacked before being saved into one single file
- Right-click on the new file > File > Export to file, select ASCII or Excel format.
Thank you very much,
Three questions, this procedure is the same for the time frequency maps?. I mean the time-frequency computed not only for the scouts but for the EEG signal?.
The second one is in which scale units is the data provided?
The third one is that when i try to save the file into an excel format i get this error message (see picture attached) is it a bug or is there something wrong with my files?.
Thank you very much for the useful help 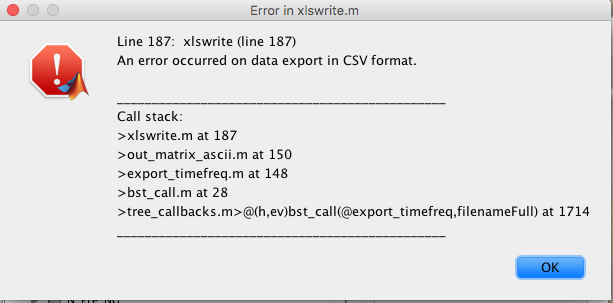
Dear Francois,
I have computed the time-frequency analysis for each subject under each condition. And then used the process “Extract > Extract values”, to average 200-400ms time window and to average 4-7 hz frequency bands only for Fz channel. I can right click on the “Extract values” file and export the numerical value by the option “ export to matlab” or “export to file”. However, I need to manually select each subject and manually export the theta values four times (as shown in the figure, each subject has four conditions). 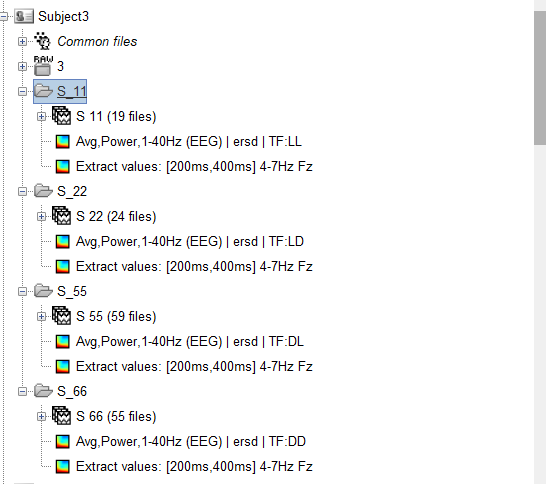
Unfortunately, I had so many subjects that exporting was too tedious. My question is, is there any code that can automatically export the value of each condition for each subject. For example, it will generate a matrix containing nSubject * nCondition extracted value. This will facilitate the calculation of all the subjects' values by putting them into SPSS.
Thanks in advance,
Xukai
The values are all saved in .mat files, that you can load from a Matlab script and reformat/save in a text file. The only way you can automate this task is to write a Matlab script that loads these files and save them in a different format.
You can use the search tools for getting all the files at the beginning of your script:
https://neuroimage.usc.edu/brainstorm/Tutorials/PipelineEditor#Search_Database
The files structures are documented in the sections "On the hard drive" in the introduction tutorials:
https://neuroimage.usc.edu/brainstorm/Tutorials/TimeFrequency#On_the_hard_drive
The tutorial Scripting gives you a lot of information to get started with writing your own Brainstorm scripts (you need to have some Matlab programming skills):
https://neuroimage.usc.edu/brainstorm/Tutorials/Scripting
PS: You could also use the process Extract values to extract all the values you want at once in the same file (concatenated in along the first dimension: "Concatenate signals"), and avoid having to load many files in your script.
Hi Francois. Is it possible to extract the psd value according to each brain regions?
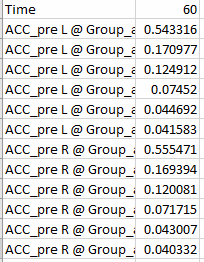
I have averaged my data according to group and want to extract the psd value for all brainwaves and brain regions according to AAL3 atlas.
this is what i get
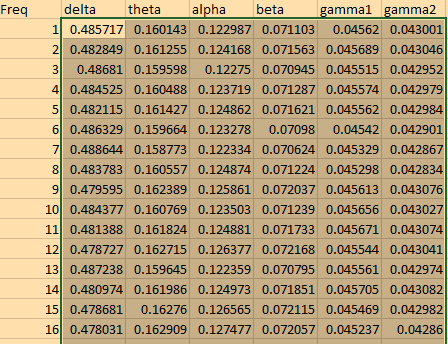
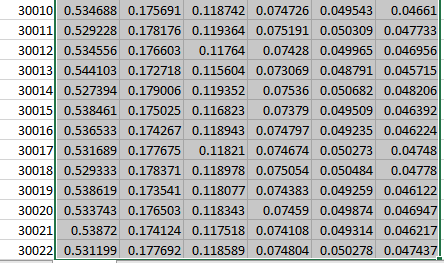
I got all the psd for each brainwaves, but not for the brain regions. I am not sure where all the 30022 is coming from. TQ for ur help.
Is it possible to extract the psd value according to each brain regions?
Two options:
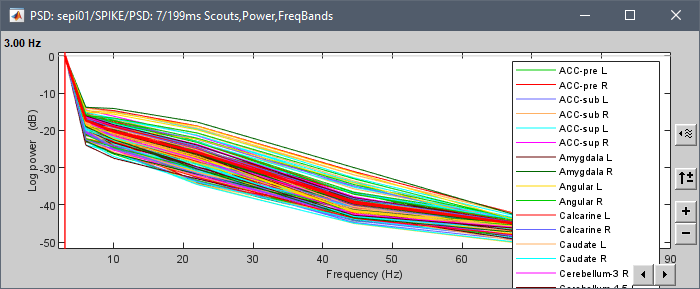
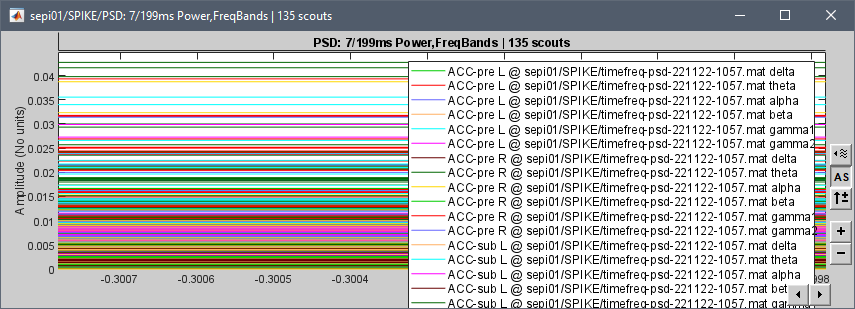
- When computing the PSD, select the option "Use scouts", and select directly the scouts you are interested in. You would obtain a PSD file with one spectrum for each ROI:
- After computing the PSD on the full brain (the file you present in your post): select this PSD file in Process1 and run the process "Extract > Scouts time series". This would format the same results in a different way, as a "matrix" file, with one value per ROI and per frequency band.
I am not sure where all the 30022 is coming from
This is the number of grid points used in the computation of the forward model (= the source space).
I think I got it. So it will be delta, theta, alpha, beta, low gamma and high gamma for each of the ROI
Hello Francois,
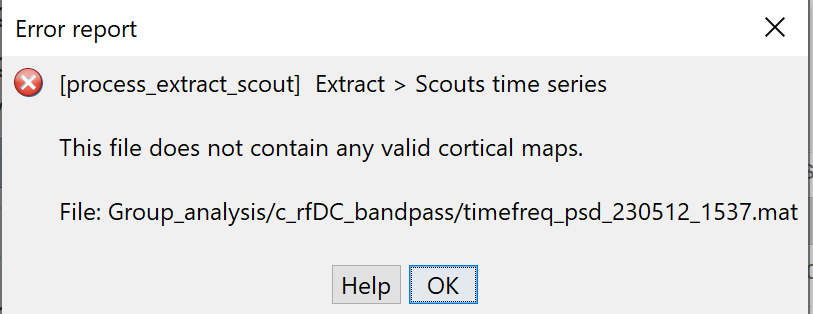
I am trying to do this exact process but when I run it I get the following error message. Can you assist please?
@rawanjarrar, it seems you computed the PSD on the recordings (EEG or MEG) instead of the sources.
Verify that you're in the Process sources (button  ) option in the Process tab
Thank you Raymundo, you were right. Problem fixed!