Hey there,
I'm working on MEG recordings and trying to do source reconstruction for frequency data; my experimental design resembles that of an SSVP in that I would need to detect differences in entrainments across conditions - I am not interested in time.
However, after running FFT on each condition file for each subject the time dimension is still considered, which I find extremely confusing.
Two examples are:
(1) by trying to extract specific frequencies for each subject, the files get concatenated on the time domain;
(2) while trying to run a statistical test on the data I need to select a time-window to consider.
Is there a way to drop the time dimension and only keep the frequency information?
Are there other alternatives to analyze only frequency-related information?
Thanks in advance
However, after running FFT on each condition file for each subject the time dimension is still considered, which I find extremely confusing.
In Brainstorm, the files always keep a time dimension.
For FFT/PSD files, the Time vector in the file represents the time window the file were initially computed from, but there is no time information left.
https://neuroimage.usc.edu/brainstorm/Tutorials/ArtifactsFilter#On_the_hard_drive
(1) by trying to extract specific frequencies for each subject, the files get concatenated on the time domain;
Could you please describe better what you are doing here, and why it is not behaving in the way you expect?
(2) while trying to run a statistical test on the data I need to select a time-window to consider.
Just leave the default values (you should not be able the values anyway...)
Hi Fraoncois,
Thank you so much for the clarifications & references.
Right now I've set my protocol with a folder for each participant, containing a subfolder for each condition. The terminal nodes are named after condition (e.g., cond1, cond2) and subject (e.g., ABC, DEF), resulting in a structure like this:
-
ABC
cond1_ABC
cond2_ABC
-
DEF
cond1_DEF
cond2_DEF
When I try to move this to the group level analyses, each file results in a separate folder; when I tried to extract the values I'm interested in (e.g., 0-20.1Hz) subjects are concatenated in time: the timefreq_fft file contains a TF with size sources x subjects x frequencies, and I believe this is not appropriate for running the subsequent analyses.
I'm not sure what you mean here.
Please include screen captures showing:
- your files in your database,
- the files you select in the Process1 or Process2 tab
- The options of the process you execute
- The output files in the database
when I tried to extract the values I'm interested in (e.g., 0-20.1Hz) subjects are concatenated in time: the timefreq_fft file contains a TF with size sources x subjects x frequencies, and I believe this is not appropriate for running the subsequent analyses.
Are you referring to the process "Extract values"?
This is designed to select blocks of data in multiple files and concatenate into one single file, indeed. It is not suitable for statistical analysis within Brainstorm (as you need the different repetitions of your experiment to be in different files in order to run statistical tests).
This can be useful to extract data in order to do statistical analysis OUTSIDE of Brainstorm (R, Matlab, SPSS, etc)
1/2
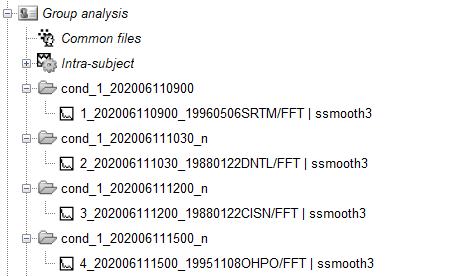
After computing the FFT on each dSPM file, I smoothed and projected on default. The result is the following structure:
2/2
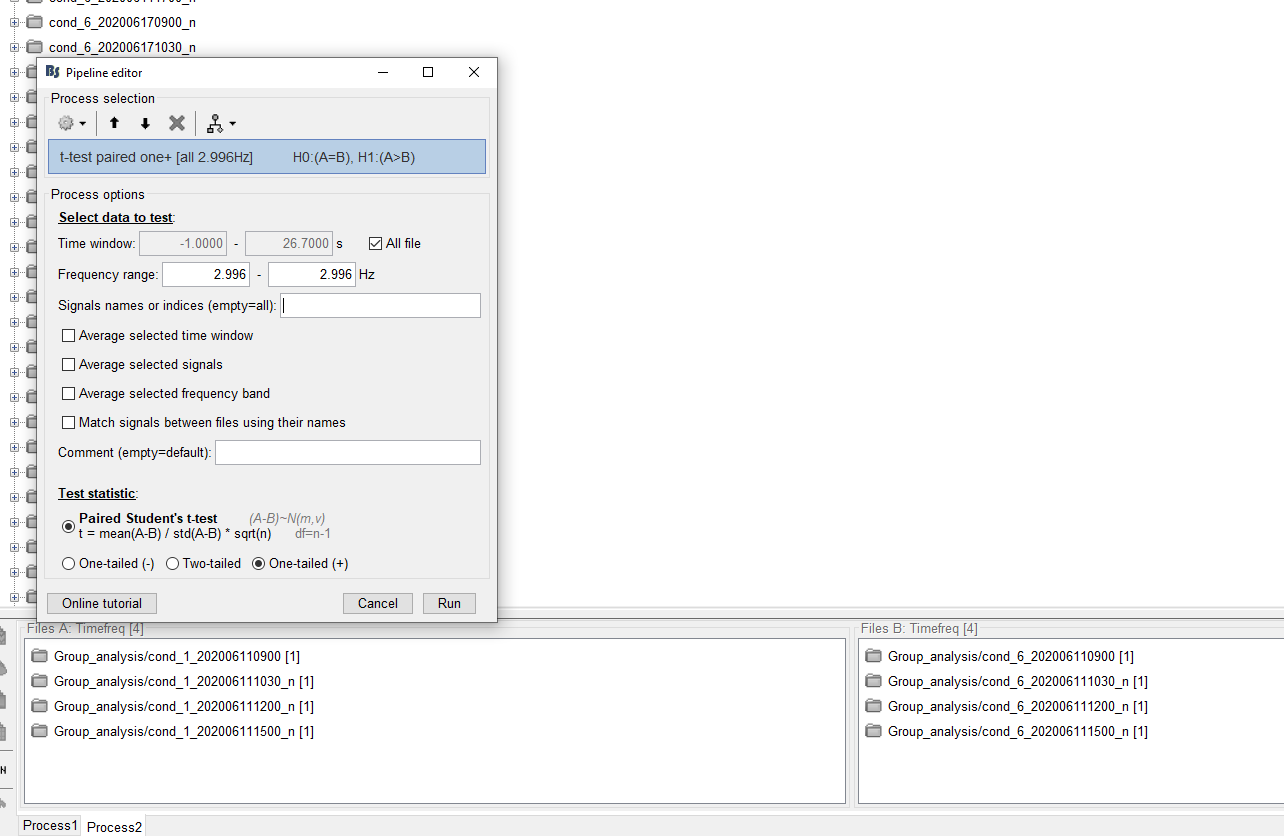
I managed to run stats on these files by running a paired t-test across conditions in the following way:
However I have a rather precise hypothesis as for where the effect should appear, so I was trying to use scouts but at this point the option is not available. The only workaround I thought of would be to export the scouts' vertices and proceed through base MATLAB, which seems consistent with your earlier reply. Would you agree?
Meanwhile, thanks again!
After computing the FFT on each dSPM file, I smoothed and projected on default. The result is the following structure
This makes sense.
However I have a rather precise hypothesis as for where the effect should appear, so I was trying to use scouts but at this point the option is not available. The only workaround I thought of would be to export the scouts' vertices and proceed through base MATLAB, which seems consistent with your earlier reply. Would you agree?
If you have a precise hypothesis about source localization, the simplest option would be to compute the FFT on the scouts only, and then you don't even have to project on the default anatomy. You can directly compare the values obtained for the various ROIs across subjects.
If you're not afraid about this, you could also script the scout analysis in a Matlab script. This tutorial might help:
https://neuroimage.usc.edu/brainstorm/Tutorials/Scripting
Note that depending on your sampling rate and epoch duration, the FFT might have a frequency resolution that is too high for having enough overlap between participants.
You could consider using a PSD (https://neuroimage.usc.edu/brainstorm/Tutorials/ArtifactsFilter) or frequency bands instead.