Hi there,
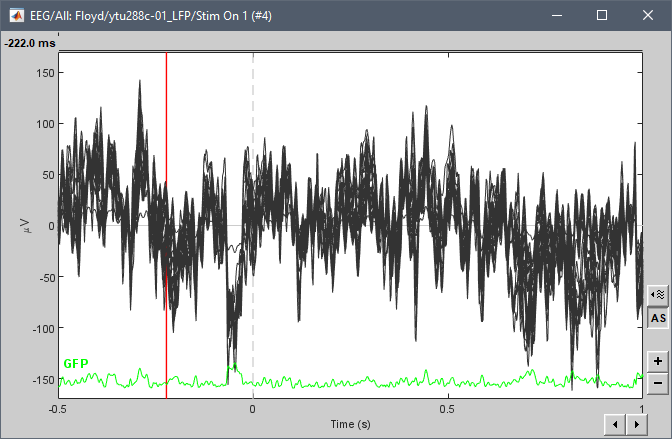
I present an averaged cortical auditory evoked potential (epoch length -200 to 600 ms).
Is there a way to export the green GFP line?
BrainStorm calculates this and displays it as I present it, but there seems to be no way to export this.
Hi there,
I present an averaged cortical auditory evoked potential (epoch length -200 to 600 ms).
Is there a way to export the green GFP line?
BrainStorm calculates this and displays it as I present it, but there seems to be no way to export this.
No, you can't export it, but it's easy to compute it in a Matlab script.
You can adapt the code the code that computes it in Brainstorm to your own scripts:
To learn how to write scripts with Brainstorm:
https://neuroimage.usc.edu/brainstorm/Tutorials/Scripting
You can also use Clusters, as suggested in this other thread:
Thank you for your suggestions Francois.
But this one is just an average isn't it? Not global field power.
Or are you suggesting that the same principles could be applied using this method to calculate GFP?
If you select all the electrodes, create a cluster and set its function to Power, then you'll get exactly the GFP displayed at the bottom of the ERP figure.
You can use the process "Extract > Cluster time series" to save this GFP in the database as a new "matrix" file.


In this particular example how do you select all the electrodes without clicking through each and every single electrode one by one? Is there a short cut? (like Ctrl+A; tried this did not work).
Two options:
Hi Francois,
I'm trying to compute the GFP following your answers.
First, I used the code in your screenshoot, which is GFP = sqrt(sum((F * fFactor).^2, 1));
Then, I checked the code in your link, here is the link: brainstorm3/toolbox/gui/figure_timeseries.m at master · brainstorm-tools/brainstorm3 · GitHub.
And I found in the link the GFP=std(F * fFactor, 1);
Now I'm totally confusing about the way to get the GFP, could u please tell me which one is the right one?
Many thanks
S
Hi @SarahC, the computation of GFP was changed on September 2022 to match most common definition of GFP in the literature:
Change was performed in Commit b9dce39f
Hi Francois, I am trying to export the GFP to matlab as you explained by selecting all the sensors, create a cluster and edit the function of the cluster to Power. However, when I display the cluster in time series i just get a straight line in 0uV. Do you know why?
Hi @CristinaSalinas, it seem the Power time series is there, just keep in mind that Power units are [µV ^2] so, if plotting with the same scales the power time series will look like zero. See the plots below:
Uncheck the option Uniform amplitude scales
Thank you!