How does brainstorm calculate absolute values of group averages of dspm source activity?

Hello Francois,

I'm currently working with EEG data which I wanted to analyse in brainstorm to obtain the source activity. Right now, I'm struggling to understand what brainstorm is doing and I couldn't find the information needed in the tutorials or other forum posts.

Basically, I have calculated the dspm source currents for a group of subjects for different regions of interest and now I would like to calculate the group average of the absolute activity following the tutorial of Stropahl et al. 2018.

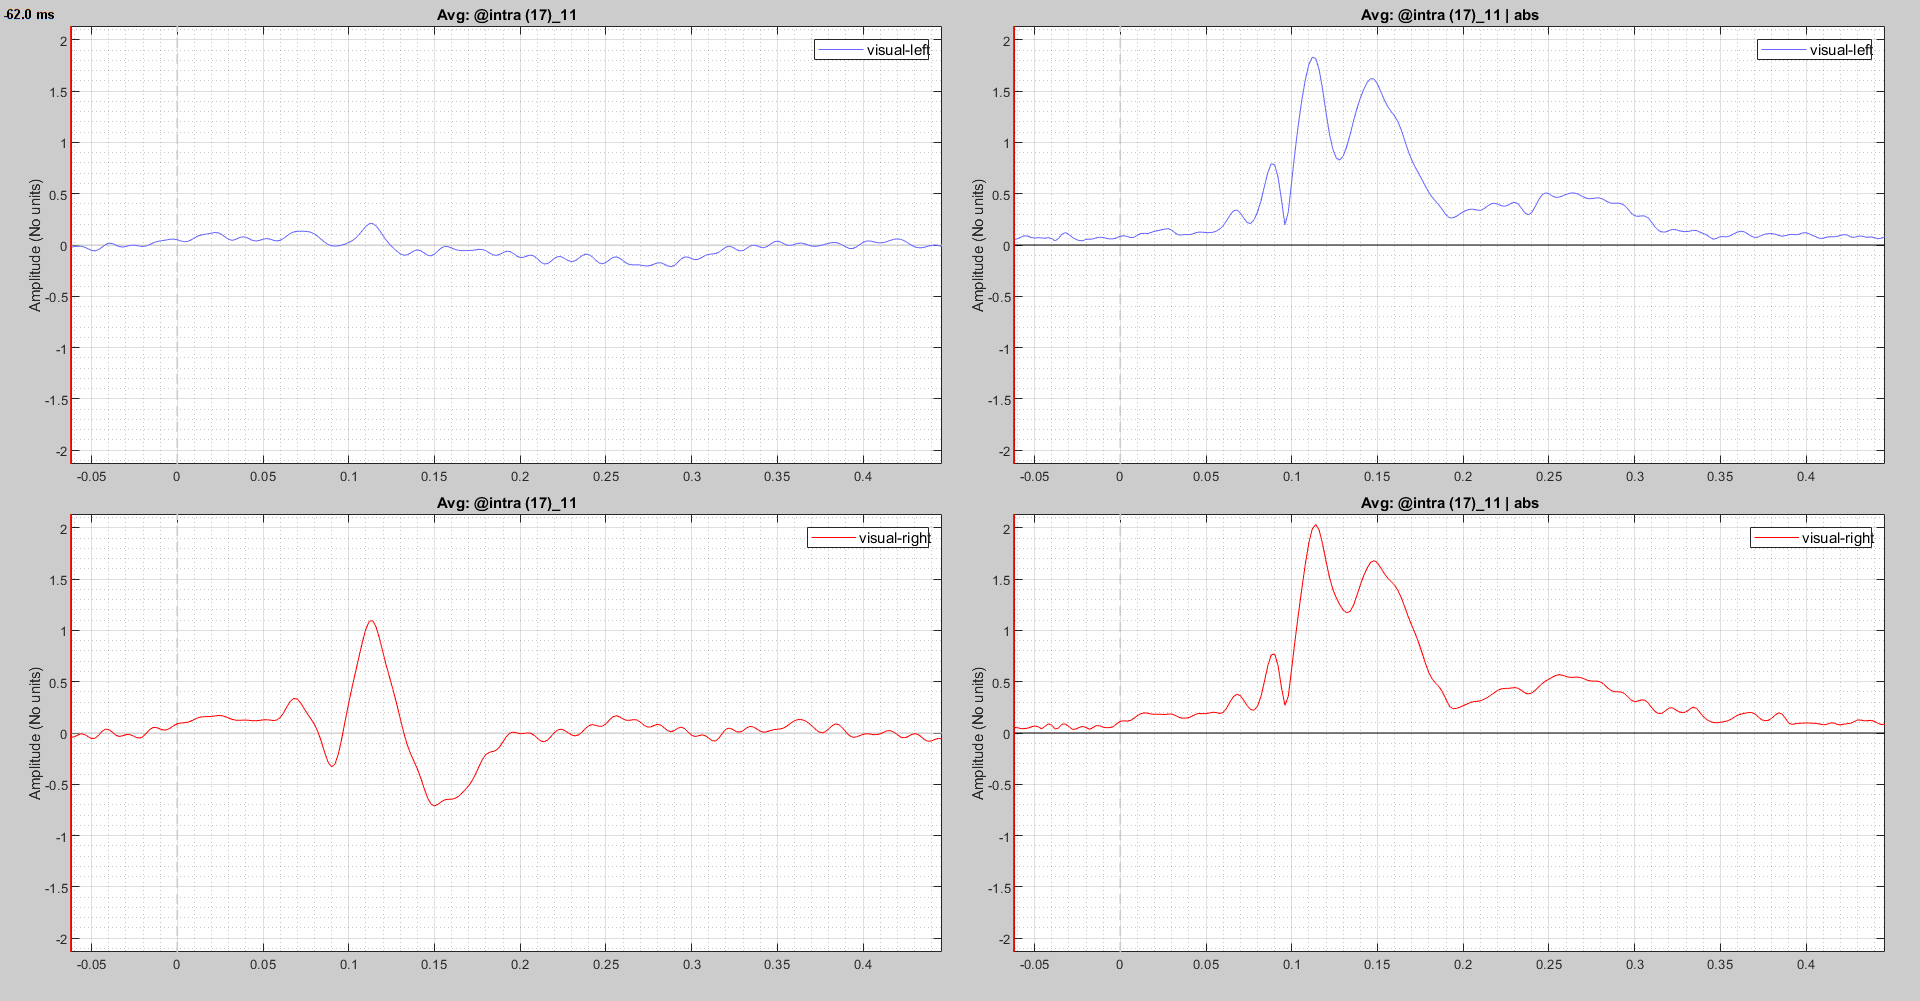
The problem is that I do not understand how brainstorm does the preprocessing step 'absolute values'. I first calculate the group average, then I add the process 'absolute values'. Naively I would think, it just takes the absolute value of the averaged dspm source activity. But in the attached picture one clearly sees that this cannot be the case. Could you explain, how brainstorm creates the plots on the right from the ones on the left?

Similarly, I would like to extract the single subject data in order to perform some statistical analyses in R. But I am unsure, which values to extract. Should I take the dspm source activity or the absolute values of the source activity? I would like to compare the mean absolute activities between two groups and since I don't know, how brainstorm calculates the mean on the right hand side of the attached plot, I am not sure, how to calculate the mean manually with the extracted values.

Thanks in advance for your help.

Yours,
Natalie

I first calculate the group average, then I add the process 'absolute values'.

I suggest you take the absolute value (or norm for unconstrained sources) and then average across subjects, as described in these tutorials:

Could you explain, how brainstorm creates the plots on the right from the ones on the left?

I don't think it does...
It is difficult to follow what you did as all the steps you mention have many options that can change the logic of the scout computation and the group analysis. Also, you don't really explain what you have on the left and on the right, or if you are averaging scout signals or full source maps.

If you still have things you don't understand after fixing your pipeline, please post a complete sequence of operations that illustrate clearly what you have before and after averaging, maybe limited to 2 subjects (screen captures showing the files in the database, scout time series for each file, scout time series of the average).

Should I take the dspm source activity or the absolute values of the source activity?

At the group level, the sign of the minimum norm is ambiguous and should not be compared across subjects, therefore probably absolute values?
Within a single subject, both could be meaningful. Please refer to the Difference tutorial, which explains the sign issues in details:
https://neuroimage.usc.edu/brainstorm/Tutorials/Difference