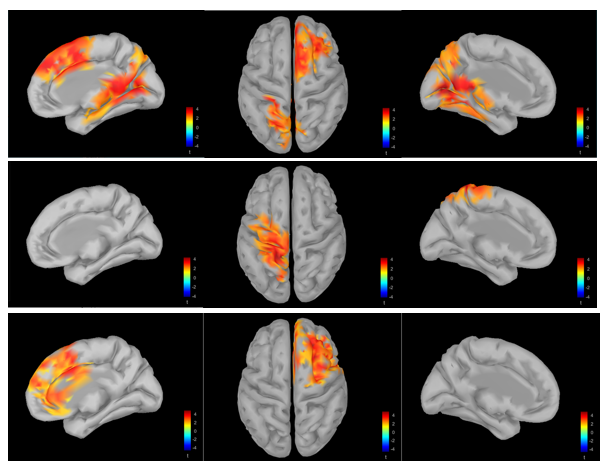
I have done the time-frequency analysis on source space to explore the probable source in specific time and frequency bands. Our study has two conditions A: A1/A2, B: B1/B2. The three contrasts between A1B1 with A1B2, A2B1 and A2B2 (by using cluster based permutation) resulted some significant source difference ( p ’s < 0.05).
My question is, how do we know exactly what brain regions these significantly different sources are (such as subgenual cingulate or BA 25). I found some Atlas in scout tab, but it may not be accurate to manually compare statistically significant regions and atlases, and the significant cluster may involve multiple brain regions that that do not completely overlap with the atlases, so how should we report that my source results are more accurate?
Hi!
I don't know if this could be the best approach but I suggest you:
Before computing the frequency (e.g. Welch) or the main measure, set an Atlas and in the main computing screen select the scouts, in that way you can extract or export numerical values about measures, one per Scout.
In your case , you've already seen the activated areas, so you can just choose that Scouts for the main computation.
When you swith to source space and choose a measure (like Welch) , if you select an Scout Atlas, an option to select and compute the measure in specific scouts will be avaliable.
There is also an option with the right click: find max (in MRI viewer)
I hope it works
ps: don't worry, expert people like Francois will help you, I'm sure
In fact, at the beginning of the study, we didn't have a strong hypothesis about activation of brain regions. Therefore, we didn't select the limited scouts in the analysis.
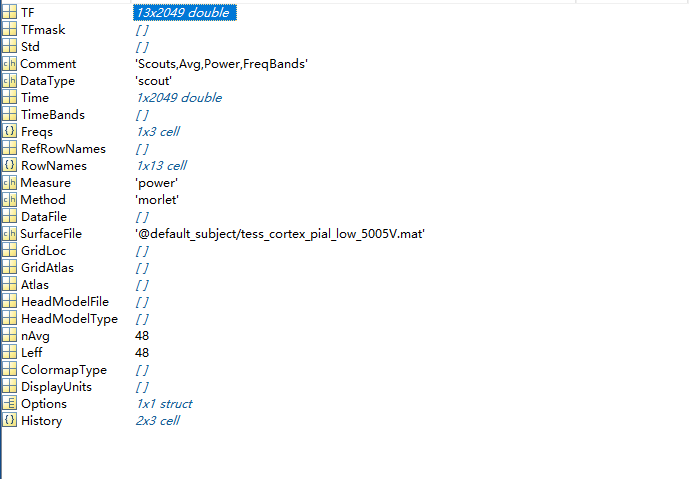
I tried to take your approach and manually selected the atlas based on the significant activation areas that I have found. After computing the time-frequency analysis with manually selected scouts, I can export the .mat file and see the scouts activation value for each one. As shown in the figure below, I selected 13 scouts, with 2,049 time points. The TF structure in .mat file contains the corresponding value for each scouts at each time point. Is this correct? And this value can be used to further analysis.
Sorry, I'm not familiar with your mentioned operation, but what information can I use to determine the scouts' specific brain region that I manually selected. Is there any information that I missed in mat files, or export other files?
The MRI Viewer is really helpful because I can directly get the coordinates of the brain regions that are significantly activated. There are three regions in my results, which are P =0.008, P =0.028 and P =0.046. If I choose find Maximum, I can only see where P =0.028. Do I need to report any other brain areas? And how do I know which brain regions are involved in this area of significant activation.
Well, I'm not an expert actually but I would export the data to excel spreadsheet, in that way you get the Scout and the measure, and just that.
Max function shows only one value, the highest one, regards the p value
I'm sure experts will tell you: that's up to you ,to the research goals, and to your hipothesis,
Personally, I think you should report the three areas you found with lower p value,
by the way, did you use a normalization (like z-transform or ERSP)? that is important in order to use group comparisons and to make your results valid.
Francois explained to me best source analysis and results approach, I think this could be useful to you: Creating Scout Vs Atlas
but If I were you, I would wait for the BS Enginers to answer this question, I guess they can help better
Thank you for sharing. The method of using manual atlas to get the corresponding activity value may be very helpful for my later research. Especially if I have clear assumptions.
Yes, I normalized the results for each subject before I did the statistical analysis.
My current results may be more data-driven, having performed exploratory source analysis.I used cluster based permutation. The files with "stat" generated by statistics could not be exported in nii format. However, when I used "Test>apply statistic threshold" to remove the tag, the files in nii format still could not be placed in other similar xjView software.
It would be more convenient if the statistical results could be converted into appropriate NII and MAT formats and the results of statistical activation could be placed as a overlay on the underlying template of the brain.
Of course, we are waiting for BS Enginers to give us a corresponding answer. This will probably help many people who use Brainstorm for source analysis.
But it has to be hypothesis-driven: if you use create a scout based on this first result you obtained with the cluster approach and redo all your statistical analysis to obtain lower p-values or more precise locations, this is called double-dipping:
The files with "stat" generated by statistics could not be exported in nii format. However, when I used "Test>apply statistic threshold" to remove the tag, the files in nii format still could not be placed in other similar xjView software.
The files exported with a right-click > File > Export as 4D matrix should be regular .nii files that you can process with any other program. If you have time, make sure you do not export the time dimension, or you might have issues dealing with 4D volumes in other programs.
Try opening your volumes your MRIcron first: MRIcron Installation Page
the results of statistical activation could be placed as a overlay on the underlying template of the brain.
Right-click on the source file > Cortical activation > Display on MRI (MRI Viewer).
Keep in mind that you used a surface source model. This is not really meant to be re-interpolated as a volume after... Maybe you would be more comfortable working with volume source models instead: https://neuroimage.usc.edu/brainstorm/Tutorials/TutVolSource