Dear community,
I need to interpret which regions are higher on entropy. I have read the tutorial and searched on internet. I thought maximum entropy regions was what BEST showed. But it seems that is not the case.
Meaning higher entropy is not localized and lower entropy specific regions will appear?
Can you explain if I'm wrong in my interpretation.
Thank you for your help as usual.
Adding some of the developers of the MEM:
@cgrova, @jafnan, @edelaire
1 Like
Hello,
Thanks a lot for your question. When we mention Entropy in Maximum Entropy on the Mean (MEM); we are not referring to the entropy of the data but as the relative entropy between the prior and the posterior distribution (more specifically the Kullber-Leibler divergence). Here Maximum Entropy is a property of the solver, not the data.
To make it more clear, we can see how other solver works. When solving the inverse problem, we are trying to solve for x the equation Y = Gx + e.
To solve for x, you need to rank all the possible solutions for x. For that, one might use probabilistic modeling assigning the likelihood of observing specific data based on a set of parameters: p( Y | x)
One solution is then to take x that maximizes this likelihood: this is the maximum likelihood estimator (MLE [1])
Using the Bayesian framework, it is possible to introduce prior on the distribution of the parameter and using Bayes rules, update the prior to estimate the posterior probability distribution of the parameter. One point estimate, one can then choose the Maximum a Posteriori solution [2]
In the case of MEM, we choose to maximize the relative entropy between the prior and the posterior distribution which has some nice statistical properties From the tutorial: " The maximum entropy distribution is uniquely determined as the one which is maximally noncommittal with regard to missing information” (E.T. Jaynes, Information and statistical mechanics, Phys. Rev. 106(4), 1957)."
(note, I had to make some simplification*, but I think it conveys the message well - feel free to ask if you need any more information)
- if a statistician see this message, sorry

-
Maximum likelihood estimation - Wikipedia.
-
Maximum a posteriori estimation - Wikipedia
1 Like
Thnak you so much for your answer.
Correct me if I'm wrong!
I think I understand you don't work with entropy of the data rather with relative entropy between the prior and the posterior distributions i.e. Kullback-Leibler divergence.
That means less divergence from the distributions is higher entropy and more divergence lower entropy.
If that is correct. How can I check in source estimates that there is more or less divergence? Is there any heatmap from the KL divergence for the computed results?
Hello,
the following Matlab code should allow you to plot the entropy drop as a function of time:
sFiles = {...
    'PA65/.../results_MEM_MEG_240531_1021.mat'};

sResult = in_bst_results(sFiles{1});

entropy_drop = sResult.MEMoptions.automatic.entropy_drops;
time = sResult.Time;

figure;
plot(time, entropy_drop)
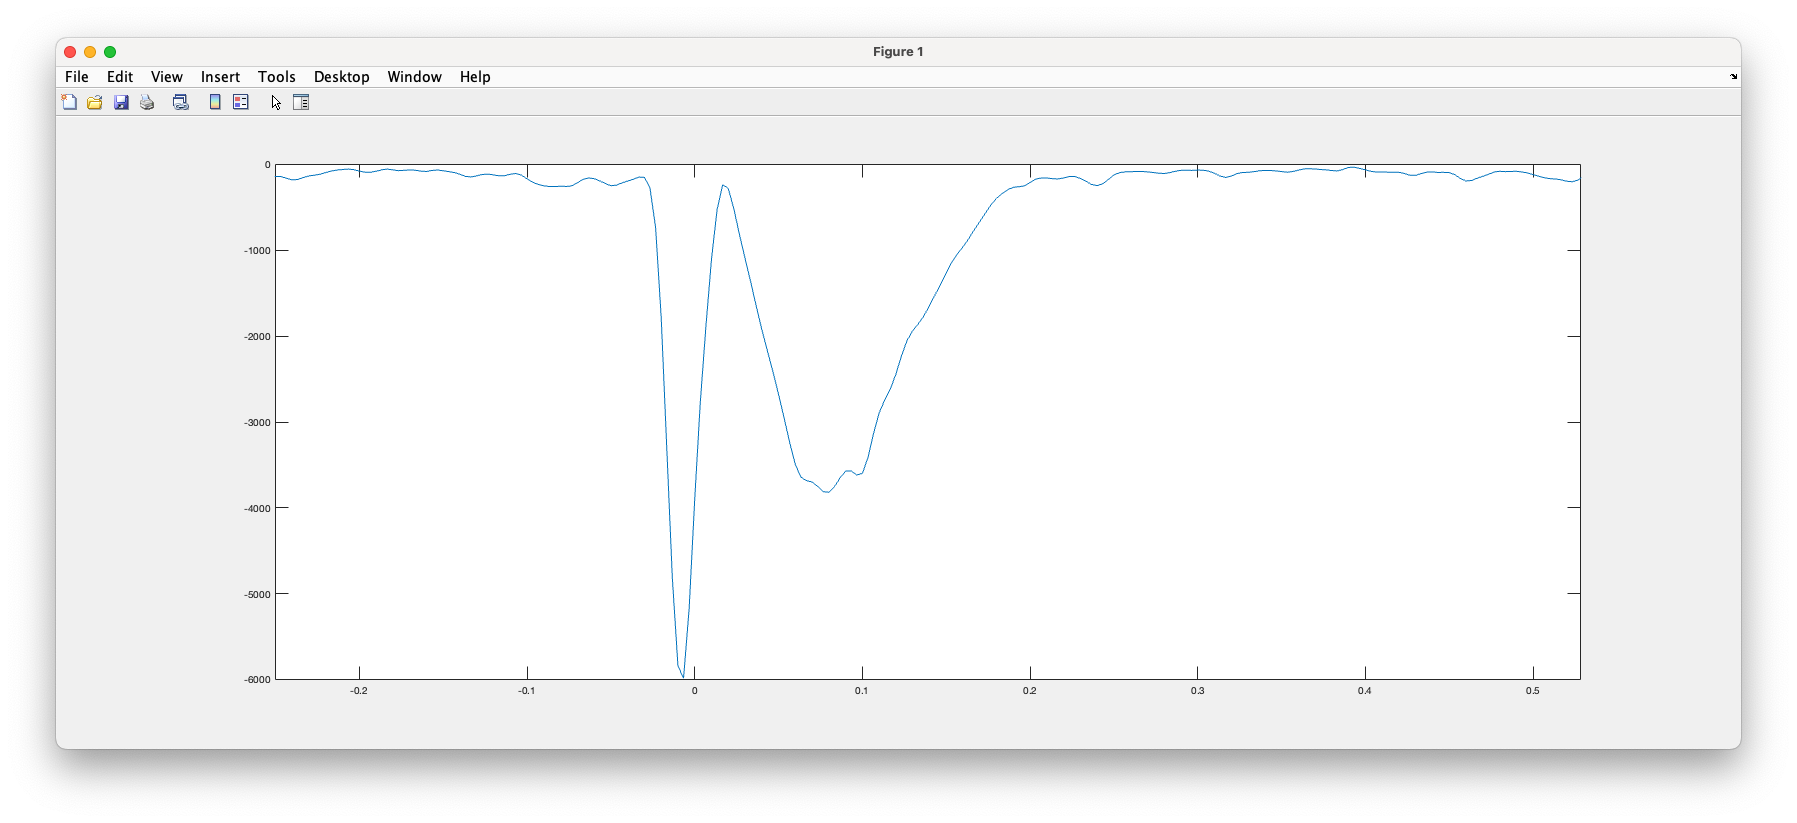
(illustration of the entropy drop during the localization of a spike)
I will need to ask during our lab MEM meeting on Tuesday. My understanding so far is that the entropy drop at a time point is a reflection of the amount of information that was present at that time point so more information means less entropy (ie larger entropy drop).
But I will confirm on Tuesday
1 Like
Thank you for sharing the code.I look forward to all the information that comes after the meeting.
I have succesfully computed the drop entropy. What would be more interesting than computing for each MEM file is to be able to do so with the average of one group or the difference to another group.
I tried with this code but it seem is sensitive to the name of the file.
Is it possible another way? May the trick is to rename the file. I just don't want to try if it is not allowed for some other reason.
Thanks for all the help in advance.
I tried to use this code.
sFiles = {...
'PA65/.../results_MEM_MEG_240531_1021.mat'};
sResult = in_bst_results(sFiles{1});
entropy_drop = sResult.MEMoptions.automatic.entropy_drops;
time = sResult.Time;
figure;
plot(time, entropy_drop)
it doesn't work anymore. I remember I used it long time ago and it did work. But now this sResult.MEMoptions.automatic.entropy_drops; doesn't work. Has anything changed in updated version of MEM.
hello,
yes. Those data are no longuer saved by default. However, you can go to expert mode and activate 'Save extra information'.
Those options should also now be in sResults.options.automatic.entropy_drop (i think).
1 Like
I have a previously reported error I believe.
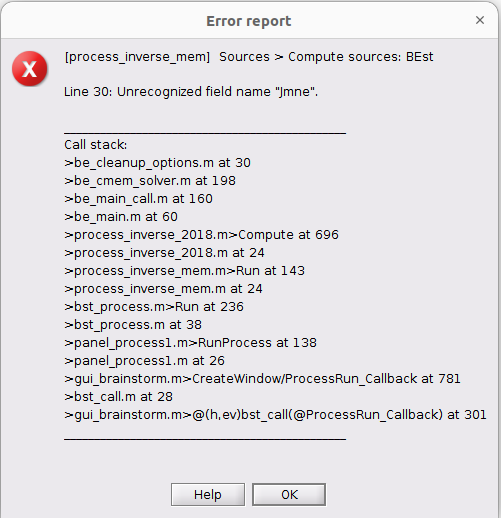
When I run with the extra information it demands as I believe a prior like another wMNE. I have run sLORETA but on the same events no uniform epoch so they are in different folders. I hope there's another way out because when I computed the previously and now already deleted files with MEM there was no need to have a prior. Perhaps I have to run MEM without extra information and then with extra information? Is that the catch?
Nice catch ! its a bug that was just introduced.
i will merge a fix tomorrow (monday). Until then, you can comment line 30 in be_cleanup_options.m :
automatic.minimum_norm = OPTIONS.automatic.Modality(1).Jmne;
Side note: MEM is always runing MNE inside as part of the initialization. However, since a recent update ([wMEM] Improve performance for long data recording (#36) · multifunkim/best-brainstorm@87eb9f3 · GitHub), we no longuer keep in memory the entire MNE solution, but only the kernel that can be used to compute it. It seems i forgot this extra saving flag was saving the MNE solution too 
1 Like
To verify I understood. If I compute just the kernel I can recompute then with more information right?
And also I can compute both with a click to the extra option ? Is that right ?
Please let me know if there is much wait time until I can update with fix. Or I shall do with the code modification you suggested to simplify and shorten waiting time.
One last question in that improvement for long data, does it mean I don’t have to use 1 second epochs to compute BEST inverse solution now?
Is it already fixed? Do I have to update the toolbox or is there a way to check when I have to do it?
I have seen in github where to comment the line 30 but I cannot find in my local directories where is it brainentropy or best installed. If you could help me with that I could proceed with the analysis.
I saw in GUI there is a path hidden under ./brainstorm sorry for all the posts.
Thank you!! I already fixed it manually and it worked. But anyways is good to know I can update plugin.