Hi Experts,
I am attempting Time-frequency decomposition and had some doubt in the following aspects:
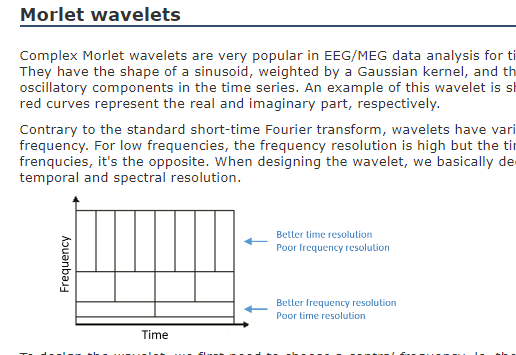
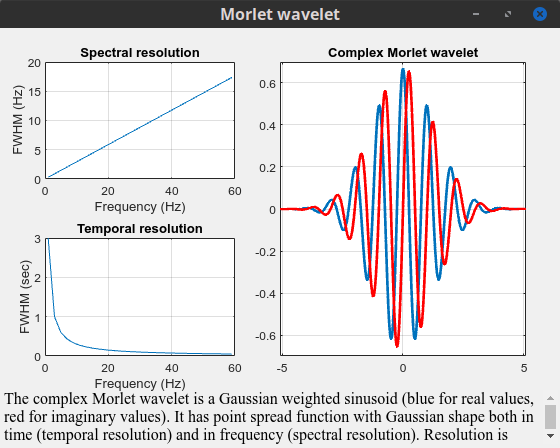
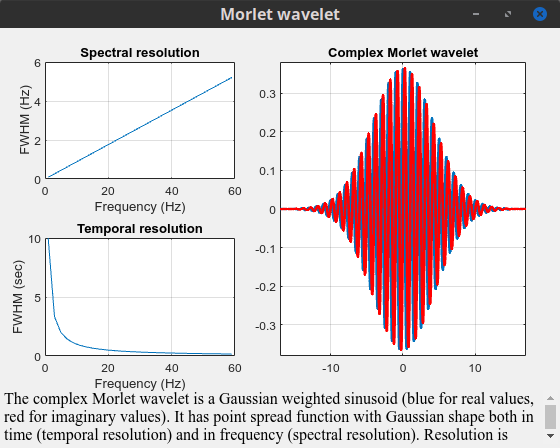
I read the tutorials but see that the time resolution and frequency resolution varies as explained in the following snapshot:
We want better time resolution at higher frequencies and better frequency resolution at lower frequencies. I am struggling to understand how would we achieve this variation if specify the time resolution as discussed below :
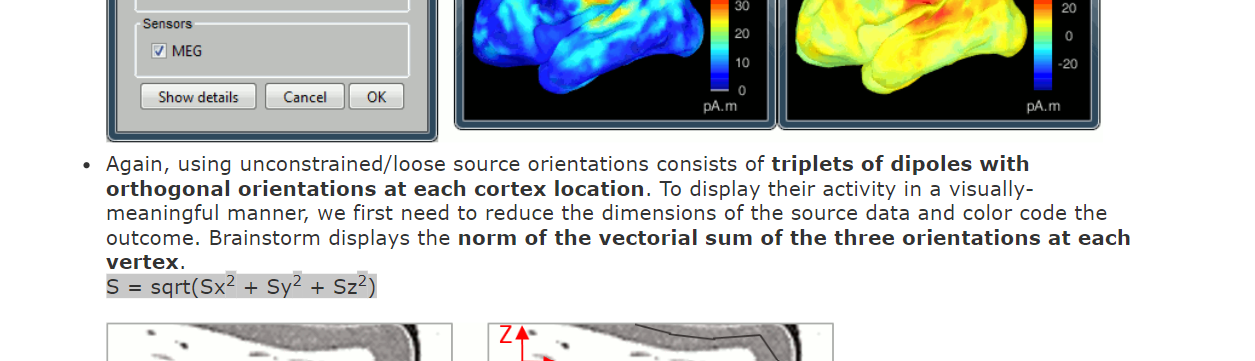
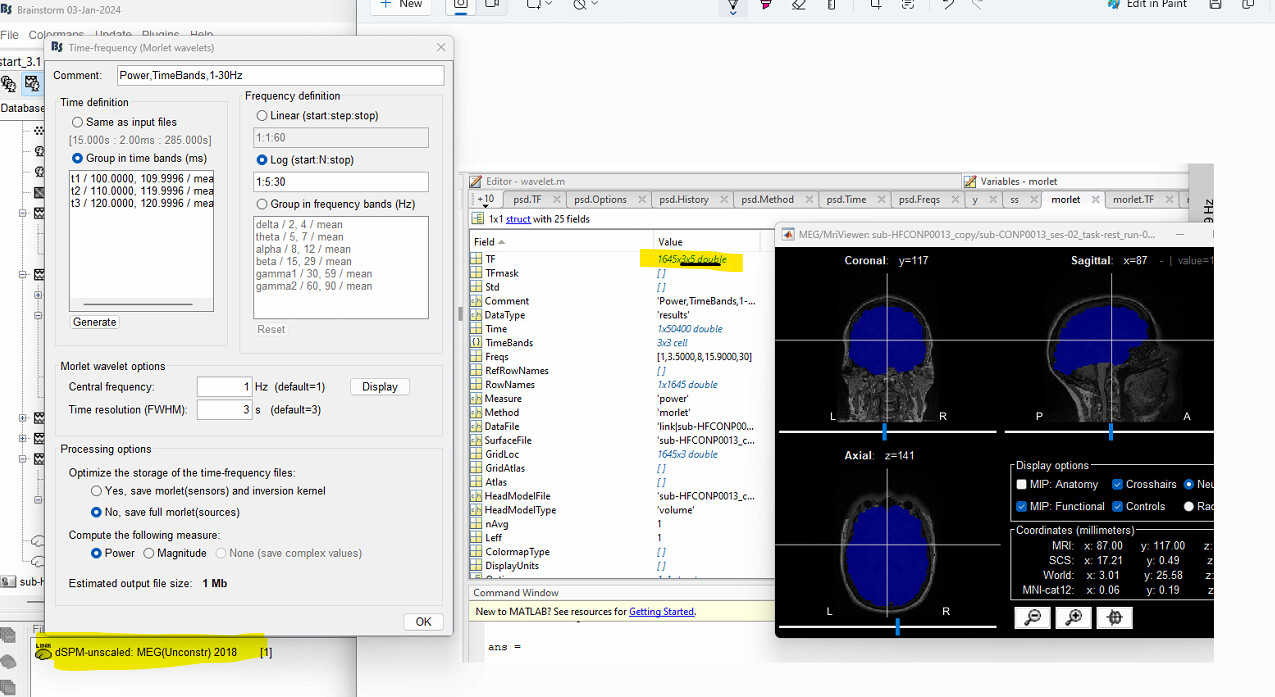
All my subjects have individual MRIs. I am using group template grid for all my subjects with 1 cm resolution to compare across all the subjects as forward head model and have 1645 grid points. I used (dSPM-unconstrained, unscaled) to compute the inverse model and have 3 dipoles per grid point. As seen here: The "Norm of vectorial sum of the three orientation is computed" to display on the cortex surface.
I am going to compute time-frequency plot on this reconstructed source time series data. I get Morlet wavelet time-frequency array output as (4935x135001x30x1) where 4935 = 1645*3 represents each dipole. I want just 1 time-frequency output per grid point ie. (1645x135001x30x1) . Is there a way to compute the norm as seen in visualisation and use it for time-frequency decomposition too ?
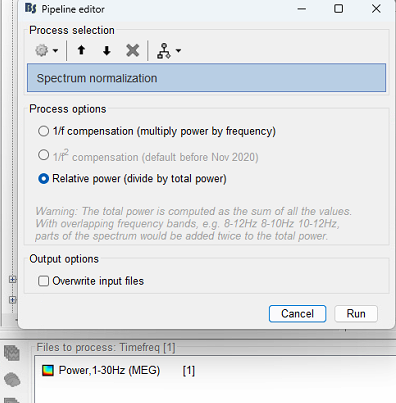
I have resting state MEG data. I haven't done Baseline normalisation. My goal is to compare time-frequency plots across the subjects. After computing Morlet wavelet time-frequency plot - would performing spectrum normalisation (relative power) enable me to compare across all individuals ?
I sincerely appreciate all your guidance and support thus far ! Thank you so much for your patience in resolving the doubts.
Thanks,
Rasmita
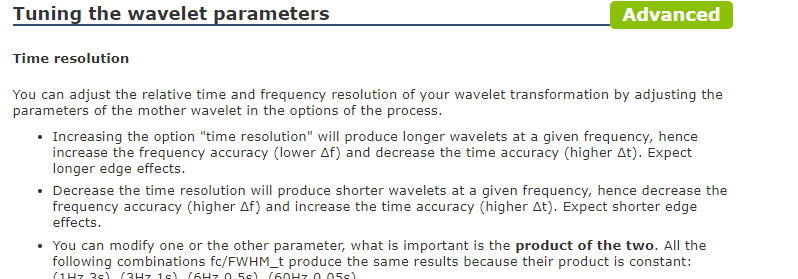
The time resolution, or FWHM (full-width at half-maximum), makes reference to the duration of the Gaussian curve (that is used to window the complex oscillations in the Morlet wavelet). The largest this value, a wider Gaussian (used to create the Morlet wavelet), then there are more cycles in the wavelet, thus better frequency resolution. However, by doing this, the wavelet becomes longer, thus it has a poorer frequency resolution. In the opposite way, by reducing FWHM, there will be less cycles in the wavelet, then a poorer frequency resolution but higher time resolution.
These effects can be seen by displaying the wavelet. Left, FWHM = 3s. Right FWHM = 10s.
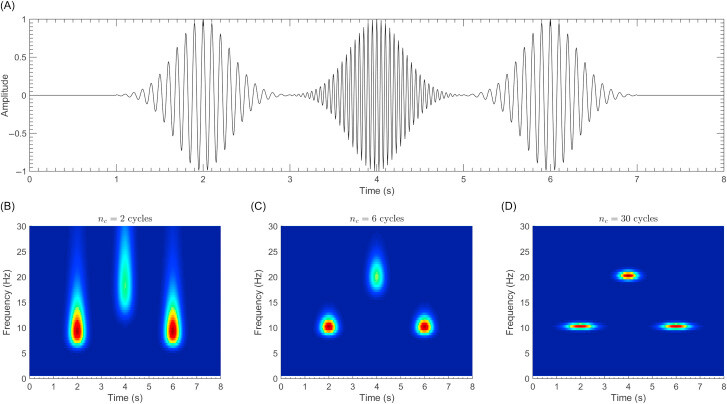
(A) Time series. (B), (C) and (D) power TF maps obtained for a Morlet wavelet of length 2, 6 and 30 cycles.
The default behaviour on computing TF decomposition with Morlet wavelets, is to sum the 3 TF power maps (one per vertex). Please post the steps that you follow to obtain a TF map of the size of the ImageKernel (or ImageGridAmp) field on the Source file, instead of the size of the GridoLoc field in the head model.
Note that the Spectrum normalization process normalizes only the frequency dimension at each time step. This is to say, for each time "column" of the TF map, the total power is computed (as sum of all frequencies) and the values are divided by it. So, the spectrum at each time point will be normalized by a different total power. Currently, there is not a process in the GUI to do the normalization of TF maps taking into account all frequency points and all time points.
Thank you for the references. Yes - I understood the tradeoff between FWHM and spectral/temporal resolutions. In one of Mike X Cohen's Videos, he specified a way to tackle the tradeoff by introducing variable FWHMs for a single TF plot. He suggested higher FWHM for lower frequency to have more frequency resolution and lower FWHM for higher frequencies.
Is this strategy used in Brainstorm's morlet wavelet's implementation ??
Thank you Raymondu for pointing out. I computed TF of the source data with the following config and exported it to matlab and see morlet.TF dimension 164535 which is representative of one dipole activity per grid.
I see. Then for a time point - the normalised frequency points would represent the fraction. Would you advise me to use these fraction frequency points for comparison across subjects ?
Also, I am using resting-state MEG data sampled at 2400Hz. Would you advise me to downsample the source time series prior to TF computation?
Yes it is, FWHM is not constant for all frequencies, as this would lead to more cycles in higher frequencies. In the provided FWHM in the GUI corresponds to the FWHM for the central frequency. If central frequency is 1 Hz, and FWHM (for the 1 Hz central frequency) is 3 s. The FWHM for each other frequency is given as FWHM / frequency. E.g., the wavelet centered at 30Hz has a FWHM of 100ms.
Standardization of measures (wrt to baseline or other reference periods) between participants is often recommended ; but again, it depends on your hypotheses supporting your project. Please consult the literature in your area and replicate the methods that have been published, if they match your assumptions.