Hi Experts,
I am attempting Time-frequency decomposition and had some doubt in the following aspects:
-
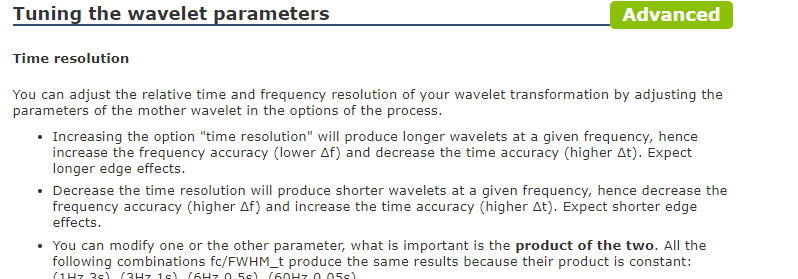
I read the tutorials but see that the time resolution and frequency resolution varies as explained in the following snapshot:
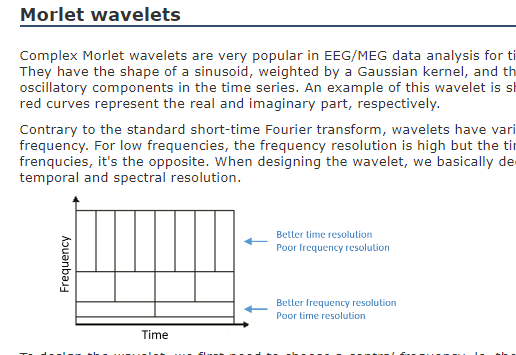
We want better time resolution at higher frequencies and better frequency resolution at lower frequencies. I am struggling to understand how would we achieve this variation if specify the time resolution as discussed below :
Can you help me understand this ? -
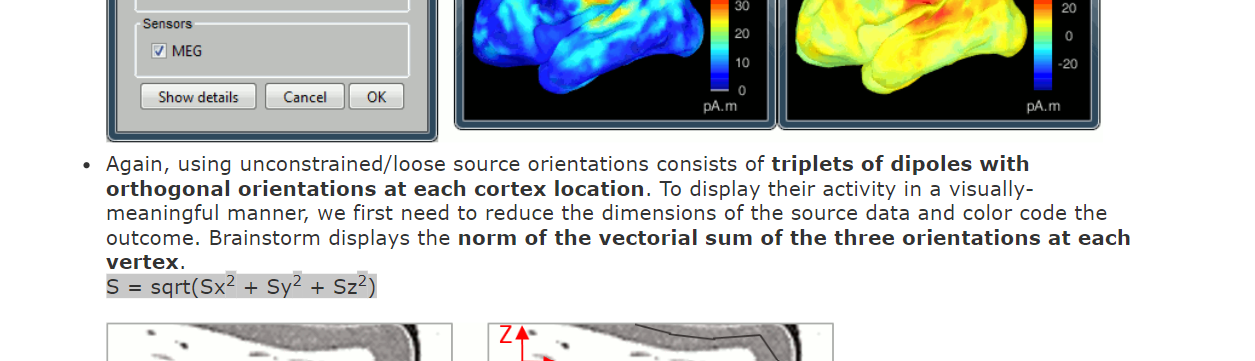
All my subjects have individual MRIs. I am using group template grid for all my subjects with 1 cm resolution to compare across all the subjects as forward head model and have 1645 grid points. I used (dSPM-unconstrained, unscaled) to compute the inverse model and have 3 dipoles per grid point. As seen here: The "Norm of vectorial sum of the three orientation is computed" to display on the cortex surface.
I am going to compute time-frequency plot on this reconstructed source time series data. I get Morlet wavelet time-frequency array output as (4935x135001x30x1) where 4935 = 1645*3 represents each dipole. I want just 1 time-frequency output per grid point ie. (1645x135001x30x1) . Is there a way to compute the norm as seen in visualisation and use it for time-frequency decomposition too ? -
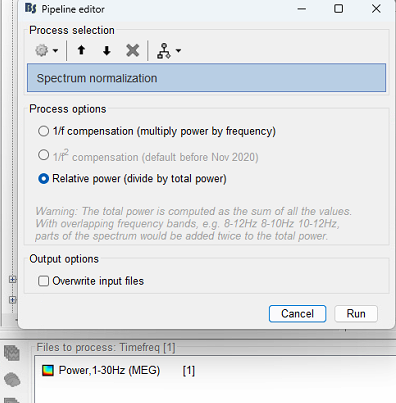
I have resting state MEG data. I haven't done Baseline normalisation. My goal is to compare time-frequency plots across the subjects. After computing Morlet wavelet time-frequency plot - would performing spectrum normalisation (relative power) enable me to compare across all individuals ?
I sincerely appreciate all your guidance and support thus far ! Thank you so much for your patience in resolving the doubts.
Thanks,
Rasmita