Hello again !
I had another question about the QT NIRS implementation in NIRSTORM (Scalp Coupling Index and Peak Power Spectrum).
When i import the raw file and pre-process with "Scalp Coupling Index", i can look at SCI and PSP:
SCI
PSP
Here i have one value for each channel in PSP and SCI.
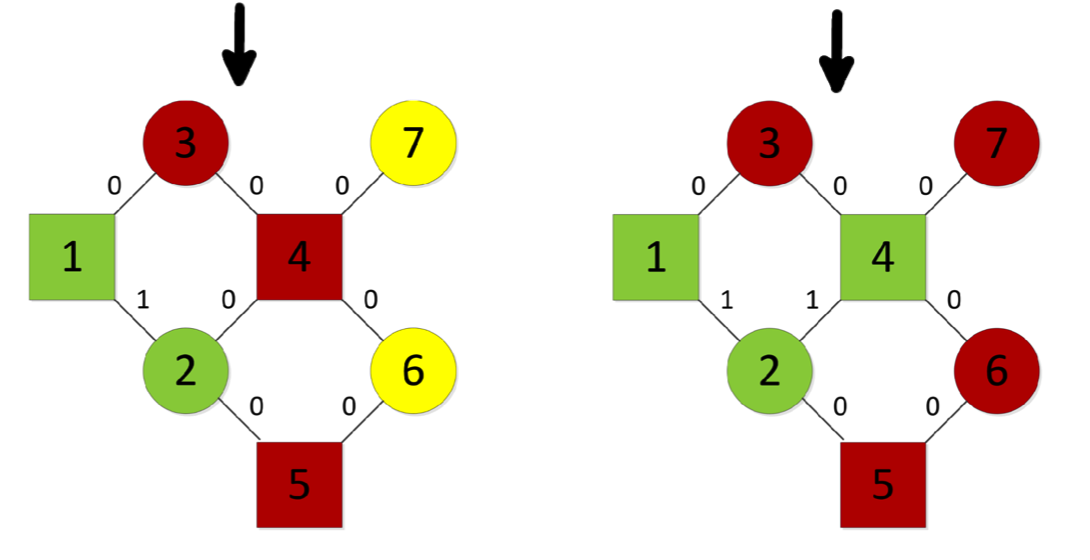
But, I know that when i used QT-NIRS, I could get the Quality value of the signal. I liked this metric because, if i understood correctly, it separated the signal in 5-sec windows (with default parameters) and compute SCI/PSP in each one. Then it made a % of quality which corresponded to the number of "good" window (where SCI > 80% and PSP > 10%). Then, the channel was rejected if the quality was < 75%
Is this possible to have this metric directly in NIRSTORM ? Did i miss the option ?
Best regards,
Brieuc
Hello,
Again a very interesting comment 
Currently, we use a 10-second window to compute SCI and power for each channel: nirstorm/bst_plugin/preprocessing/process_nst_sci.m at master · Nirstorm/nirstorm · GitHub
We then compute the median of the SCI across time: nirstorm/bst_plugin/preprocessing/process_nst_sci.m at master · Nirstorm/nirstorm · GitHub
This is this value that is then used when applying threshold. So that setting a minimum SCI value of 80% means that the channel was having a SCI value of at least 80% during at least 50% of the recording.
Right now, we don't have the option to export the SCI and power value as a function of time but that is a great idea. I will let you know when it is integrated into NIRSTORM.
Note: The implementation was inspired from fNIRS-analysis/tools/PHOEBE.m at master · GuilhermeZimeo/fNIRS-analysis · GitHub
Edouard
2 Likes
Hello,
i started working on it and have a working prototype here: Improve SCI - return SCI as function of time by Edouard2laire · Pull Request #254 · Nirstorm/nirstorm · GitHub
You can try it by editting the bst_plugin file, line 600
from
PlugDesc(end).URLzip = 'https://github.com/Nirstorm/nirstorm/archive/master.zip';
to
PlugDesc(end).URLzip = 'https://github.com/Edouard2laire/nirstorm/archive/refs/heads/sci-time.zip';
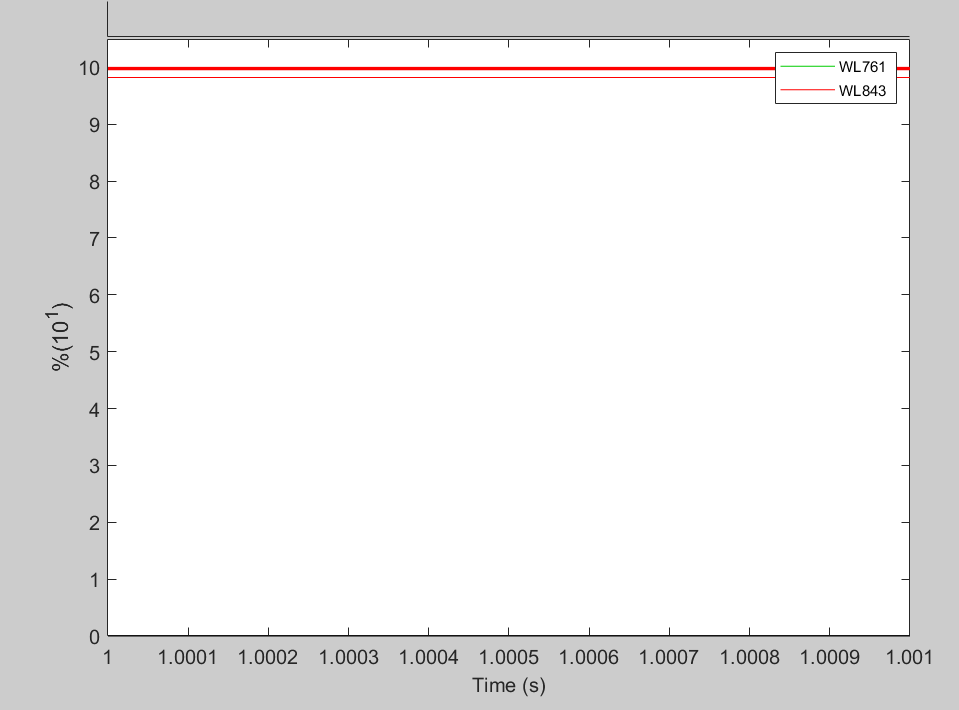
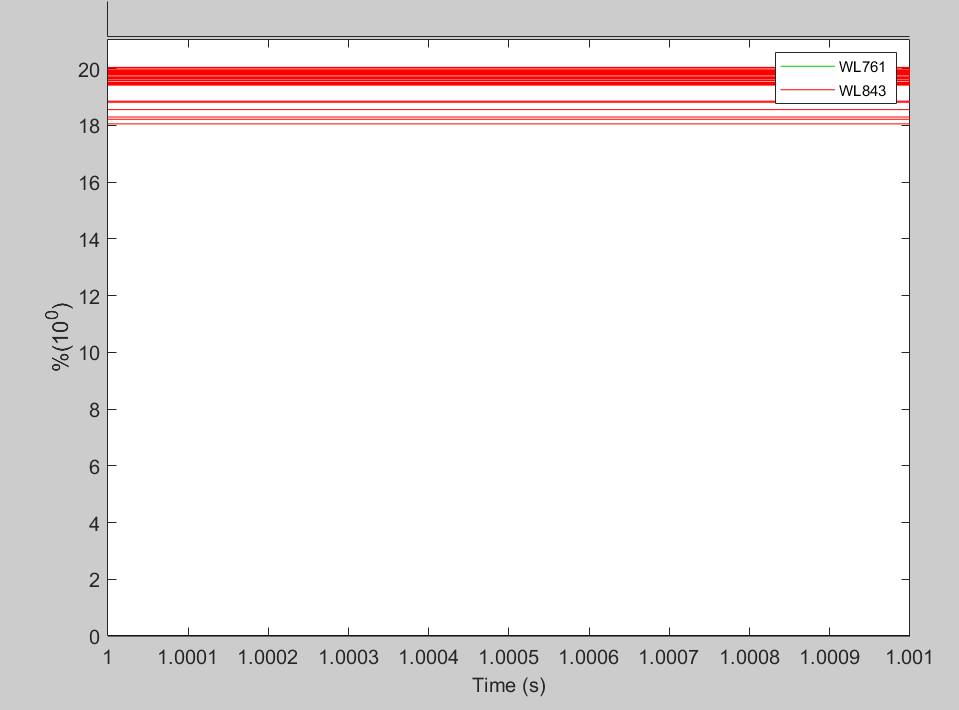
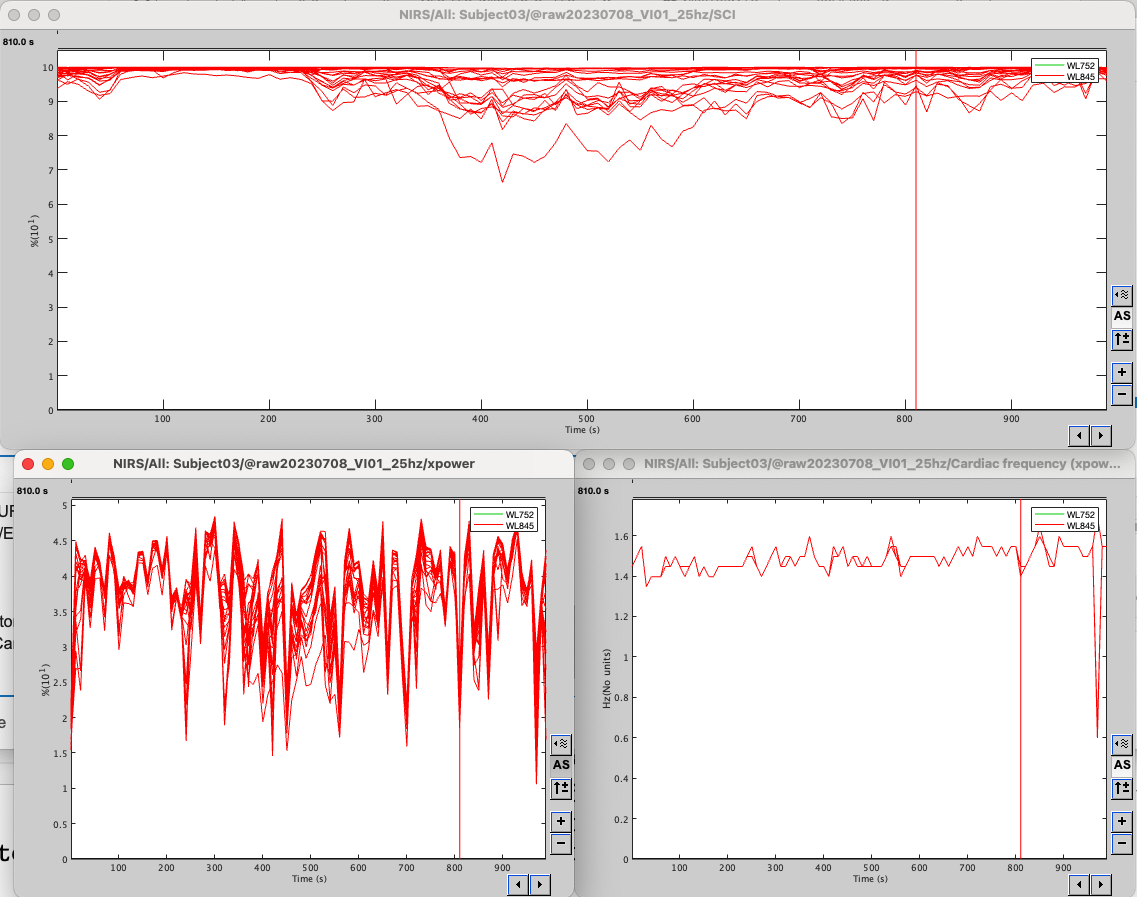
After updating nirstorm, calling SCI will now create 3 files ;
SCI, xpower and Cardiac frequency (xpower)
Cardiac frequency (xpower) correspond to the frequency at which the max power is found for the estimation of xpower and should therefore correspond to the cardiac frequency of the subject.
Calling 'Average in time' then median on SCI or xpower should give you the same results as before.
Btw, i am not very happy with the name xpower in the database as it is not nescessarly clear to what it refers . Do you have any suggestion?
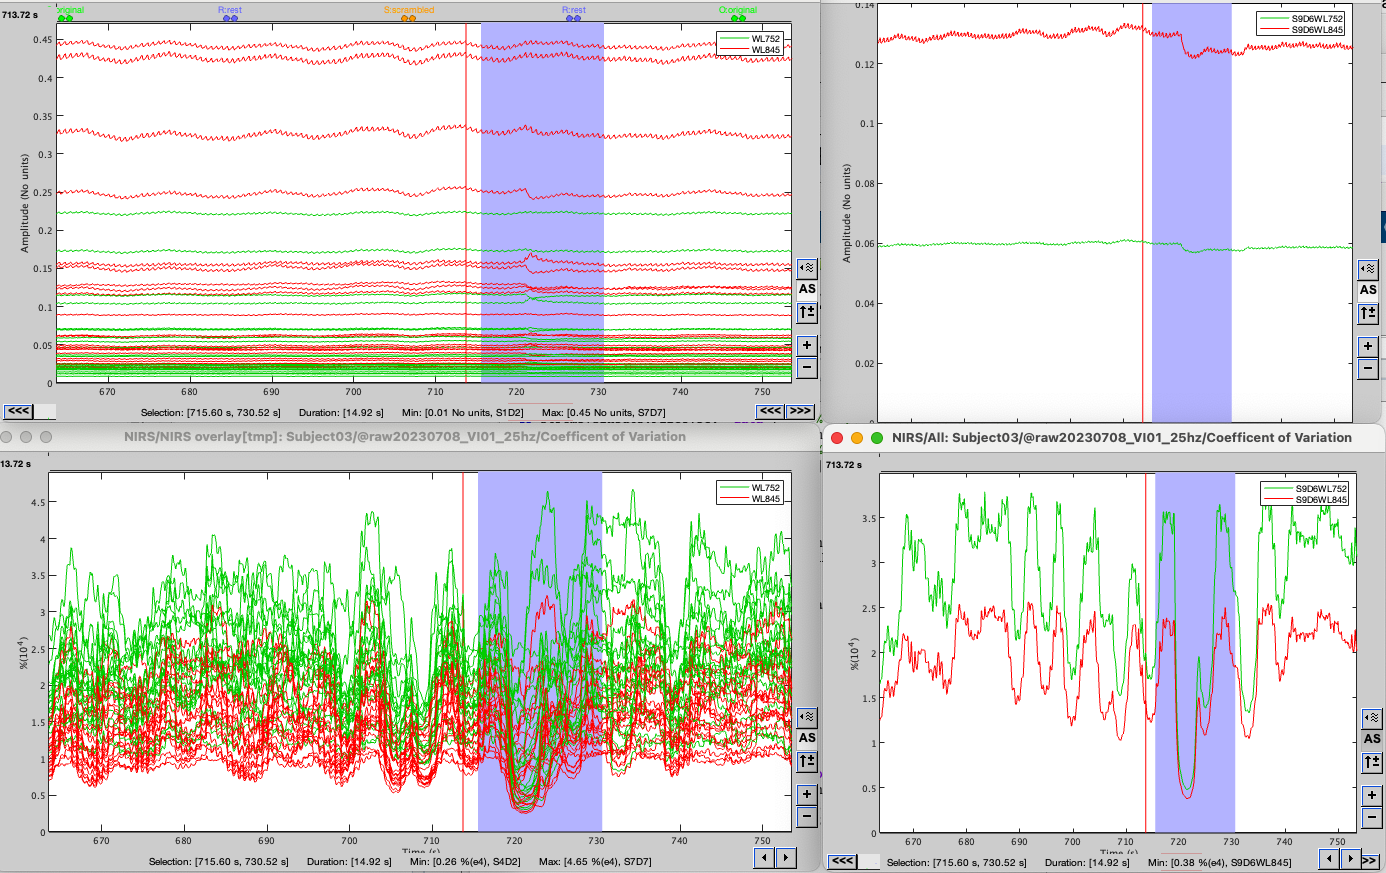
One of the thing i am trying to do before merging this, is to be able to visualize at the same time, the signal and the SCI. i think it could help with the marking of motion / artifact in the signal if we could do that.
Edit; For example here, we can see how CV is evolving with time. using a similar window of 10 seconds:
Edit: This has been done here: Improve SCI - return SCI as function of time by Edouard2laire · Pull Request #254 · Nirstorm/nirstorm · GitHub . i will finish cleaning the code tomorrow as i have to go teaching now
2 Likes
Hello Edouard ! Thanks for your answer 
I'm not very familiar with GitHub in general. Sooo I did not find the line you were talking about in the linked scripts.
For me, xpower referred to PSP (Peak Spectrum Power) so maybe you could name it this way ? Or maybe i did not understand what xpower is  It is used in the qtnirs script:
qtnirs.m (64.9 KB)
In the related article, I think that the authors only refers to Power Spectrum: Optica Publishing Group
A colleague found out few days ago that it is possible to see SCI in qt-nirs with signals at both wavelength, showing if they are superimposed or not. Maybe you could take a look in the qt nirs script ?
Have a good day !
Brieuc
Hello,
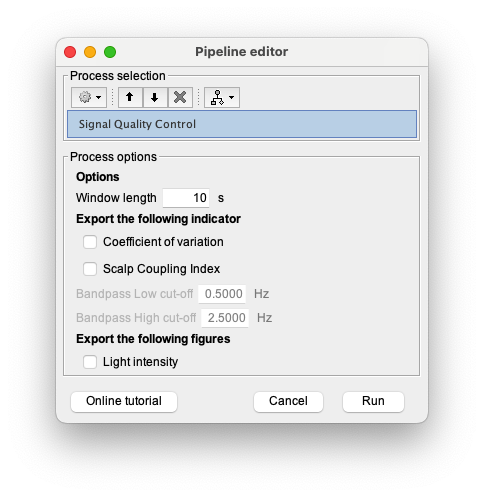
the process is now part of NIRSTORM. you can update nirstorm and try it
I will add the documentation here: https://neuroimage.usc.edu/brainstorm/Tutorials/NIRSTORM#Signal_quality_check in the next few days
One thing that would be nice would be to be able to reproduce the following figure:
i will have a look next week.
1 Like