NIRSTORM: a Brainstorm extension dedicated to functional Near Infrared Spectroscopy (fNIRS) data analysis, advanced 3D reconstructions, and optimal probe design.
Authors: Édouard Delaire, Dr. Christophe Grova
This tutorial aims to introduce NIRSTORM. NISTORM is a plug-in dedicated to the analysis of functional near-infrared spectroscopy (fNIRS) data inside the Brainstorm software.
This tutorial covers three main features of the NIRSTORM package:
(1) Data importation and preprocessing
(2) Data analysis at the channel level
(3) Data analysis on the cortex after 3D reconstruction.
This tutorial assumes that you are already familiar with the Brainstorm environment. If this is not the case, we recommend following Brainstorm tutorials 1 to 7.
Citation
If you are using NIRSTORM, please cite:
Édouard Delaire, Thomas Vincent, Zhengchen Cai, Alexis Machado, Laurent Hugueville, Denis Schwartz, Francois Tadel, Raymundo Cassani, Louis Bherer, Jean-Marc Lina, Mélanie Pélégrini-Issac, Christophe Grova, NIRSTORM: A brainstorm extension dedicated to fNIRS data analysis, advanced 3D reconstructions, and optimal probe design, Neurophoton. 12(2), 025011 (2025), doi: 10.1117/1.NPh.12.2.025011.
Contents
Introduction
Presentation of the experiment
The acquisition protocol and the general workflow presented in this tutorial from fNIRS optimal montage design to 3D reconstruction is described in further detail in Cai et al, 20211.
We are considering fNIRS data acquired on one healthy subject, featuring one run of 19 minutes acquired with a sampling rate of 10Hz on a CW fNIRS Brainsight device (Rogue-Research Inc., Montreal, Canada)
- Finger tapping task of the left hand: 20 blocks of 10 seconds of finger tapping task each, with a rest period of 30 to 60 seconds.
- Personalized optimal montage targeting the right motor knob, featuring 3 dual wavelength sources, 15 detectors, and 1 proximity detector. 2 wavelengths: 685nm and 830nm
3T high-resolution anatomical MRI data processed using FreeSurfer 5.3.0. (https://surfer.nmr.mgh.harvard.edu)
Setup
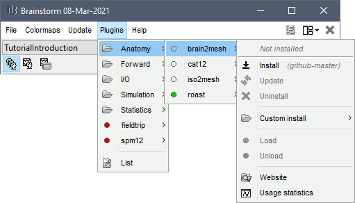
Using the Brainstorm plug-in system, download the following plugins :
NIRS > NIRSTORM : the core of NIRSTORM package
NIRS > MCXLAB-cl : a plugin for the estimation of the fNIRS forward model using Monte Carlo simulations of infrared light photons in the anatomical head model
Inverse > Brainentropy: our package dedicated to solving the fNIRS reconstruction inverse problem using the Maximum Entropy on the Mean framework
Downloading the dataset.
The total disk space required after data download and installation is ~1.3Go. The size is quite large because of the optical data that are required for the computation of the forward model. The dataset can be downloaded from: https://osf.io/md54y/?view_only=0d8ad17d1e1449b5ad36864eeb3424ed .
License: This tutorial dataset (fNIRS and MRI data) remains proprietary of the MultiFunkIm Laboratory of Dr Grova, at Concordia School of Health, Concordia University, Montreal. Its use and transfer outside the Brainstorm tutorial, e.g. for research purposes, is prohibited without written consent from our group. For questions please contact Dr. Christophe Grova: christophe.grova@concordia.ca
Data importation and preprocessing
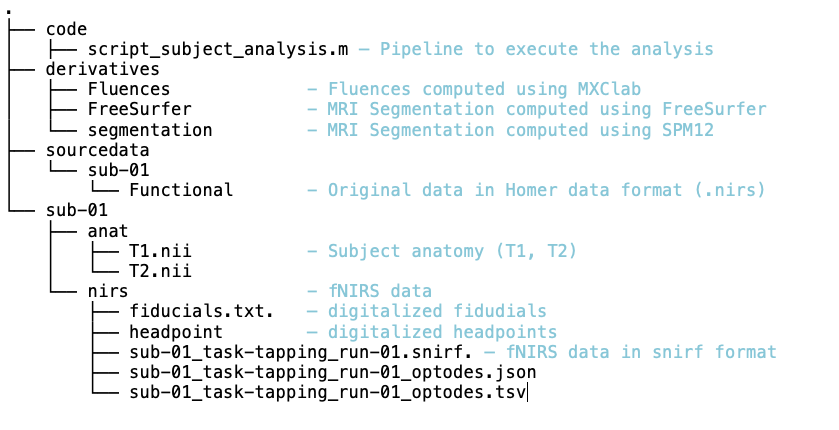
Description of the data organization The data are organized using the following scheme according to BIDS standards:
Data Importation
- Start Brainstorm (Matlab scripts or stand-alone version)
Select the menu File > Create new protocol. Name it "TutorialNIRS" and select the options: "No, use individual anatomy", "No, use one channel file per acquisition run (MEG/EEG)".
In terms of sensor configuration, fNIRS is similar to EEG and the placement of optodes may be subject-specific. Also, the channel definition will change during data processing, this is the reason why you should always use one channel file per acquisition run, even if the optode placement remains the same.
Importing anatomical data
Import anatomical data Following tutorials 1-2, import the subject anatomy segmented using freesurfer using the following fiducials coordinate in MRI coordinate:
Switch to the "anatomy" view of the protocol.
Right-click on the TutorialNIRS folder > New subject > sub-01
- Leave the default options you set for the protocol
Right-click on the subject node > Import anatomy folder:
- Set the file format: "Freesurfer + volumes atlases"
- Select the folder: nirstorm_tutorial_2024/derivatives/FreeSurfer/sub-01
- Number of vertices of the cortex surface: 15000 (default value)
- Answer "yes" when asked to apply the transformation.
- Set the 3 required fiducial points, indicated below in (x,y,z) MRI coordinates.
You can right-click on the MRI viewer > Edit fiducial positions > MRI coordinates, and copy-paste the following coordinates in the corresponding fields. Click [Save] when done.
- Nas : [ 131, 213, 117 ]
- Lpa : [ 51, 116, 80 ]
- Rpa : [ 208, 117, 86 ]
- Ac : [ 131, 128, 130 ]
- Pc : [ 129, 103, 124 ]
- Ih : [ 133, 135, 176 ]
- Once the anatomy is imported, make sure that the surface "mid_15002V" is selected (green). If it is not, right-click on it and select "set as default cortex". This will define the cortical surface on which fNIRS 3D reconstructions will be estimated.
- Resample the head mask to get a uniform mesh on the head. For that, right-click on the head mask and select remesh, then 10242 vertices. This allows us to get a uniform mesh on the head.
Your database should look like this:

Note that the elements that appear in green correspond to those used for later computations. It is important that the new head mask (remeshed) and the mid-surface (mid_15002V) are selected and appear green in your database.
Additionally, we defined the hand knob on the mid-surface. Open the mid surface, and use Atlas > Add scouts to Atlas and select the FreeSurfer annotation: NIRSTORM-data/derivatives/segmentation/sub-01/scout_hand.annot
Import fNIRS functional data
The Brainsight acquisition software produced the functional fNIRS data used in this tutorial and is available in the data subfolder of the fNIRS sample folder(nirstorm_tutorial_2024/sub-01/nirs). The data were exported according to the BIDS format: See https://bids-specification.readthedocs.io/en/stable/modality-specific-files/near-infrared-spectroscopy.html for a description of each file.
To import this dataset in Brainstorm:
- Go to the "functional data" view of the protocol.
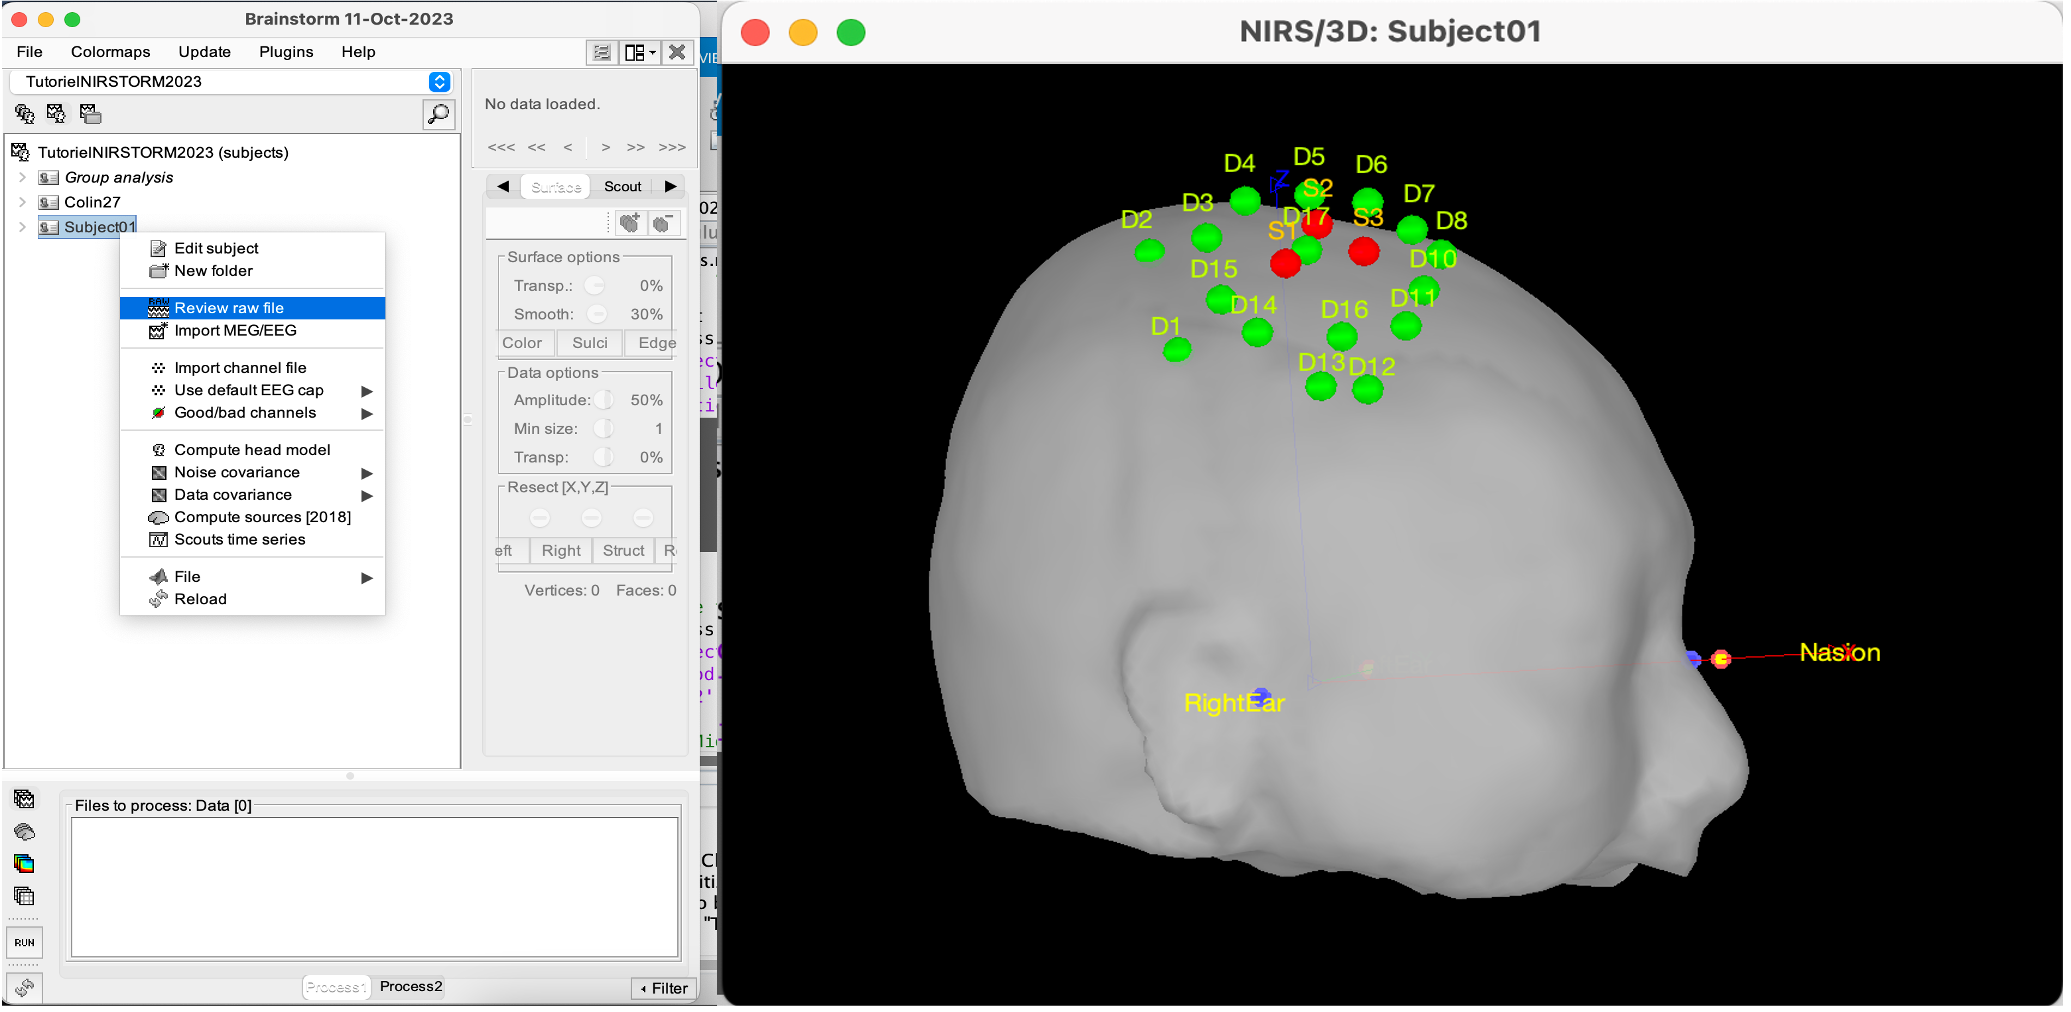
Right-click on sub-01 > Review raw file Select file type NIRS: SNIRF (.snirf)
- Select file nirstorm_tutorial_2024/sub-01/nirs/sub-01_task-tapping_run-01.snirf
Co-registration of the fNIRS sensors with the anatomical MRI
In the same way as in the tutorial "Channel file / MEG-MRI coregistration", the registration between the MRI and the fNIRS is first based on the identification of three anatomical reference points identified in the MRI data and digitized together with the location of all sensors: the Nasion, Left and Right ears.
First, a rigid registration matrix (3 rotations, 3 translations) is estimated by aligning these three fiducials. Registration should then be refined either using additional head points (e.g. sensor locations or full digitalization of the head shape of the participant) or eventually using manual adjustment. We recommend using additional headpoints to refine the spatial registration.
The initial registration is based on the three fiducial points that define the Subject Coordinate System (SCS): nasion (NAS), left ear (LPA), right ear (RPA). The visual identification of these three anatomical landmarks on the anatomical MRI has been completed using the MRI viewer in the previous section.
Once sensors or the cap have been installed on the head of the participant, these same three fiducial points have also been digitized on the head of the participant before fNIRS acquisition, together with the location of all other sensors (fNIRS sources, detectors, and eventually EEG electrodes), once sensors have been installed.
We recommend using a tracking system to digitize the position of the 3 anatomical landmarks and sensor locations using a 3D tracking device (e.g. Polhemus or Brainsight neuronavigation system considered here). The positions of these points are saved in the fNIRS datasets (see fiducials.txt).
When the fNIRS recordings are loaded into the Brainstorm database, they are aligned on the anatomical MRI data using these anatomical landmark points: the NAS/LPA/RPA points digitized with Brainsight are matched with the ones we placed in the MRI Viewer.
To review the accuracy of fNIRS/MRI coregistration:
Right-click on NIRS-BRS sensors (97) > Display sensors > NIRS (pairs). This will display sources as red spheres and detectors as green spheres. Source/detector pairings are displayed as blue cylindrical lines.
Right-click on NIRS-BRS sensors (97) > Display sensors > NIRS (scalp). This will display sources as red spheres and detectors as green spheres
* To check the coregistration, Right-click on NIRS-BRS sensors (97) > MRI registration > check.
For more information about the coregistration accuracy and how to refine the coregistration, please consult "Channel file / MEG-MRI coregistration"
Review of recording
Select "sub-01 |- sub-01_task-tapping_run-01 |- Link to raw file -> NIRS -> Display time series". It will open a new figure with superimposed time courses of all fNIRS channels.

If coloring is not visible, then right-click on the figure and select "Montage > NIRS Overlay".
Indeed, brainstorm uses a dynamical montage, called NIRS Overlay, to regroup and color-code fNIRS time series depending on their wavelength (red: 830nm, green:686nm). Therefore, when clicking to select one curve for one wavelength, NIRSTORM will also select the other wavelength for the same pair.
Importing events
In this dataset, the events are directly encoded in the .snirf file and automatically imported by Brainstorm. In case your events are not encoded in your nirs file, you can import them manually (either from a specific channel, or external file). For more information, please consult https://neuroimage.usc.edu/brainstorm/Tutorials/EventMarkers
The events describing the task are currently extended events (having onset + duration). To facilitate trial averaging latter, it is recommended that you duplicate the events linked to your task and convert them to simple events using the start of each trial. Therefore, for this tutorial, duplicate the event 'tapping', convert it to simple, and rename it tapping/start.
Data analysis at the channel level
This section introduces the process of estimating the hemodynamic response to a finger-tapping task at the channel level.
This figure illustrates the full pipeline proposed in this tutorial, which will be described in further detail next.
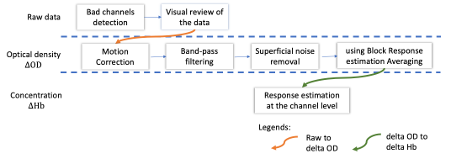
Pre-processing Pre-processing functions can be applied to fNIRS data files by adding the "Link to raw" file to the processing box or dragging and dropping it onto the box. Once it is in place, click on the "Run" button to execute the process. At this stage, both Brainstorm and NIRSTORM-specific processes (present under the nirs submenu), can be applied without any distinction to the nirs files.
Signal quality check
(** soon **)
Bad channel detection
Process: NIRS > Pre-process > Detect Bad channels
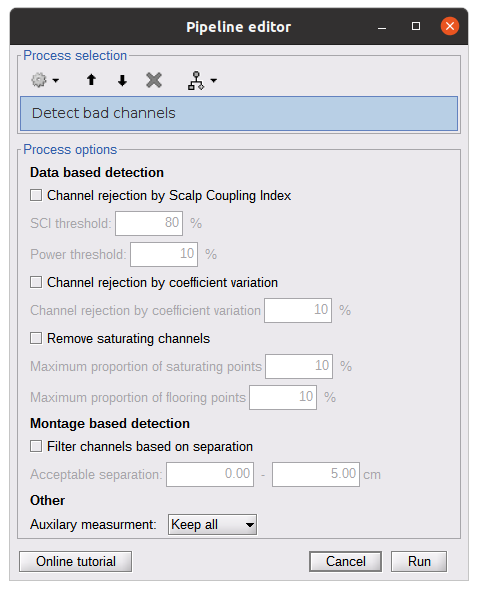
The Detect Bad Channels process aims at labeling each channel as good or bad based on a set of criteria:
- Negative value: Channel with negative values
- Scalp coupling index (SCI): SCI reflects the signal's correlation for each wavelength within the cardiac band.
- Power reflects the % of the power of the signal within the cardiac band. This process removes channels featuring Low SCI or low power within the cardiac band.
- Coefficient of variation (CV): reflects the dispersion of data points around the mean. This process removes channels featuring high CV.
- Saturating channels: Detect and remove channels showing saturation (how is this done) Source-Detector separation: This process removes the channels outside the acceptable source-detector distance range.
By default, if a wavelength of a channel is considered as bad, then the entire channel, i.e. signals from both wavelengths, is discarded.
Additionally, the process proposes to either keep or remove auxiliary channels (non-Nirs channels). Keep the auxiliary channels if your nirs system also recorded some peripherical measurements (heart rate, respiration …). In our case, there is no information in the auxiliary channel so we can discard them.
Raw to delta OD
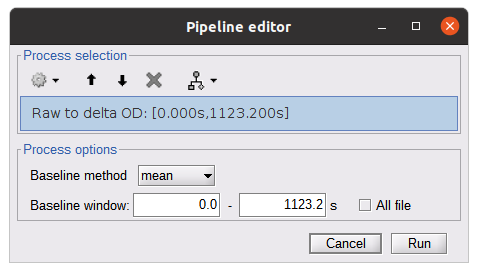
This function converts the light intensity to variations of optical density.
Process: nirs > dOD and MBLL > Raw to delta OD
Description:
Convert the fNIRS data from raw to delta OD delta OD=-10 log_10(I/I_0 ) Channels with negative values must have been removed (see bad channel detection section), before applying this log transformation.
Parameter:
- Baseline window: Period of time used to estimate the baseline intensity I_0
Motion correction
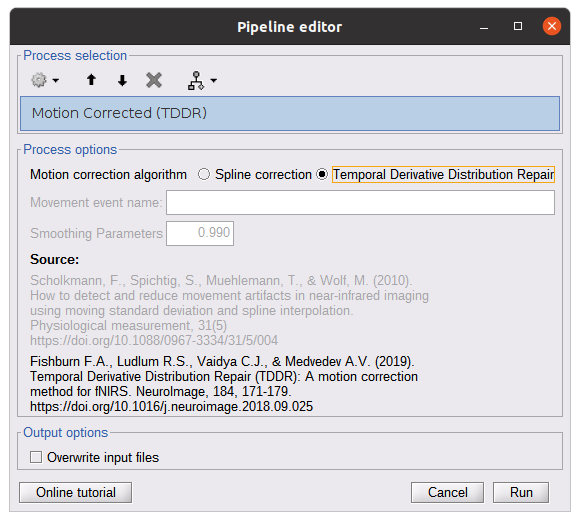
Process: nirs > pre-process > motion correction
Input: Raw data, delta OD, or delta Hb Description:
Description:
Apply a motion correction algorithm to the data. Two algorithms are implemented: (1) Spline correction (2) Temporal derivative distribution repair (TDDR)
Parameter:
Spline correction: After selecting motion visually on the fNIRS signal viewer, spline interpolation is used to smooth the signal during motion.[2]
- Movement event name: Name used to visually identify the motion Smoothing parameter: Value between 0 and 1 controlling the level of smoothness desired during the motion
Temporal derivative distribution repair: automatic motion correction algorithm that relies on the assumption that motion will introduce outliers in the temporal derivative of the optical density.[3]
There is no additional parameter
In this tutorial, we will be using Temporal derivative distribution repair.
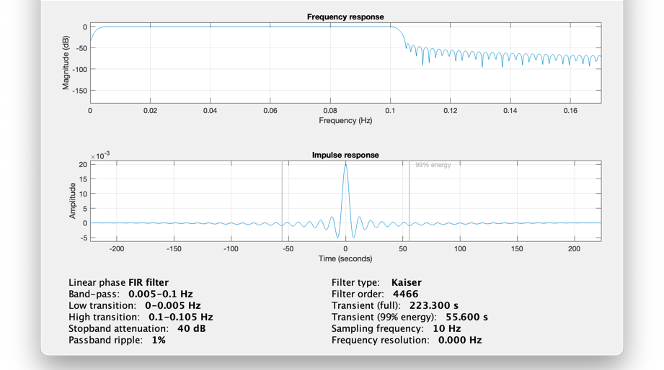
Band-pass filter
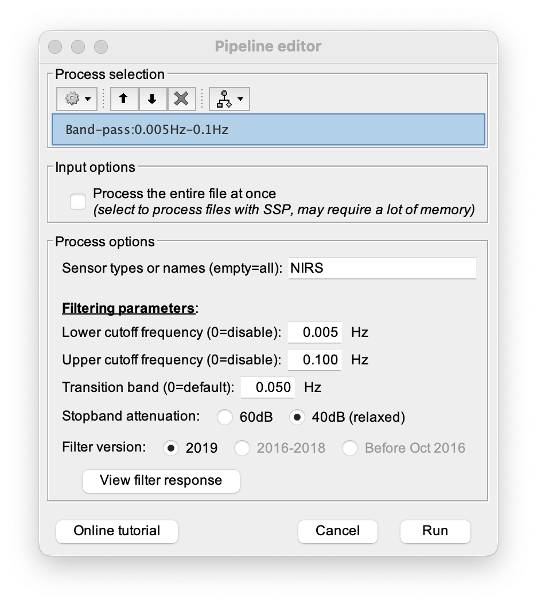
Process: pre-process > band-pass filter
Input: delta OD, or delta Hb Description:
Apply a finite impulse response (FIR) filter to the data. If you want to use an infinite impulse response filter (IIR), use the process from NIRS > pre-process > band-pass filter
Parameters:
- Sensor type: apply the FIR only to selected channels (useful if storing additional data in the auxiliary channels such as accelerometer, blood pressure …)
- Lower-cutoff / Upper-Cutoff: Cuttoff frequencies for the filter
- Transition band: Error margin for the filter before/after the cutoff.
Warning: it is important to specify this parameter for fNIRS data. Use the View filter response button to ensure that the design filter corresponds to what you desire.
- Stopband attenuation: Gain of the filter outside of the transition band. We recommend using 40 dB.
- Filter version: Version of the brainstorm implementation of the filter (We recommend using the 2019 version)
For more information about the filtering, see tutorial 3.
Note: we recommend always checking that the filter used corresponds to your expectation using the ‘View filter response button”
Regressing out superficial noise
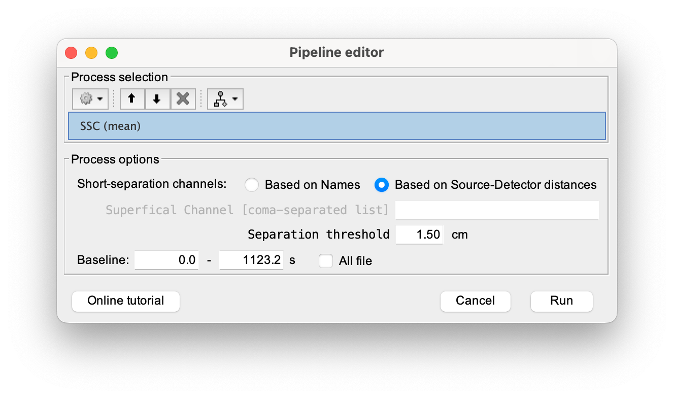
NIRS > Pre-process > Remove superficial noise
This process consists of regressing out superficial noise using the mean of all the channels identified as short-separation channels, following the methodology proposed in Delaire et al, 20244
Parameters:
- Method to select short-channel:
(1) based on Name: manually specify the name of the short-channels (eg. S1D17, S2D17…)
- (2) based on Source-Detector distance: use the Source-Detector distance to detect short-separation channels.
- (if 1) Superficial channels: list of short separation channels
- (if 2) Separation threshold: maximum Source-Detector distance to be considered as short-channel
- Baseline: Segment of the baseline signal that is considered to calibrate the superficial noise removal procedure. Select a window relatively free of motion. This is mainly useful for long-duration recordings, or when a part of your signal is heavily corrupted with motion.
Window averaging
The objective is to analyze the response produced by the motor paradigm. The following section presents how to analyze an fNIRS-elicited hemodynamic response by averaging single trials, therefore it corresponds to tutorials 15 and 16, presenting how to analyze a bioelectrical evoked response using EEG/MEG. We recommend the reader to consult those two tutorials for further details.
To estimate the hemodynamic response produced by the motor paradigm, we will extract epoch data locked on the motor paradigm starting 10s before the task and ending 30s after the beginning of the paradigm.
Use the import in database tool with the following parameters.
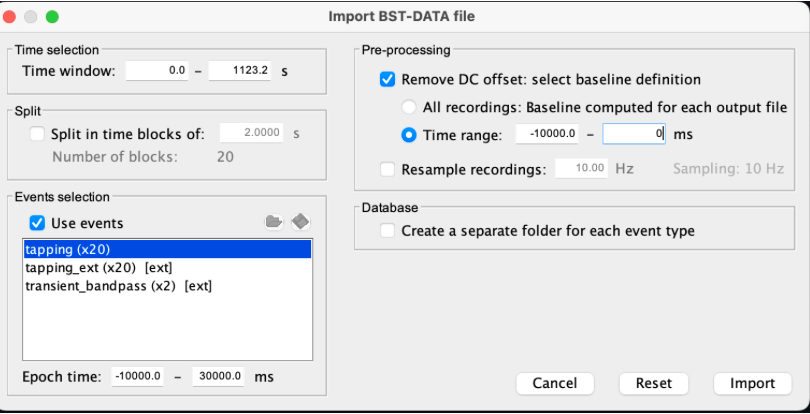
The Epoch time should range from -10s to 30s (i.e. -10,000 ms to 30,000 ms). This means that we will extract data segments 10 seconds before the stimulation event to check for signal stability, and 30 seconds after stimulation to observe the return to baseline of the hemodynamic response. Remove DC offset will:
* Compute the average of each channel over the baseline (pre-stimulus interval: [-10 000, 0]ms) Subtract it from the channel at every time instant (full epoch interval: [-10 000,+ 30 000]ms). This option removes the baseline value of each sensor.
If you are expecting a response to start before the time 0; make sure to set the pre-stimulus interval accordingly to not contain the start of the response.
⚠️ Please note that in Brainstorm the time is specified in milliseconds and not in seconds. To indicate a time of 10 seconds, the user should then write 10,000ms. This comes from the fact that the software is mainly developed for EEG/MEG where the response is occurring at the millisecond scale.
This import will create 20 files, each corresponding to an individual trial, which you can examine separately. Any trial with excessive movement can be rejected by right-clicking on it and selecting the "Reject trial" option. In our example, we want to reject the first trial as it is contaminated by the transient bandpass filter effect.
To calculate the average response, drag and drop the 20 files into the processing box, which will display "tapping (20 files) [19]". The number 19 indicates that only 19 out of the 20 files will be used (since we rejected trial #1).
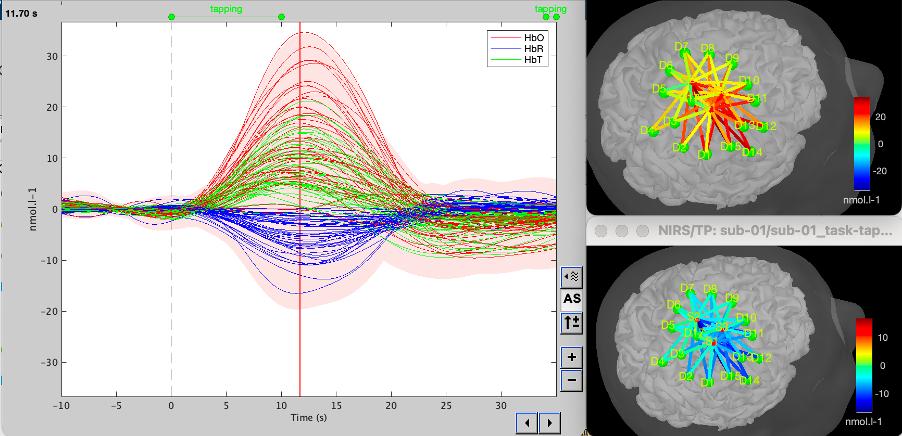
You can then visualize the resulting average fNIRS response by inspecting the AvgStderr file: "tapping (19)".
Delta OD to delta [HbO], [HbR] & [HbT]
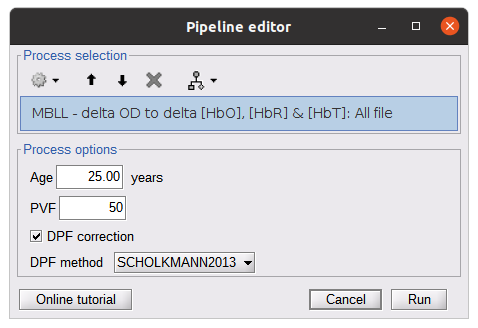
This process converts the optical density changes to changes in concentration of oxy-, deoxy-, and total hemoglobin. To perform this conversion, we apply the modified Beer-Lambert law using the method described in Scholkmann et al, 20135 to estimate the differential path length factor (DPF). Tuning the differential path length factor depends on the age of the participant and the wavelength. The partial volume factor (PVF) is also corrected. Most of the software recommends using 50 as a factor for the PVF.
Uncorrected data can also be calculated by unchecking the DPF correction.
Data analysis on the cortical surface
In the previous section, we were able to estimate and analyze the hemodynamic response elicited by a finger-tapping task at the sensor level. The objective of this section is to reconstruct the response, i.e. HbO, HbR, and HbT fluctuations, along the cortical surface beneath our fNIRS montage. Two diffuse optical tomography (DOT) methods have been implemented and validated in NIRSTORM: (i) the Minimum Norm Estimate (MNE) or the Maximum Entropy on the Mean. (add the refs to both methods) For more information on the use of these inverse problem solvers on EEG/MEG data please consult Tutorial 22: Source Estimation and Best: Brain Entropy in space and time.
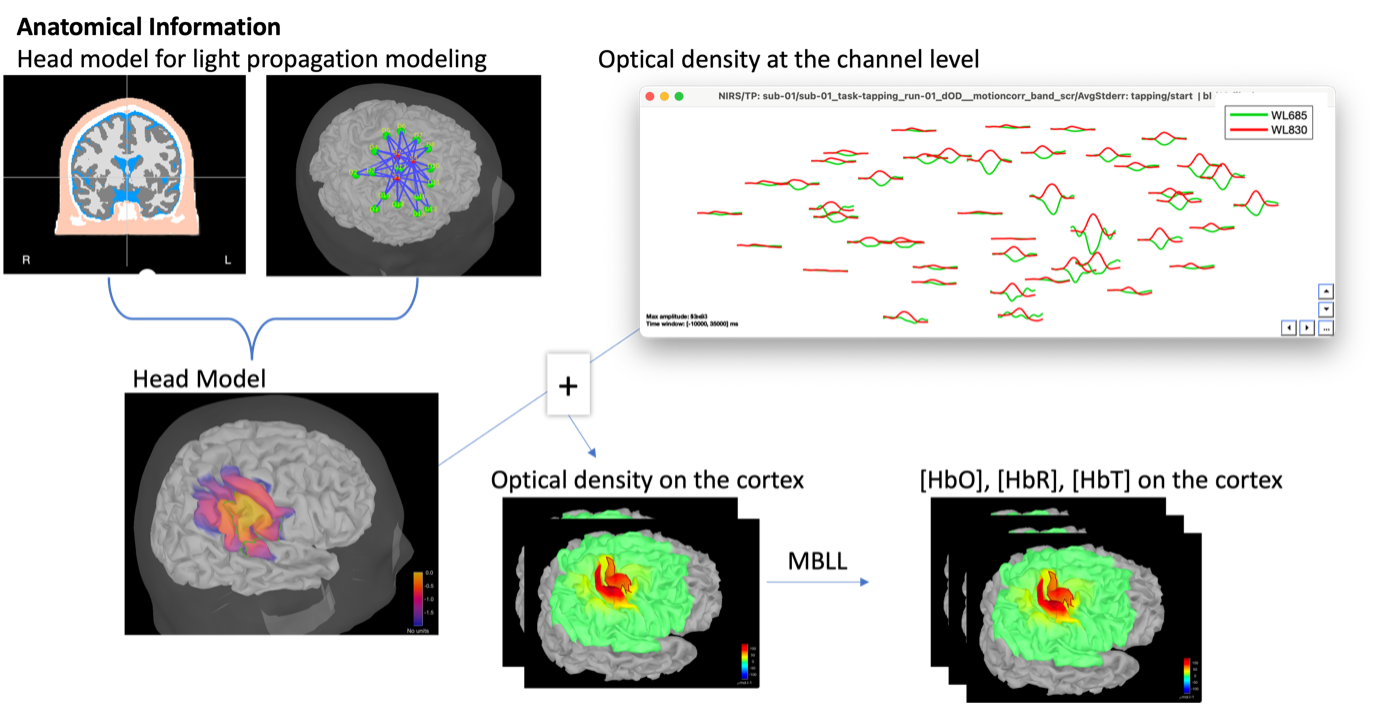
Illustration of the pipeline for fNIRS 3D reconstruction and analysis on the cortical surface.
Computation of the fNIRS forward model
The process of reconstructing fNIRS responses along the cortical surface relies on solving what is known as an ill-posed inverse problem. However, before proposing methods to solve this inverse problem, it is mandatory to solve the well-posed forward problem, which consists of modeling in a realistic manner the propagation of infrared light inside the head. Solving the fNIRS forward model will consist of generating a sensitivity matrix that maps how a local change in light absorption along the cortical region will impact the measured changes in optical density on every scalp fNIRS channel.
Segmentation of the MRI
To estimate the propagation of infrared light inside the head, we need to compute two preliminary maps: (i) a volumic segmentation of the head into 5 tissues segmentation (skin, CSF, grey matter, white matter).
This can be done using SPM. Right-click on the T1 MRI and use MRI segmentation > SPM12. Answer ‘yes’, to use the T2 image to refine the MRI segmentation.
Rename the segmentation to ‘segmentation_5tissues’. The name is important for further process.
For the tutorial, we are going to import a pre-computed segmentation of the MRI using a combination of SPM12 and Freesurfer. To learn more about segmentation, consult the advanced tutorial on segmentation: https://neuroimage.usc.edu/brainstorm/Tutorials#Advanced_tutorials
For this tutorial, we are providing a pre-computed 5-tissue segmentation. To import this pre-computed segmentation,
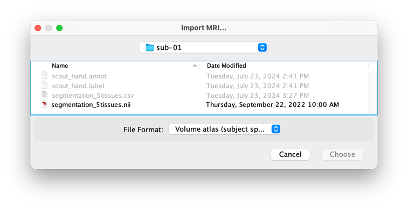
Right-click on the subject node > Import MRI Set the file format: Volume atlas (subject space)
- Select the file nirstorm_tutorial_2024/derivatives/segmentation/sub-01/segmentation_5tissues.nii using Volume atlas (subject space) for the file format
Estimate Volume to a Surface interpolator (Voronoï interpolation)
In this step, your anatomical tab within Brainstorm database should be similar to the following one :
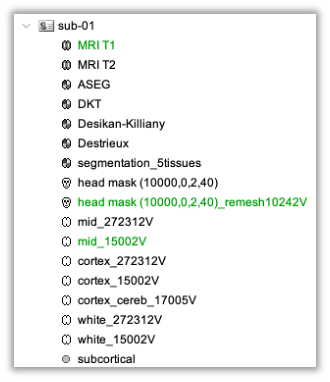
It is important that the correct T1 MRI and surfaces are selected as default. Also, a segmentation named ‘segmentation_5tissues’ should be present in the database (the exact syntax of the name of the segmentation is important).
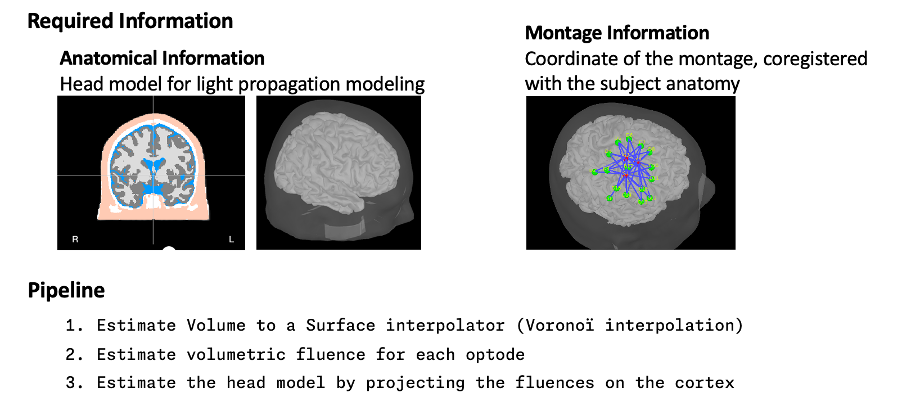
The Voronoi interpolator allows to project volumetric data on the cortical surface. This will be used to project the volumetric fluence data calculated in the MRI volume space along the cortical surface.
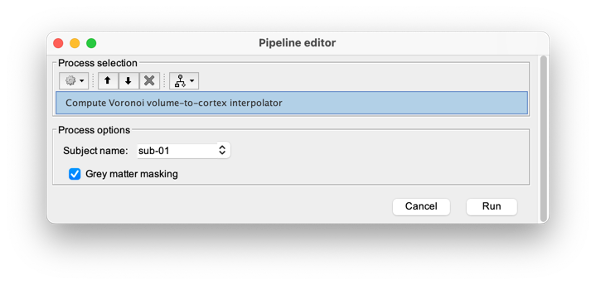
To compute the Voronoi interpolator:
- Click on run, without any file in the process box
Under NIRS > Sources, select Compute Voronoi volume-to-cortex interpolator.
- Then select the subject, and use the Grey matter masking option.
Computation of the fluences
The estimation of the fNIRS forward model is done in two steps:
- The estimation of the fluences for each optode (source or detector) The estimation of the forward model from the fluences.
Fluence data reflecting light propagation from any surface head vertex can be estimated by Monte Carlo simulations of photon transport within a realistic head model, using MCXlab software developed by (Fang and Boas, 20096). To compute the fNIRS forward model, sensitivity values in each voxel for each channel (i.e. a source-detector pair) are then computed by multiplication of fluence rate distributions using the adjoint method according to the Rytov approximation as described in (Boas et al., 20027). Within NIRSTORM, we prepared an interface that can call MCXlab and compute fluences corresponding to a set of vertices along the head surface. See the MCXlab documentation for further details. To allow faster fluence computations, we recommend you to use the GPU implementation of MCXlab. Before launching fluence computations, you need to load the plugin called MCXlab-cl (or MCXlab-cuda if your GPU supports CUDA).
To estimate the fluence, drag and drop the average estimated hemodynamic response to the tapping to the process box and call NIRS > Source > Compute fluences.
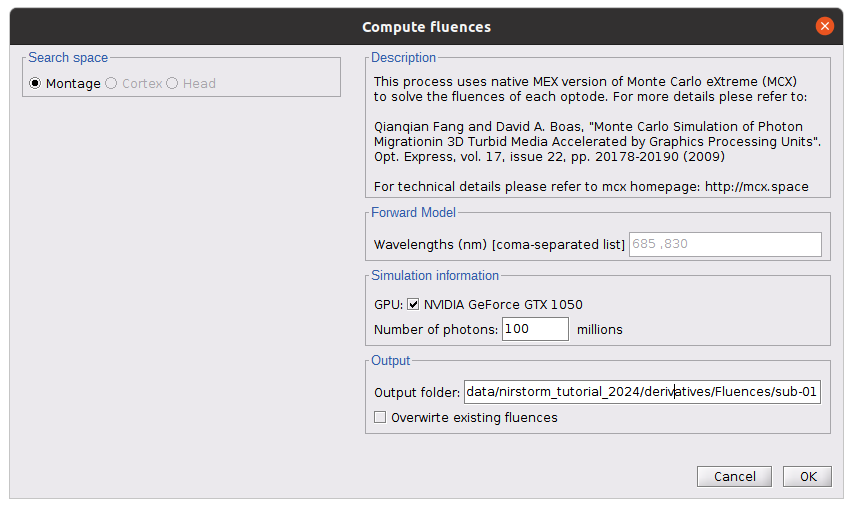
The key parameters to consider are as follows:
- Number of photons: Number of photons used for Monte Carlo simulations. A higher number of photons will improve the quality of the estimation but will require more time. We recommend using at least 10 million photons.
- GPU/CPU: Select the CPU/GPU used for the simulation. You can select multiple.
- Output directory: where the fluence data will be stored.
In our case, select the folder: NIRSTORM-data/derivatives/Fluences/sub-01 …
Computing head model from fluences
Once the fluences are estimated for every fNIRS source or detector in your fNIRS montage, the fNIRS forward model can be computed using NIRS > Source > Compute head model from fluences.
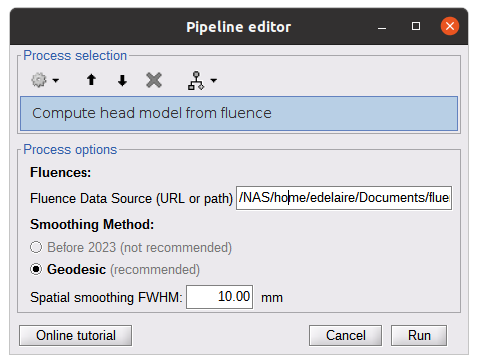
The parameters are:
- Fluence Data source: Path where the fluences are stored (same directory as the previous process). In this tutorial, fluences were pre-computed under NIRSTORM-data/derivatives/Fluences/sub-01
Smoothing method: After the projection of the fluence on the cortex, spatial smoothing is applied. The filter was changed in 2023 (see https://github.com/brainstorm-tools/brainstorm3/pull/645 for more information). We recommend using the new filter: Geodesic.
- Spatial smoothing FWHM: Amount of spatial smoothing to apply. If using geodesic, we recommend using 10 mm. If you are using the filter ‘Before 2023’, use 5 mm.
Investigating the light sensitivity of the montage
To visualize the sensitivity of the selected montage along the cortical surface, use the process NIRS > Source > Extract sensitivity surfaces from the head model:
Drag and drop any file that is present in the same folder as the forward model and use the process NIRS > sources > Extract sensitivity maps from the head model
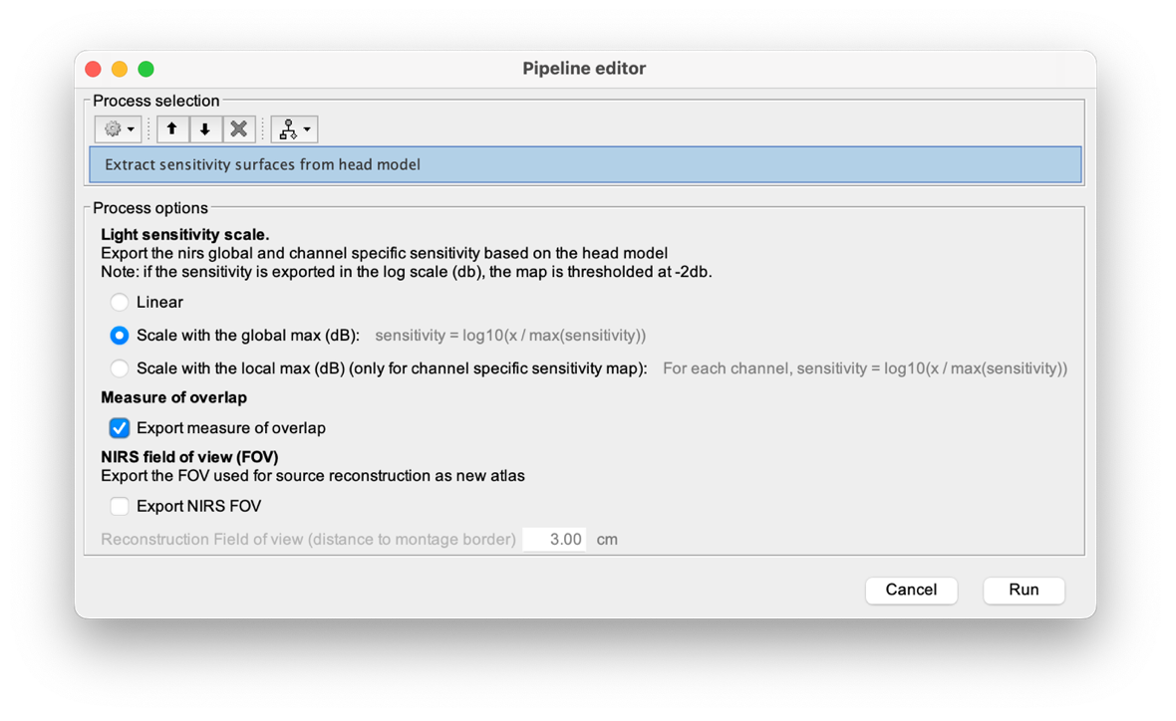
The process will generate the following maps for each wavelength:
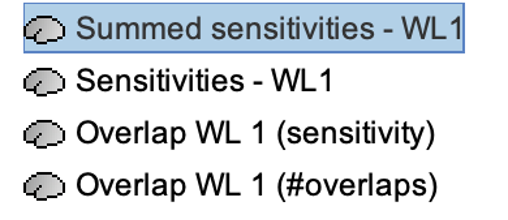
Montage Sensitivity: Sensitivities and Summed sensitivities report the measure of light sensitivity of the montage
Sensitivities: Sensitivity map for each channel, this is a spatiotemporal matrix, to move from one channel to the other one needs to … (to explain) Summed sensitivities: Overall sensitivity map of the whole montage (sum of the sensitivity maps of all the channels)

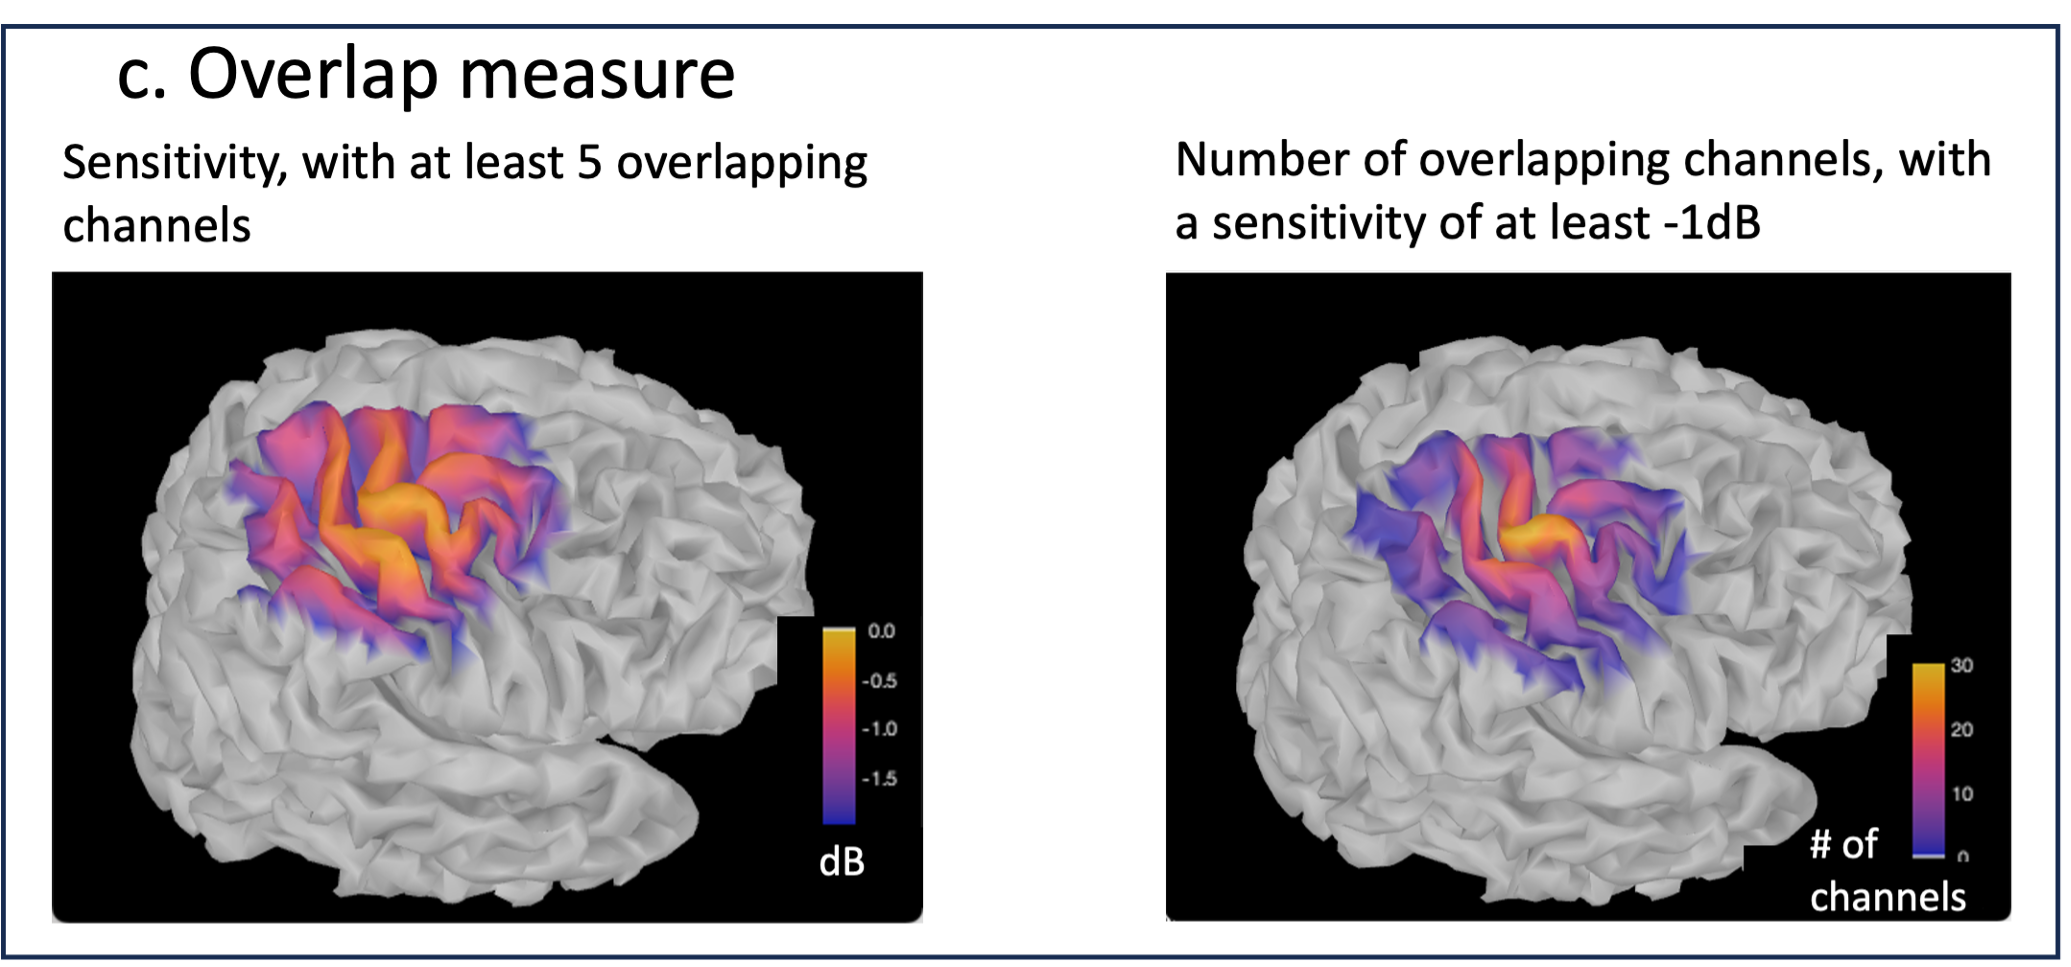
Measure of spatial overlap between fNIRS channels: Overlap (#overlap and sensitivity) reports two measures quantifying the amount of overlapping channels in the montage. To do so, a threshold must first be set, considering either the minimum number of channels sensitive to a specific cortical region or the minimum sensitivity required to receive signals from that region.
Overlap (sensitivity): When setting the threshold to the expected minimum number Nc of channels sensitive to a region, NIRSTORM reports, for each vertex, the minimum light sensitivity (in dB) achieved by the Nc most sensitive channels
Overlap (#overlap): when specifying a threshold on the expected minimum light sensitivity to reach a specific region, the algorithm reports for each vertex how many channels are sensitive to light absorption changes occurring within that specific vertex (above the specified threshold)
fNIRS 3D reconstruction: solving the fNIRS inverse problem
fNIRS 3D Reconstruction consists of solving an anil-posed inverse problem, which involves inverting an advanced model to reconstruct local cortical changes in hemodynamic activity within the brain, from scalp measurements (Arridge, 2011)8. The inverse problem is ill-posed and has an infinite number of solutions. To obtain a unique solution, adding regularization is required. We implemented two algorithms to reconstruct fNIRS data in NIRSTORM:
- the minimum norm estimate (MNE) [see ref 9]
- the maximum entropy over the mean (MEM) [ see ref 1,10].
Inverse problem using MNE
The Minimum Norm Estimate (MNE) is one of the most used reconstruction methods in fNIRS tomography. It consists of minimizing the L2 norm of the reconstruction error with Tikhonov regularization (Boas et al., 2004).
Note that in our MNE implementation, we considered the L-curve method (Hansen, 2000) to tune the regularization hyperparameters in the MNE model.
To apply MNE fNIRS reconstruction, use source > Source reconstruction – wMNE on the file AvgStderr: tapping_02 (19).
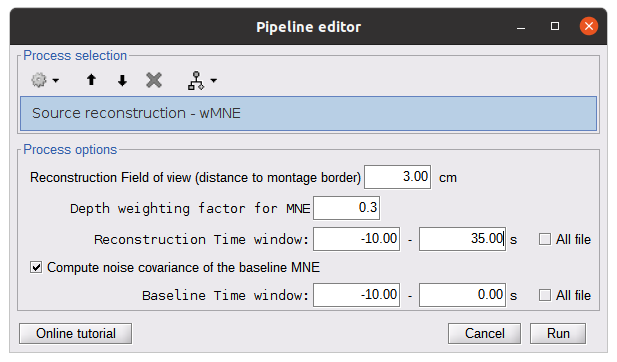
The parameters for this process are as follows:
- Reconstruction field of view: 5 cm. We only reconstruct the activity on the vertex near the montage.
- Depth weighting factor for MNE: 0.3. This takes into account that fNIRS measurements have greater sensitivity in the superficial layer and are used to correct for signal sources that may be deeper.
- Compute noise covariance: If this option is selected, the noise covariance matrix is calculated based on the defined reference window below. The covariance matrix is defined using a diagonal matrix with a specific value per channel. If not specified, the identity matrix will be used to model the noise covariance.
Further details on our implementation of depth-weighted MNE are available in Cai et al Sci. Rep 2022 [10]
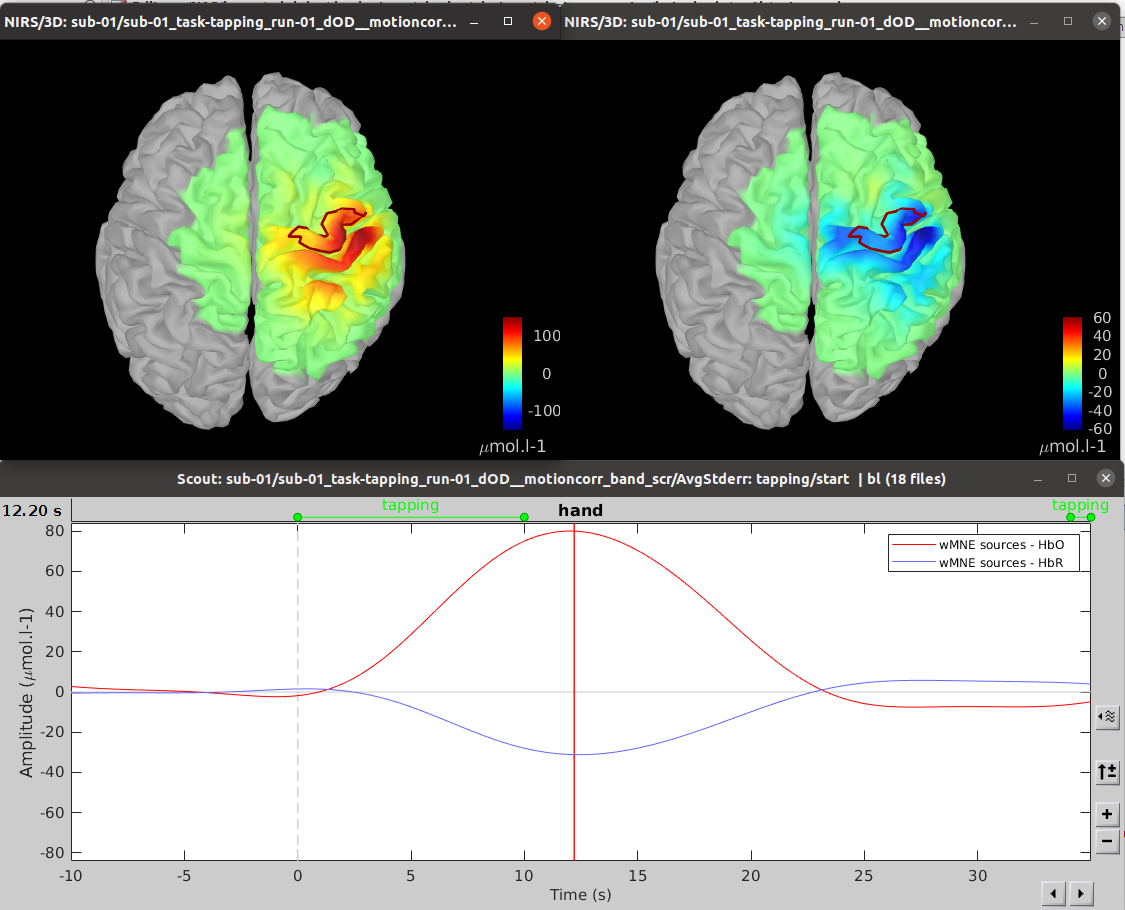
The results of the reconstruction will be listed under "AvgStd FingerTapping (19)".
Expand "AvgStd FingerTapping (19)" to view the MNE reconstruction results.
Double-click on the files "MNE sources - HbO" and "MNE sources - HbR" to review the reconstructed maps. To display the reconstructed time courses of HbO/HbR along the cortical surface, define a region for extracting these time courses.
To do so, switch to the "scout" tab in the view control panel. Click on the scout named "Hand". (explain how this one was defined and mention that one can define their own scout as well) In the "time-series options" section at the bottom, select "Values: Relative".
Inverse problem using cMEM
The MEM framework was first proposed by (Amblard et al., 2004)13, then applied and evaluated in the context of electroencephalography (EEG) and magnetoencephalography (MEG) source imaging (Grova et al., 200614; 15 et al., 2013). To see how it was adapted for fNIRS, consult [1,10].
Please refer to the tutorial Maximum Entropy on the Mean (MEM): https://neuroimage.usc.edu/brainstorm/Tutorials/TutBEst for more details on MEM.
MEM framework was specifically designed and evaluated for its ability to localize the underlying generators of EEG/MEG data along the cortical surface while featuring the unique property of recovering accurately the spatial extent of the underlying generators [16–21]
To use MEM, use NIRS > Source > Compute sources: Best. on the file AvgStderr: tapping_02 (19).
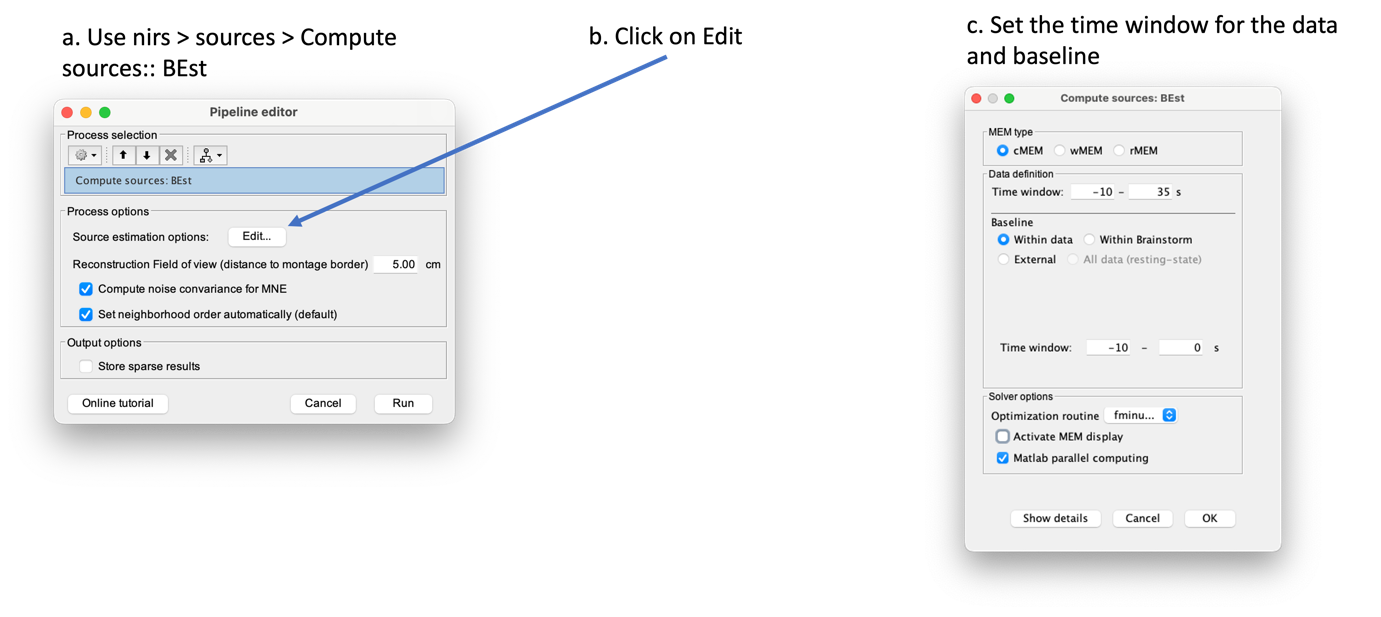
Here you should use the following options:
- MEM type: cMEM
- Data definition:
- Time windows: -10 – 35 s
- Baseline:
- Within data: we will be extracting the baseline from the data
- Time window: -10 - 0 s
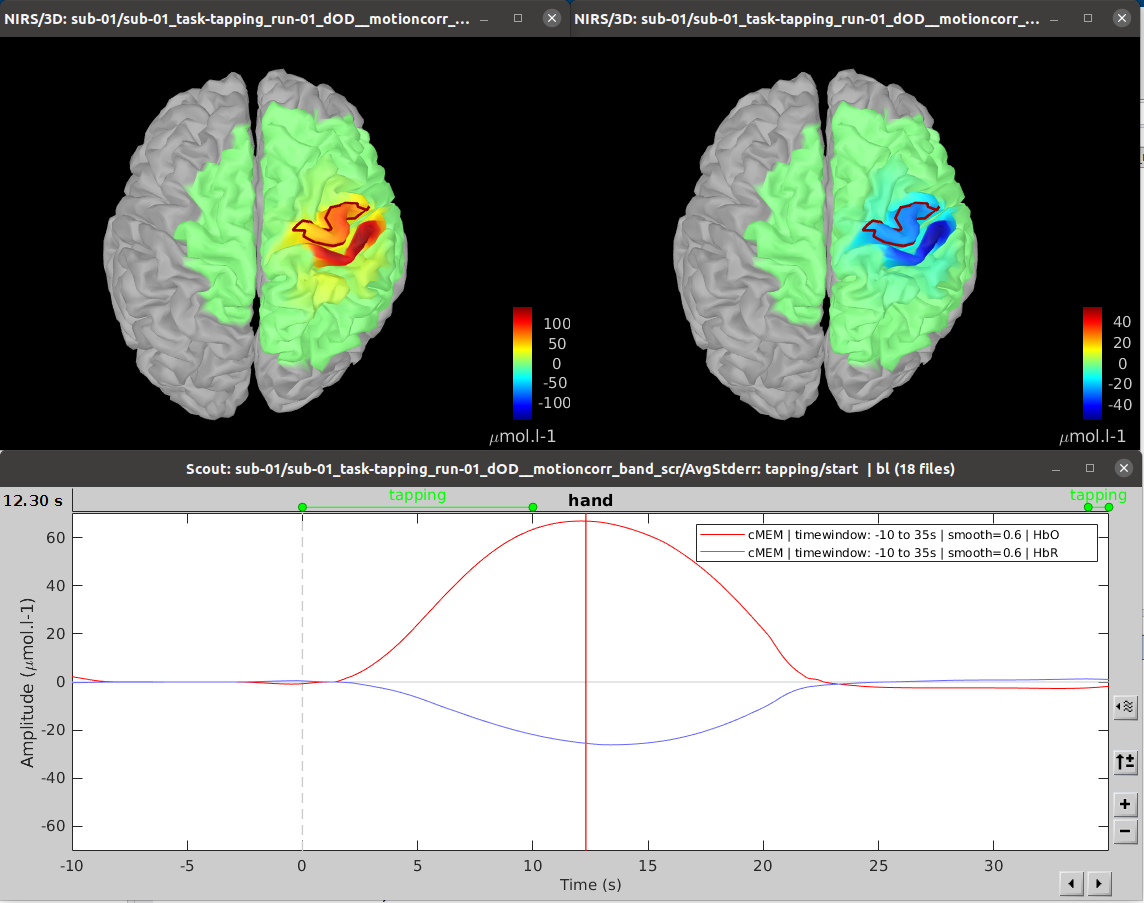
Similarly, to MNE, you can After applying MEM 3D reconstruction, we obtain the following result:
References
1. Cai Z, Uji M, Aydin Ü, et al. Evaluation of a personalized functional near infra-red optical tomography workflow using maximum entropy on the mean. Hum Brain Mapp. 2021;42(15):4823-4843. doi:10.1002/hbm.25566
2. Scholkmann F, Spichtig S, Muehlemann T, Wolf M. How to detect and reduce movement artifacts in near-infrared imaging using moving standard deviation and spline interpolation. Physiol Meas. 2010;31(5):649-662. doi:10.1088/0967-3334/31/5/004
3. Fishburn FA, Ludlum RS, Vaidya CJ, Medvedev A V. Temporal Derivative Distribution Repair (TDDR): A motion correction method for fNIRS. Neuroimage. 2019;184(September 2018):171-179. doi:10.1016/j.neuroimage.2018.09.025
4. Delaire É, Vincent T, Cai Z, et al. NIRSTORM: a Brainstorm extension dedicated to functional Near Infrared Spectroscopy (fNIRS) data analysis, advanced 3D reconstructions, and optimal probe design. bioRxiv. Published online 2024. doi:10.1101/2024.09.05.611463
5. Scholkmann F, Wolf M. General equation for the differential pathlength factor of the frontal human head depending on wavelength and age. J Biomed Opt. 2013;18(10):105004. doi:10.1117/1.jbo.18.10.105004
6. Fang Q, Boas DA. Monte Carlo Simulation of Photon Migration in 3D Turbid Media Accelerated by Graphics Processing Units. Opt Express. 2009;17(22):20178. doi:10.1364/oe.17.020178
7. Boas DA, Culver JP, Stott JJ, Dunn AK. Three dimensional Monte Carlo code for photon migration through complex heterogeneous media including the adult human head. Opt Express. 2002;10(3). doi:10.1364/oe.10.000159
8. Arridge SR. Optical tomography in medical imaging. Inverse Probl. 1999;15(2). doi:10.1088/0266-5611/15/2/02 9. Lin FH, Witzel T, Ahlfors SP, Stufflebeam SM, Belliveau JW, Hämäläinen MS. Assessing and improving the spatial accuracy in MEG source localization by depth-weighted minimum-norm estimates. Neuroimage. 2006;31(1):160-171. doi:10.1016/j.neuroimage.2005.11.054 10. Cai Z, Machado A, Chowdhury RA, et al. Diffuse optical reconstructions of functional near infrared spectroscopy data using maximum entropy on the mean. Sci Rep. 2022;12(1):1-18. doi:10.1038/s41598-022-06082-1
11. Boas DA, Dale AM, Franceschini MA. Diffuse optical imaging of brain activation: Approaches to optimizing image sensitivity, resolution, and accuracy. Neuroimage. 2004;23(SUPPL. 1). doi:10.1016/j.neuroimage.2004.07.011
12. Hansen PC. The L-Curve and its Use in the Numerical Treatment of Inverse Problems. In: In Computational Inverse Problems in Electrocardiology, Ed. P. Johnston, Advances in Computational Bioengineering. WIT Press; 2000:119-142.
13. Amblard C, Lapalme E, Lina JM. Biomagnetic Source Detection by Maximum Entropy and Graphical Models. IEEE Trans Biomed Eng. 2004;51(3):427-442. doi:10.1109/TBME.2003.820999
14. Grova C, Daunizeau J, Lina JM, Bénar CG, Benali H, Gotman J. Evaluation of EEG localization methods using realistic simulations of interictal spikes. Neuroimage. 2006;29(3).doi:10.1016/j.neuroimage.2005.08.053
15. Chowdhury RA, Lina JM, Kobayashi E, Grova C. MEG Source Localization of Spatially Extended Generators of Epileptic Activity: Comparing Entropic and Hierarchical Bayesian Approaches. PLoS One. 2013;8(2). doi:10.1371/journal.pone.0055969
16. Chowdhury RA, Merlet I, Birot G, et al. Complex patterns of spatially extended generators of epileptic activity: Comparison of source localization methods cMEM and 4-ExSo-MUSIC on high resolution EEG and MEG data. Neuroimage. 2016;143:175-195. doi:10.1016/j.neuroimage.2016.08.044
17. Heers M, Hedrich T, An D, et al. Spatial correlation of hemodynamic changes related to interictal epileptic discharges with electric and magnetic source imaging. Hum Brain Mapp. 2014;35(9):4396-4414. doi:10.1002/hbm.22482
18. Grova C, Aiguabella M, Zelmann R, Lina JM, Hall JA, Kobayashi E. Intracranial EEG potentials estimated from MEG sources: A new approach to correlate MEG and iEEG data in epilepsy. Hum Brain Mapp. 2016;37(5). doi:10.1002/hbm.23127
19. Abdallah C, Hedrich T, Koupparis A, et al. Clinical Yield of Electromagnetic Source Imaging and Hemodynamic Responses in Epilepsy: Validation With Intracerebral Data. Neurology. Published online 2022.
20. Pellegrino G, Hedrich T, Chowdhury RA, et al. Clinical yield of magnetoencephalography distributed source imaging in epilepsy: A comparison with equivalent current dipole method. Hum Brain Mapp. 2018;39(1). doi:10.1002/hbm.23837
21. Pellegrino G, Hedrich T, Porras-Bettancourt M, et al. Accuracy and spatial properties of distributed magnetic source imaging techniques in the investigation of focal epilepsy patients. Hum Brain Mapp. 2020;41(11):3019-3033. doi:10.1002/hbm.24994
