When opening a paired t-test, I found that some graphs will change if I reopen a file that has been opened.
For some graphs, I open them and change the frequency band from delta to beta. I recorded the graph. Then I click on the same t-test file. I would find the graph changed even though I didn't change anything. For the same file, every time I do so, I will get the same changed file.
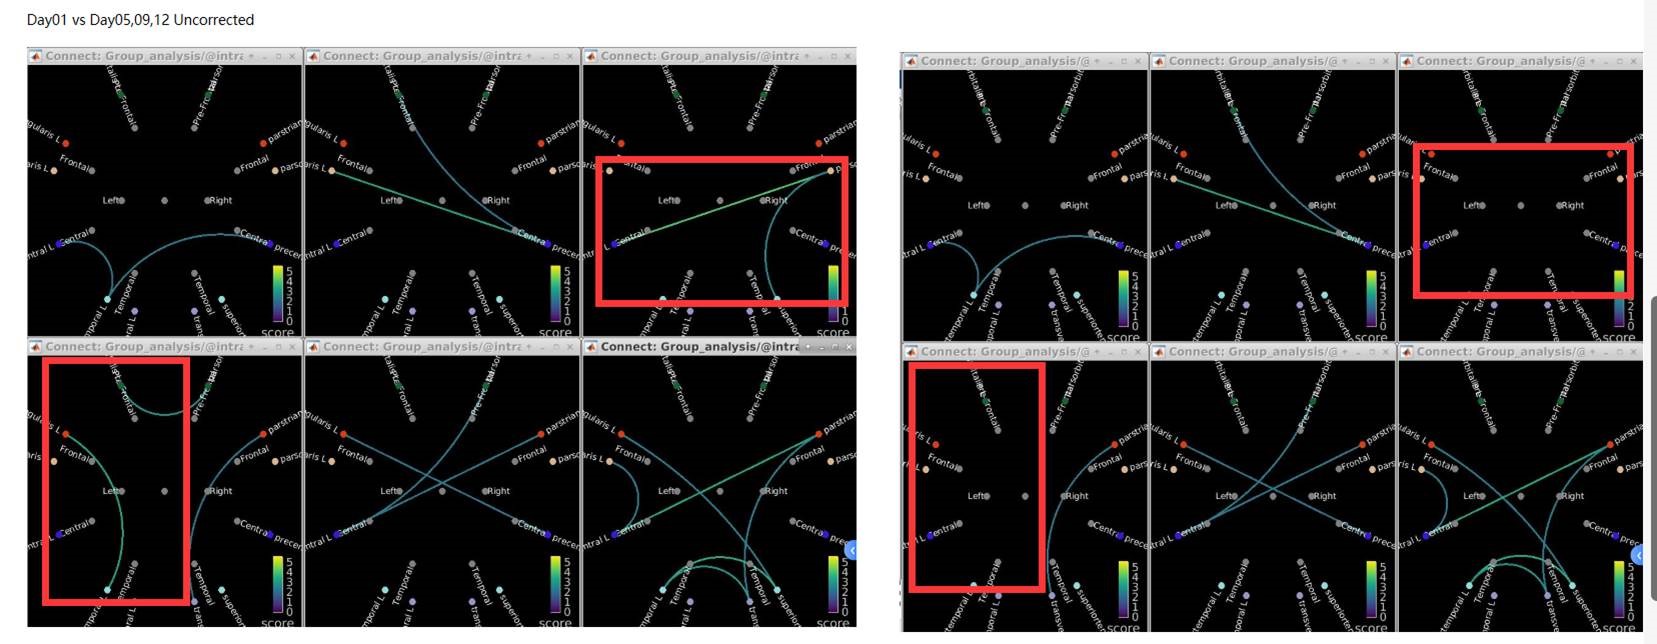
Just like in the picture below. The six pictures on the left should be the same as the pictures on the right. But when I reopen them, some files changed.
I don't know which one is the right result I want.
Could you please help me with this issue?
regards,
Yining