Plotting selected dipoles

Hello,

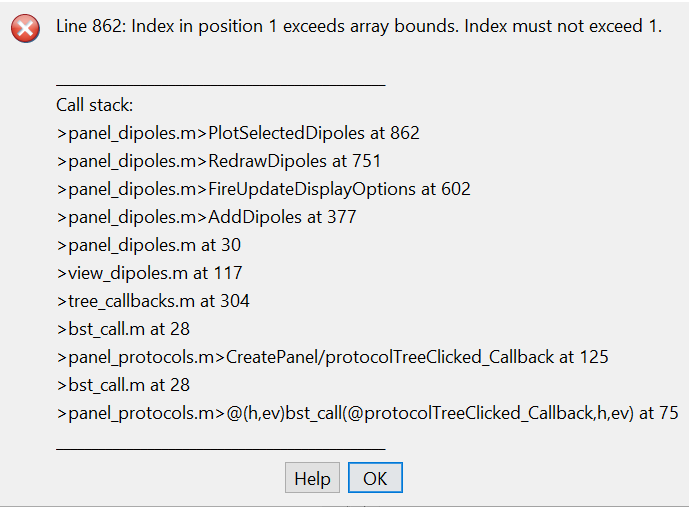
I have been trying to create a struct of dipoles with a goodness of fit above 50. I export to MATLAB the dipoles in brainstorm and run my code on it and then, when I import the struct in brainstorm and double click on it to display it, I get the following error:

This does not happen when I filter the dipoles using other values for goodness of fit. Do you have any idea about what I am missing here?
P.S: 10 dipoles remain after filtering for GOF>50%.

Thank you,
Saeed

I can't reproduce this error on my end.
Can you please share your edit dipole file?

  • Right-click on it in the database explorer > Show in file explorer
  • Zip the dipole_...mat file
  • Drag and drop the zip file in the edit box on this forum to upload it directly here

Thanks

Thank you for the response @Francois,

Here is the dipole zip file:
dipoles_220624_1217.zip (3.6 KB)

In the file that I attached, the original values in "Time" column ((dipoles.Dipole.Time) and (dipoles.Time)) are modified to the values that I calculated when I processed the original dipoles.

Best,
Saeed

Thank you for the file.
I fixed this display bug: Bugfix: Display of dipoles with time=[0,1] · brainstorm-tools/brainstorm3@1cca804 · GitHub

Please update Brainstorm and try again.

1 Like

Thank you for the new update Francois. I checked it and it works fine now.

Saeed