Hello M. Tadel,
I was wondering if there is a scaling factor applied to the power values when we do an “export to Matlab” on a FFT ?
Because when I open this FFT in Matlab I only see negative values (mean around -130).
And in Brainstorm, when I display the figure of my FFT in power mode and in log(power) mode, the two vary in opposite directions, like if the log function was decreasing and I do not understand why.
Thank you very much for your help,
E. Gronlier
Hello,
If you right-click on the file in the database explorer > File > Export to Matlab, it would export the values saved in the file to your Matlab base workspace (probably power values).
If you double-click on the file to display it, then right-click on figure > File > Export to Matlab, it would export the values that are displayed in the figure (by default log(power)).
The first approach is recommended, as it does not depend on any additional post-processing or display functions.
Francois
Thank you very much for your response,
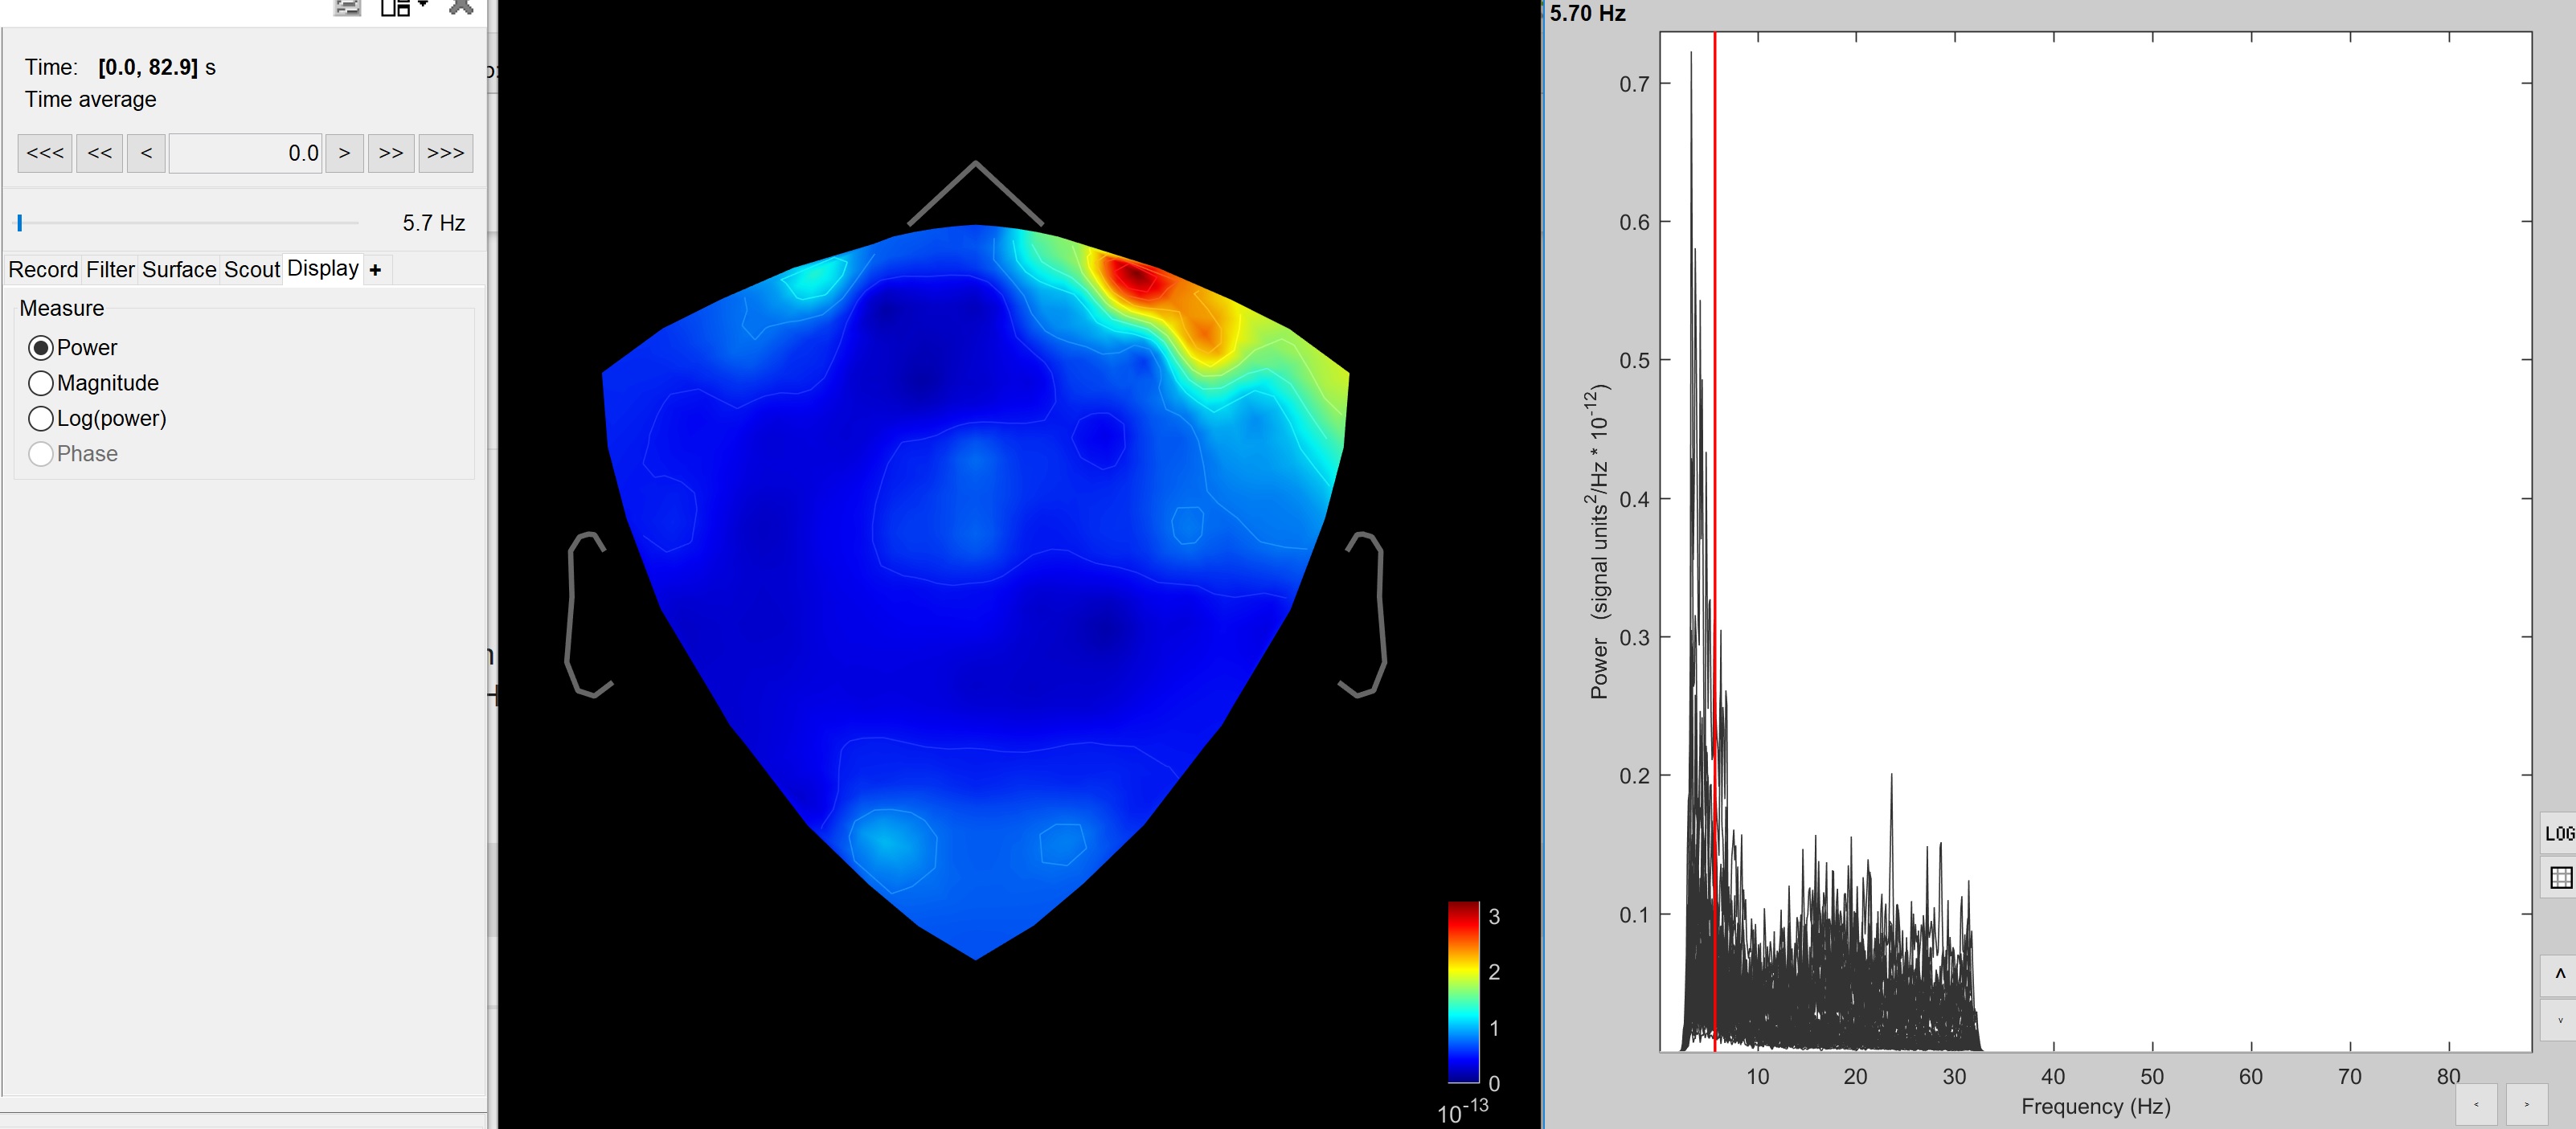
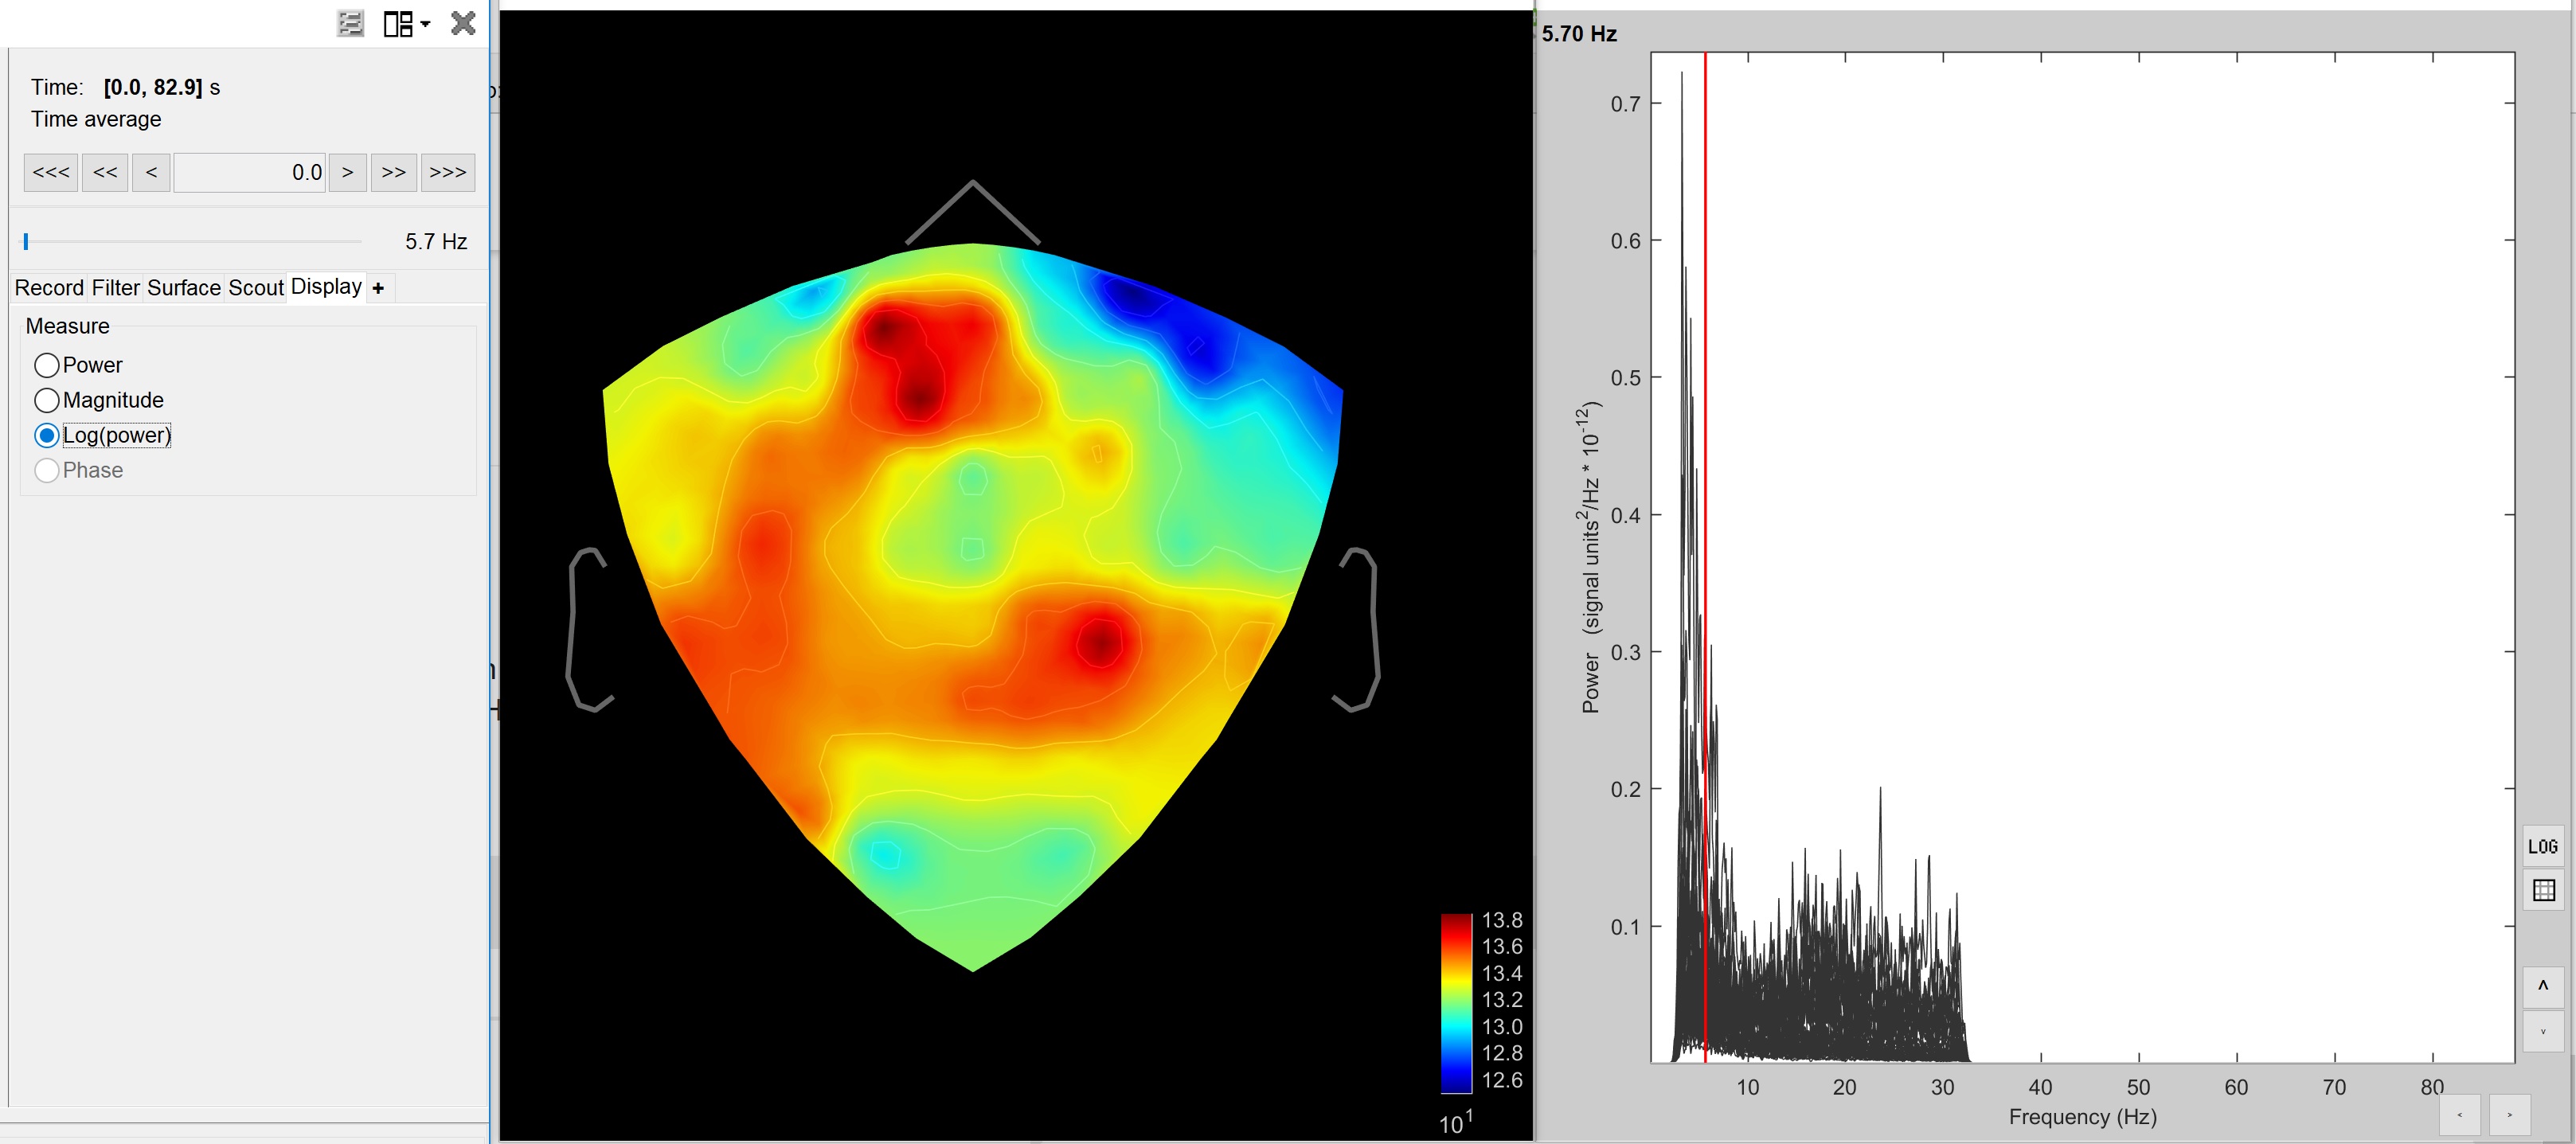
However, the trouble comes first from the observation than when we look at the 2D scalp views of the FFT results, the power and the log(power) are inversely proportional.
It seems that when we select the log(power) icon, the figure displayed look as if it is -log(power).
Also, we exported in Matlab the values of the power of those FFT and the exported data were always negative
but not corresponding to the log in the brainstorm viewing window (colorbar scale, maybe -log(power) ?),
the topos are however very nice, but we would like to know the scaling added when exporting FFT results in Matlab.
Moreover, we tried to do group analysis on our sources results, but it appears that to project on a default anatomy, Freesurfer is necessary but our anatomy files were imported from BrainVisa (we encountered some troubles with Freesurfer on Windows).
We tried to project anyway as indicated in one tutorial, however it then wants an MNI registration which requires Freesurfer too…
We are still trying to find a way to solve both those issues but in case you have some inputs on those Brainstorm problems it would be extremely valuable for us,
Thank you so much again,
Cheers,
E. Gronlier
It seems that when we select the log(power) icon, the figure displayed look as if it is -log(power).
The values of log(power) are negative, because the power values are very low (around 10^-30 in MEG, 10^-12 in EEG).
=> log10(10^-30) = -30
By default, the colormap that is used shows the absolute values.
To change this behavior, right-click on the figure > Colormap > Uncheck the option "Absolute".
This will allow to see the real values.
Moreover, we tried to do group analysis on our sources results, but it appears that to project on a default anatomy, Freesurfer is necessary but our anatomy files were imported from BrainVisa
I re-enabled the old procedure when the accurate registration information is not available.
You can update Brainstorm and it will bypass the forced crash after displaying the message "you should use FreeSurfer or BrainSuite".
Please do not assume this works correctly. Observe the distance between the two surfaces (grey and red), if they are not very well aligned, the interpolation from one to the other will be terrible.
We really do recommend you use BrainSuite or FreeSurfer for processing the anatomy of your subjects in the context of group analysis (BrainSuite works well on Windows), because they can register the individual surfaces on the atlas surfaces, while BrainVISA doesn't do it (well, it can, but doesn't make it available for at the end of the regular T1 segmentation pipeline - you can ask the BrainVISA developers to work on this if you think this would be useful)
Francois
Thank you again for your prompt answer !
We will try to do this way and will let you know if we encounter some other problem.
Thank you veru much,
E. Gronlier
Hi Francois,
I have a question concerning your statement:
The values of log(power) are negative, because the power values are very low (around 10^-30 in MEG, 10^-12 in EEG).
The unit of measure for the power when exported from Brainstorm is Volt^2/HZ or instead power is stored in microVolt^2/Hz?
Thank you very much for your help,
Antonio
1 Like
Hi Antonio,
In Brainstorm, all the values are saved in international units.
Power values would be saved in Volt^2/HZ.
Francois
Hi all
I have a question about power and log power difference.
when I select the log power mode in display tab my activated regions of brain change.
When and why should we use log power mode?
which one of power and log power are real activated regions in 2D sensor cap?
Best Regards,
Hamed
Hi Hamed,
If you look closely you’ll see that these two displays are actually the same but inverted: when the power is high, the log(power) is low and vice versa. This is probably due to your colormap being in absolute value. The range of values for the power are in the small range of 10e-13. This means the log(power) will be negative, but the highest value of the power will still be the highest value of the log(power). This is inverted if you do the absolute value on the log(power) since they are negative values. If you right click the topography and uncheck Colormap -> Absolute values, you’ll see the exact same trends between the two graphs.
I strongly suggest you go through our extensive tutorial where you’ll find useful information such as:
Cheers,
Martin
Hi Martin
Thanks a lot for your reply
I’m reading the tutorial these days.
Cheers,
Hamed
Hi,
I have a some difficulties when trying to export the fft values to a file. The numbers are not the same as the FFT tables processed with, for example EEG Studio (From Mitsar), using the same FFT options (50% overlap, 1 Hz resolution, 1 second of window length) and the same filtering options (1-32 Hz). I think I’ve uploaded an EDF file so that you can compare with my results.
When I compute the FFT through the Process1 Window I obtain a FFT file for the 10 first seconds of the EDF file. Then I compute the frequency band command (FFT band frequencies delta: 1-4; theta 4-7; alpha 7-14; beta 15-32 Hz). Then I use the export to file feature with right mouse clic. When i export to csv file the numbers do not match between Brainstorm and EEGStudio. For example: Cz in delta band (2.03+07 units with Brainstorm VS 0.2 mV2 for EEGStudio). Its a unit issue? Why the results are so different? What am i doing wrong? Am I exporting the graph representation values instead of the energy values?
I’m using Brainstorm (sept 17 version) with the Matlab Runtime 2015b.
Thank you so much.
Then I compute the frequency band command
You could do this as part of the computation of the PSD, you don't have to run it separately.
Cz in delta band (2.03+07 units with Brainstorm VS 0.2 mV2 for EEGStudio). Its a unit issue?
Brainstorm stores everything in international units, so Volts instead of milliVolts.
2.03+07 = 20.03*10^6 V^2/Hz = 20.03 mV^2/Hz.
So no, it looks like it is not only a unit issue.
But there are so many different parameters in the evaluation of a signal's frequency spectrum, and filters can be implemented in so many different ways, it is very unlikely that you would get the exact same values between various programs.
Rather than focusing on isolated values, I'd recommend you look at the overall shape of the full spectrum over long signals (more than 10s).