I have a question about plotting average PSD with standard deviation (SD).
I computed intra-subject average PSD and standard deviation using Average>Average files>Arithmetic average + Standard deviation. Output(.mat) file has the average and SD. When I open it it plots only average.
Then, I tried to export average and SD to plot outside of BS, but 'Export to file' only exports the average. Is there a way to export AVG and SD?
I use BS 05-Jul-2016 with MRC2015b. This may be a reason why access to the output is a bit difficult for me. I would appreciate your advise.
The display of the standard deviation is currently only supported for the averaged recordings.
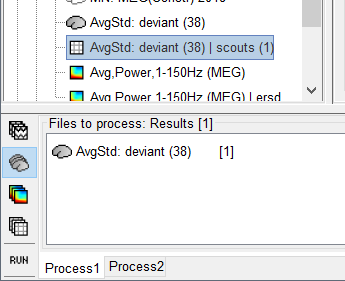
If you don’t have Matlab, accessing additional fields (like the field .Std) is going to be difficult. But what you can do is running twice the process “Average files”, once with the option “Arithmetic average” and once with “Standard deviation”.
> But what you can do is running twice the process “Average files”, once with the option “Arithmetic average” and once with “Standard deviation”.
Ah, yes. Of course. Sure. I will do so. Thanks!
I do not use Matlab, but Python. I’m wondering if you plan to develop an interface with Python. For example, it would be very nice if I can export these .mat files as python-compatible files.
You comment made me think that the reverse should be possible. Sure enough, I found Python interfaces with Matlab file (Yes, of course, but I did not think about it…). For example, SciPy has loadmat.
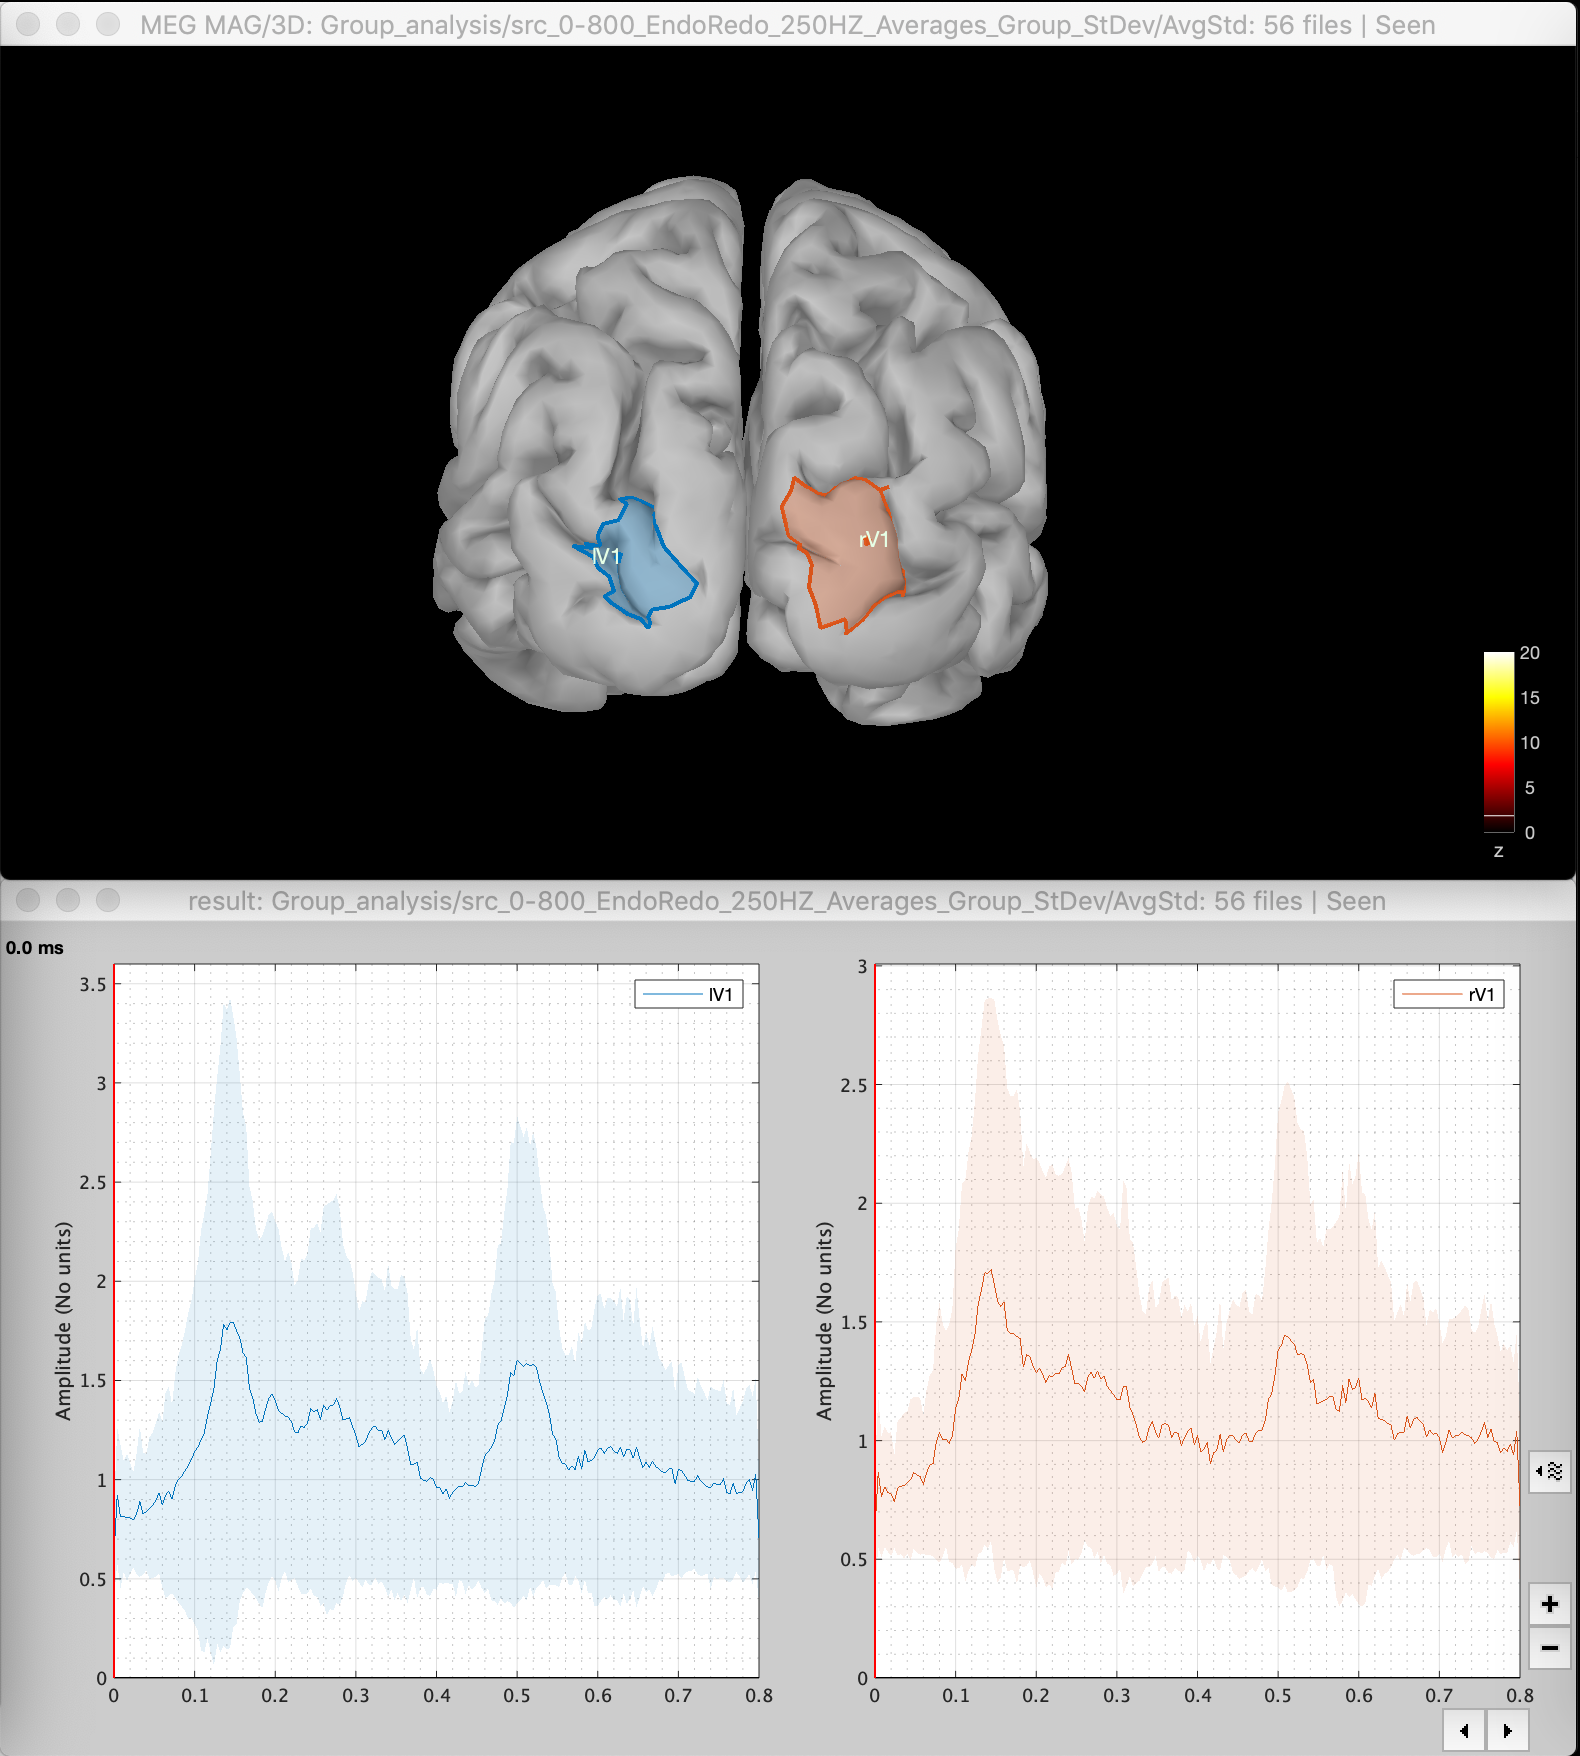
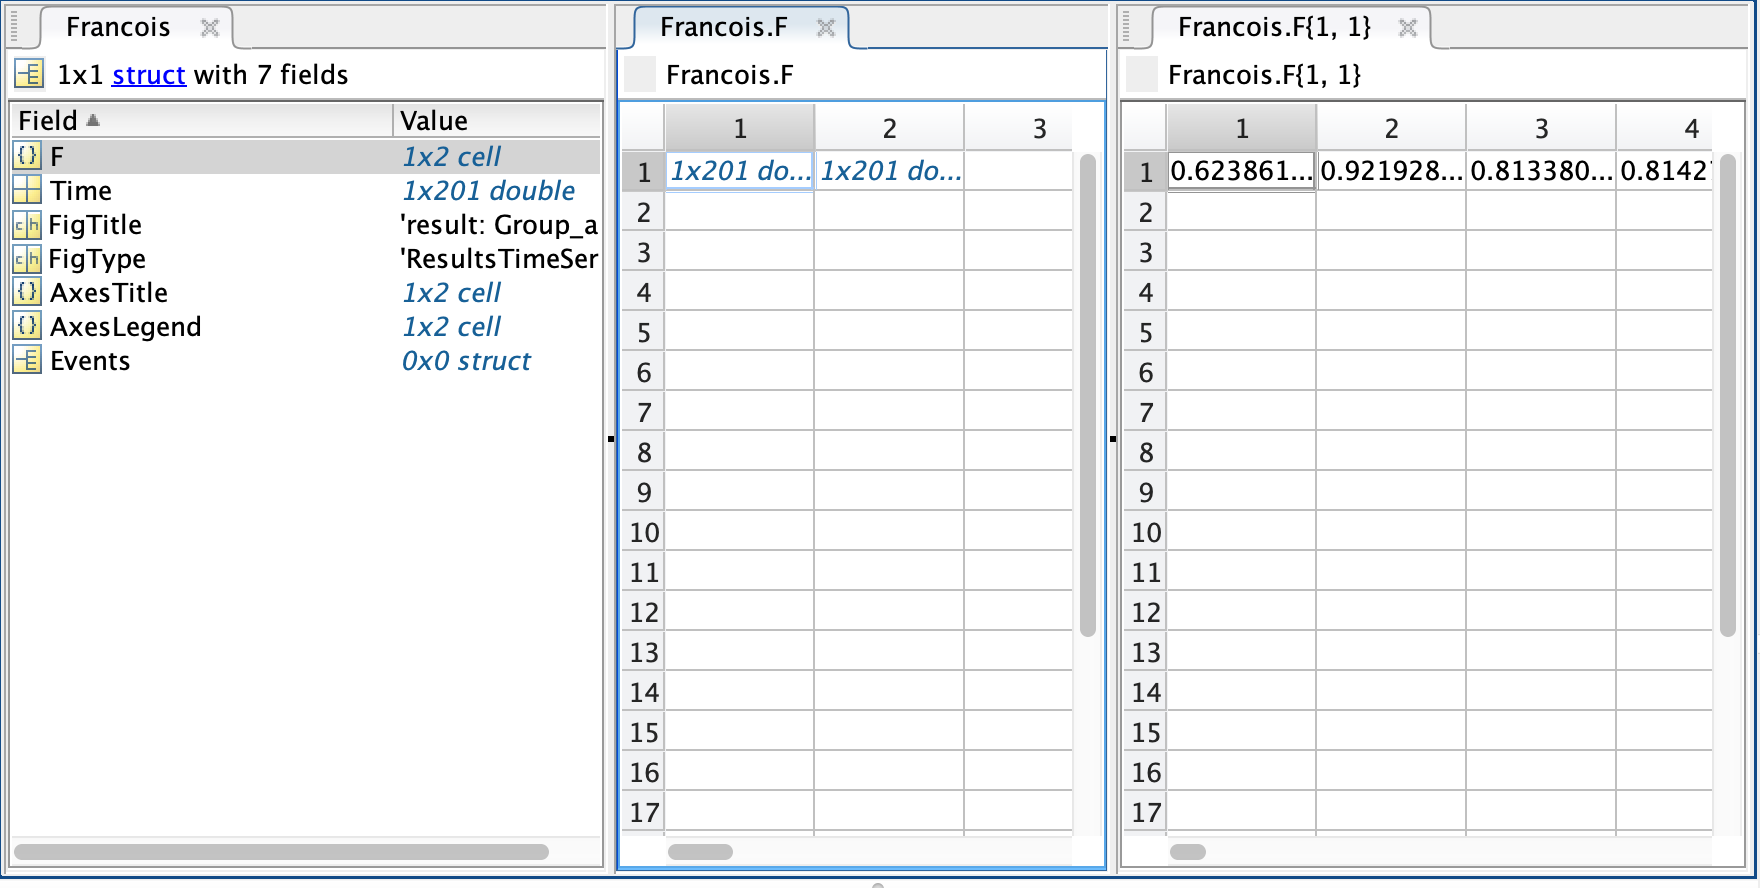
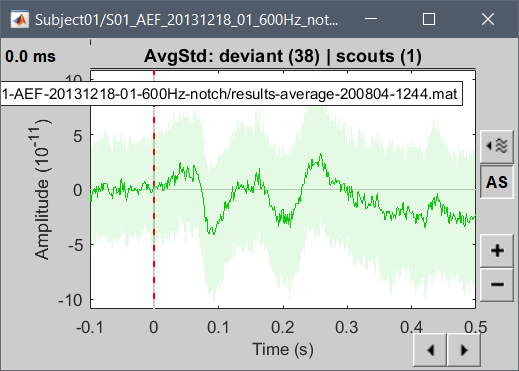
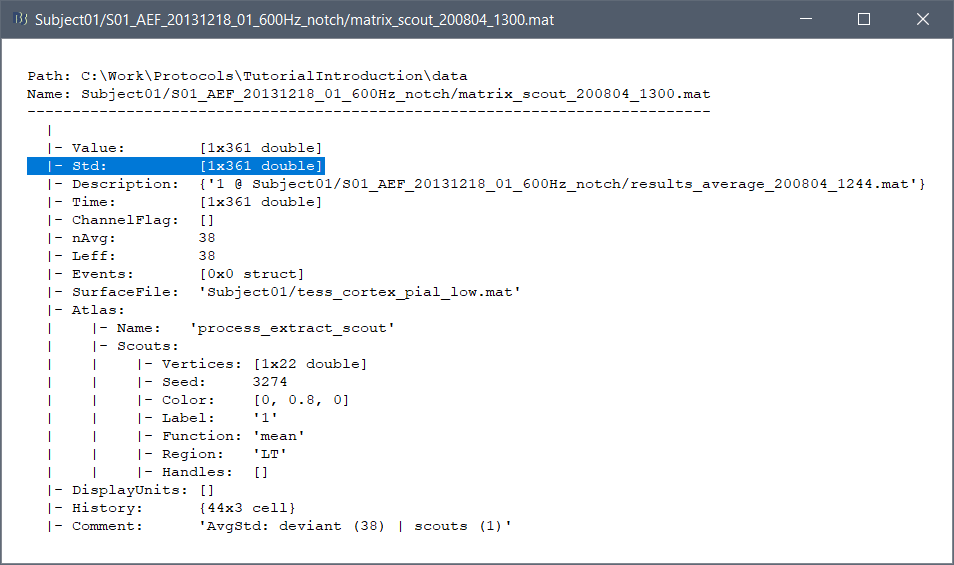
I was trying to do exactly the same of exporting my scouts Mean and StDev signals (something that within brainstorm worked perfectly well) (see image).
Looks like when I Snapshot--> Export to Matlab and save it as a variable in the workspace (here called Francois), I still get only one value per scout. Any way to extract together Avg and Stdev (or the way is to computer separately Avg and Stdev in two files?)
@SpagnaPhd I'm sorry for this awfully long time it took me to respond to this message. For some reason it got stuck in a list of things "to do later"...
Looks like when I Snapshot--> Export to Matlab and save it as a variable in the workspace (here called Francois), I still get only one value per scout
Indeed, the popup menu "Snapshot > Export to Matlab" has limited capabilities. It reconstructs signals from the graphical objects, and does not work for the Std halo displayed around the signals.
For a proper export of the scouts signals, use the process "Extract > Scout time series" instead. It would also include the Std values, which would be directly available from the new "matrix" file created in the database.
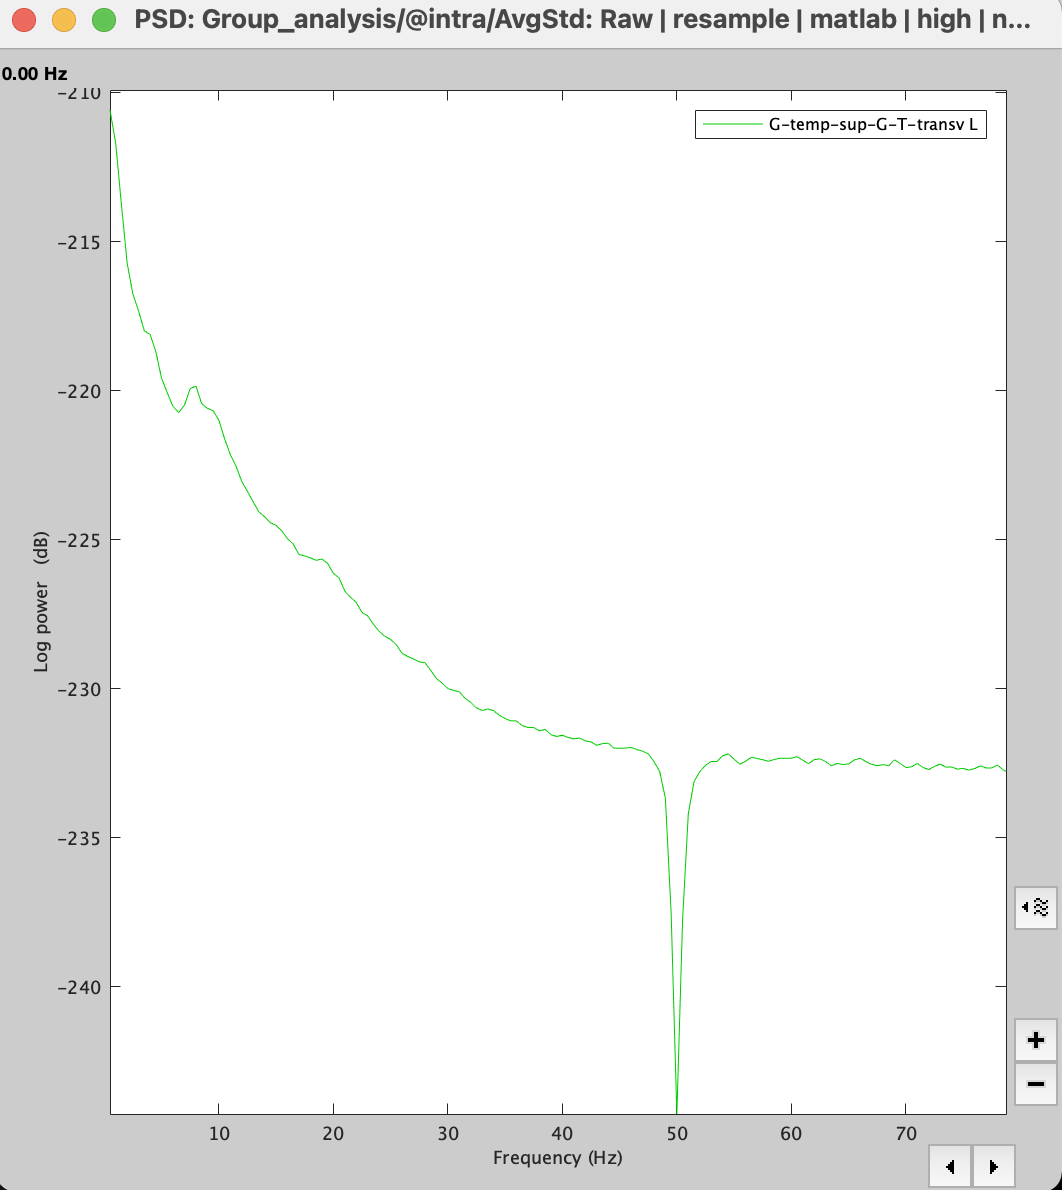
You mentioned that we can visualise standard deviation only in the averaged PSD map. I averaged all PSD maps across all participants (Arithmetic average + Standard Deviation) but it shows me only average without sd (see attached).
Can you tell me please have to I do something else to have average 'line' + sd on the map?
Actually, I wrote exactly the opposite: The display of the standard deviation is currently only supported for the averaged recordings.
The display of the Std is still not supported for PSD, and it is not in our immediate plans to integrate it.
If you really need to do it, you can read the .mat files and write your own scripts to display the Std.