Dear Sir,
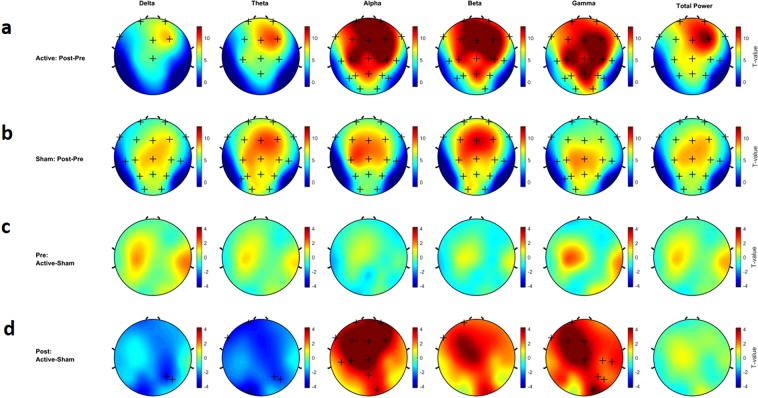
On a study, I found these plots, which were produced by Fieldtrip .
Can we have these kinds of plots with permutation test on Brainstorm. In these plots, the electrodes that have significant differences between conditions are marked.
Best regards
You can run non-parametric tests from Brainstorm, including the FieldTrip cluster-based approach:
https://neuroimage.usc.edu/brainstorm/Tutorials/Statistics#Example_3:_Cluster-based_correction
For comparing PSDs, which method in Brainstorm do you suggest?
Is there any pipeline or Topic about this issue (comparing PSD values in brainstorm)?
Non-parameteric statistics are applicable to all the types of data.
Search the literature for understanding what are the most common approaches in your field (the closer you stay to your reference literature, the easier the pipeline comparisons).
In the Workflows tutorial, all the suggestions for time-frequency maps work for PSD:
https://neuroimage.usc.edu/brainstorm/Tutorials/Workflows#Time-frequency_maps
1 Like
Hello. Can we visualize this for specific time ranges. For example, I want to show such a change in between 100-150 ms.
Thank you dear Francois for your reply,
How can we report the method and results of using Non-parametric test or Fieldtrip cluster-based approach in our study paper ?
These are power spectra plots estimated on longer recordings, there is no time dimension anymore. If you need to keep some time resolution, then go for time-frequency analysis instead:
https://neuroimage.usc.edu/brainstorm/Tutorials/TimeFrequency
Look for how statistics are reported in your reference literature.
1 Like