Hi everyone,
I’d like to ask whether there is any quantitative way to perform a quality check of MEG preprocessing, to make sure that noise has been effectively removed without accidentally removing useful neural components.
Is it possible to use FOOOF (specparam) in Brainstorm for this purpose? If so, which FOOOF parameters should be extracted, and within what ranges would they indicate that the signals are not too noisy?
Alternatively, if a fully quantitative QC is not possible, what should I look at for a qualitative quality check of the preprocessing?
Great question … and you’re absolutely not alone, everyone wishes there were a single “QC number” that tells us the preprocessing is perfect . There is, unfortunately, no single quantitative metric that guarantees “noise removed but neural signal preserved.”
The best approach is to combine a few simple quantitative checks with quick visual inspection.
PSD before/after: line noise and high-frequency noise should drop; spectra between subjects should look more similar.
Time series: blinks/muscle bursts should be reduced.
Topographies/ERFs: expected responses should become clearer, not weaker.
If task-based, the SNR of known components (visual/auditory) should improve.
You can use FOOOF parameters for QC (such as 1/f, peak properties, etc.) and compare the raw versus the cleaned data [eg: the slope should become slightly smoother]. Check that physiological peaks (e.g., alpha) remain.
FOOOF can help, but treat it as one QC tool among several.
thank you very much for the suggestion, it was very helpful. I am trying to use FOOOF/SpecParam as a QC tool, but I have a few doubts:
In the official tutorial FOOOF is shown, I see SpecParam. Are they fully equivalent?
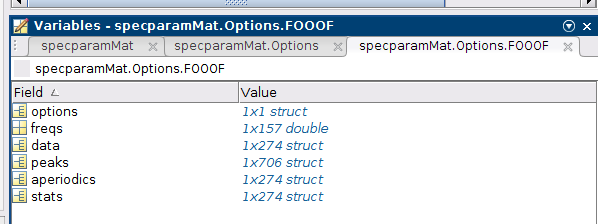
When I export the results to MATLAB, I cannot find the data organized as shown in the tutorial. I only obtain a struct with one field called “TF”, which is a double 148×11×1201, while the other fields are empty.
I would like to analyze all the canonical frequency bands in resting state, so for now I only applied a notch filter and a high-pass filter. However, when I compute SpecParam, using a frequency range of 0.3–200 Hz gives very different results compared to 0.3–100 Hz. In both cases aperiodic mode: fixed and max number of peaks.
Thanks again for the suggestion and for your help!
FOOOF is almost never applied to the whole spectrum. It relies on the assumption that the PSD has a constant slope in the log-log space. This is not true if the PSD contains slow frequencies
Frequencies (< 1Hz) as these often have higher power (than expected) as they are contaminated by slow drifts. For the higher frequency limit, in your case it includes the power-line noise (either the noise spike or the trough introduced by the notch filter). This is the reason you see the result you obtain. Moreover, the fits are different, as they include different PSD data.
A common range in the literature is [1-40Hz] for EEG and MEG.
You could plot your PSD in log-log to check the range where the slope is constant.
Yes, I am exporting the results file, but the structure is not the one described in the tutorial, so I was wondering whether anything else has changed besides the name. Thank you.
Can you post the structure that you get when the specparam file is exported to Matlab?
The fact that you file ends in | specparam suggest that specparam was run on the specparam for the PSD. Was this the case? You can verify by checking the History of the file (right-click on the file then File > View file history)