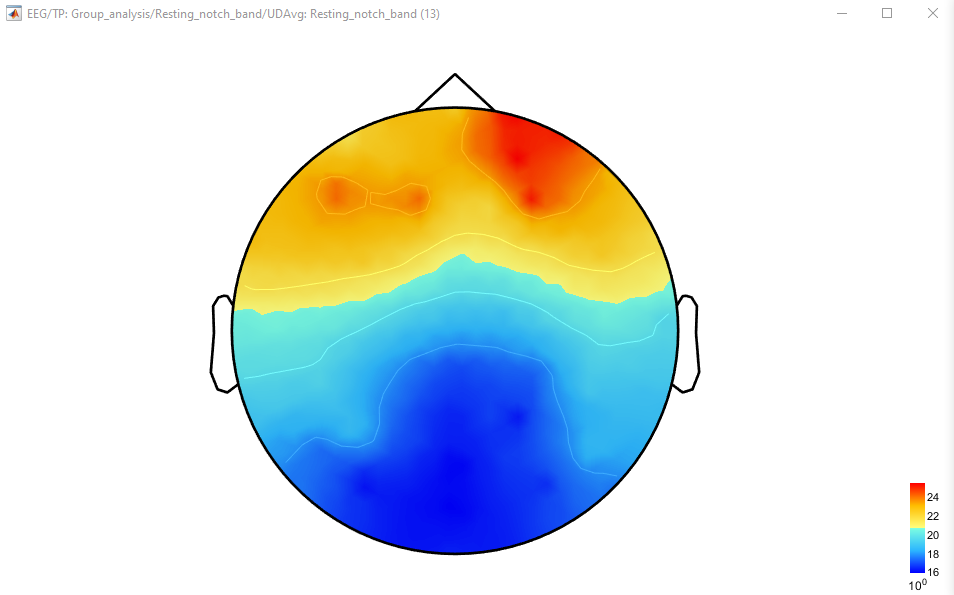
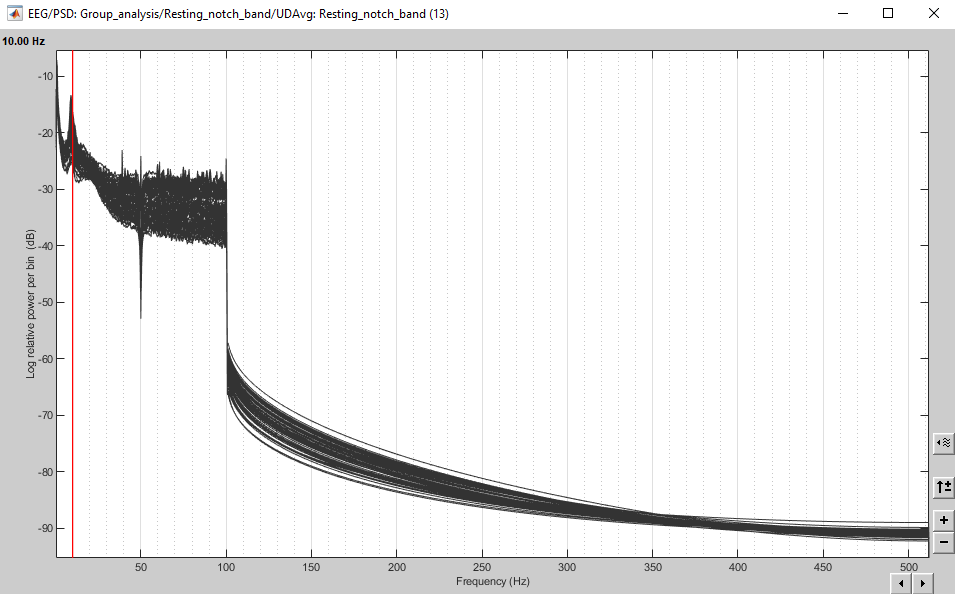
The top figure shows the strength of the resting-state EEG alpha-band (10 Hz) activity (in log power) from the grand average of 13 participants each with 5 mins of recording time with their eyes closed. The EEG was acquired from BioSemi 64 channel system (50 Hz notch filter and 1 - 100 Hz band pass filter setting). The bottom figure shows the corresponding PSD (Welch's method) which is represented by the topography of the top figure.
I find this topography quite perplexing.
I understand that the alpha-band activity should show the highest strength within the occipital lobe (due to the anatomical location of the visual cortex). However, the alpha band here is shown quite clearly from the frontal lobes.
Am I missing something here?
What might be some potential reasons for this?
What is the reference of the EEG?
If there is a single reference located in the back of the head (or even the mastoids), this could explain lower occipital amplitudes. Try instead with an average reference.
Another cause could be eye movements. Since these are eye-closed recordings, the participant might be moving their eyes enough to cause these high values observed at 10Hz on the frontal electrodes.
If you have applied some SSP/ICA cleaning prior to the calculation of the PSD, there is some chance that the alpha oscillations were captured in the projectors your computed. Try again without any SSP/ICA projector applied.
Do you observe the same results on various participants?
Thank you for that answer, Francois.
The reference in the above figure is indeed average reference.
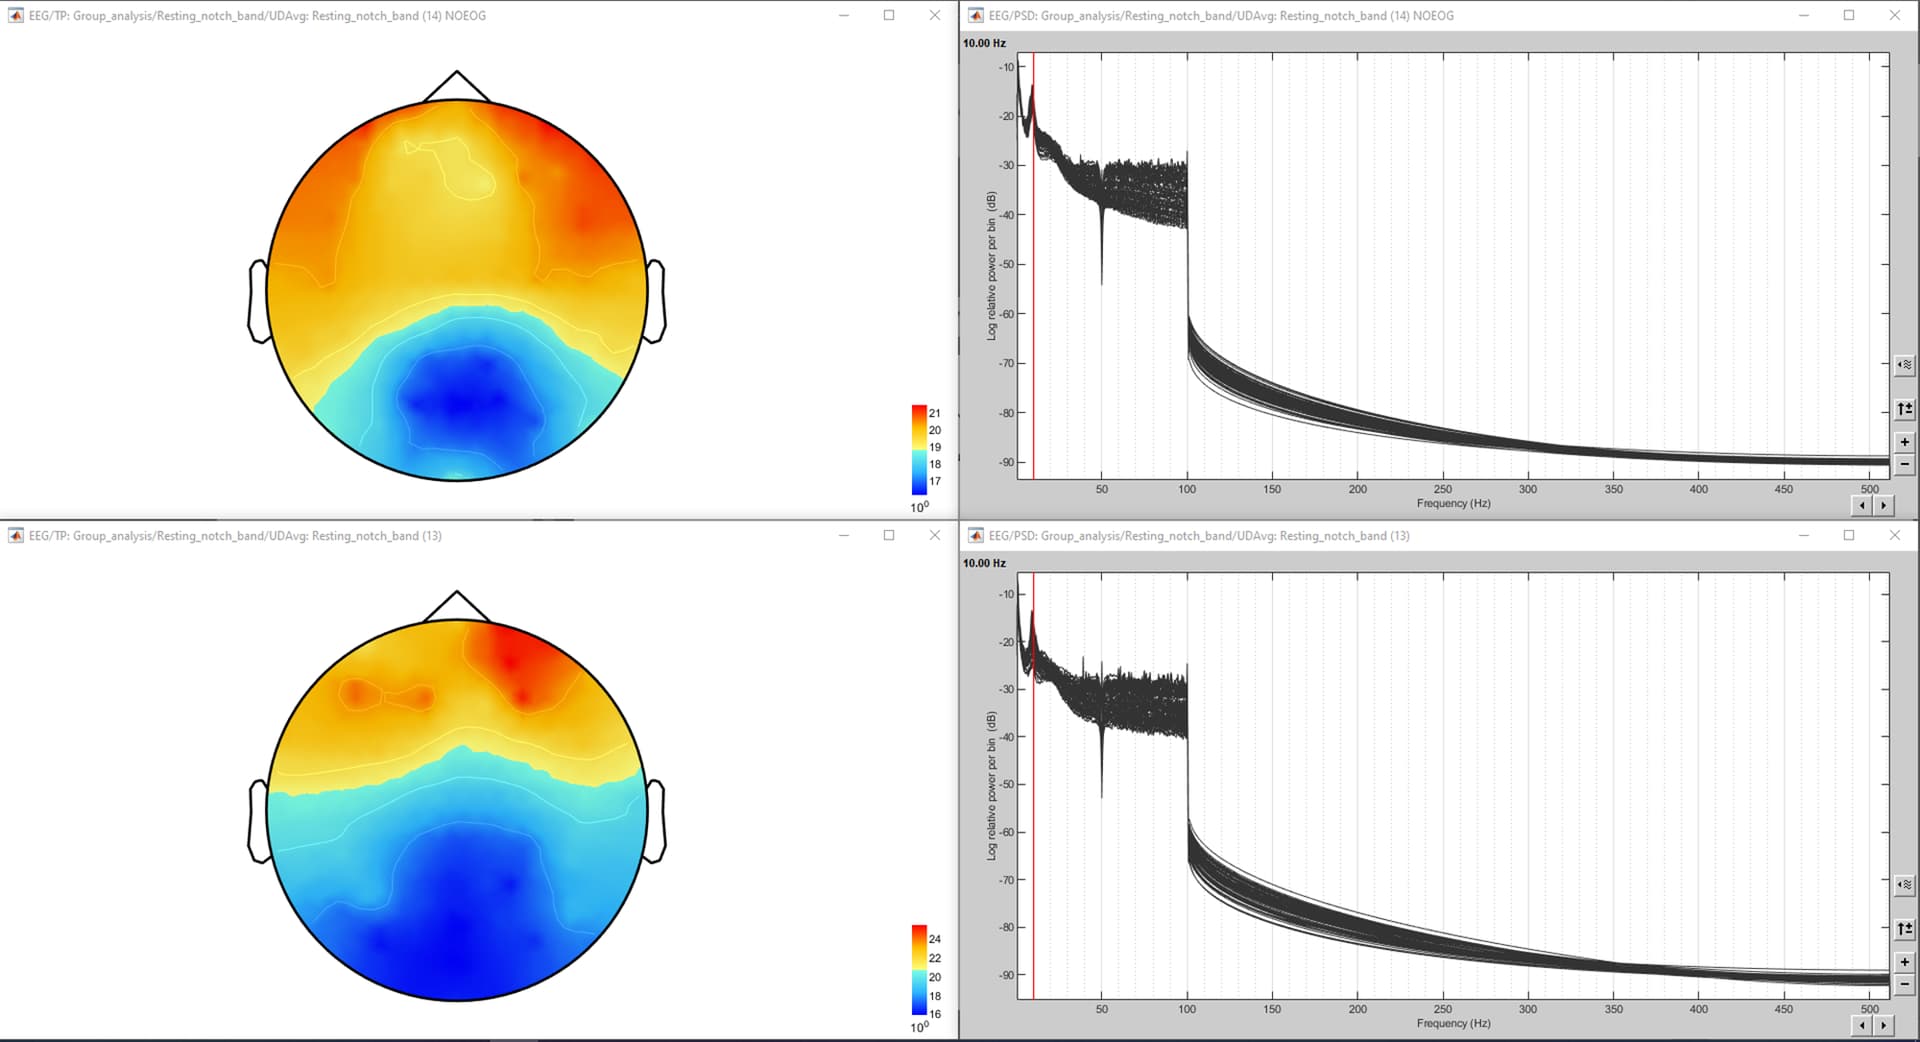
I followed your suggestion and tried again without any SSP/ICA projector applied (but with average reference applied of course) and below is the end result. The top line is the grand average topography of the resting-state EEG alpha-band (at 10 Hz) activity (in log power) each with 5 mins of recording time with their eyes closed without any SSP/ICA projector applied and with average reference. The bottom line is the same results but with SSP/ICA projectors. Individual data is not much different from grand average data (which is why I show here the grand average data).
As you can see they both look quite similar - if you have any further suggestions that I could follow or may have missed please let me know.
On a completely separate note, I have a different question.
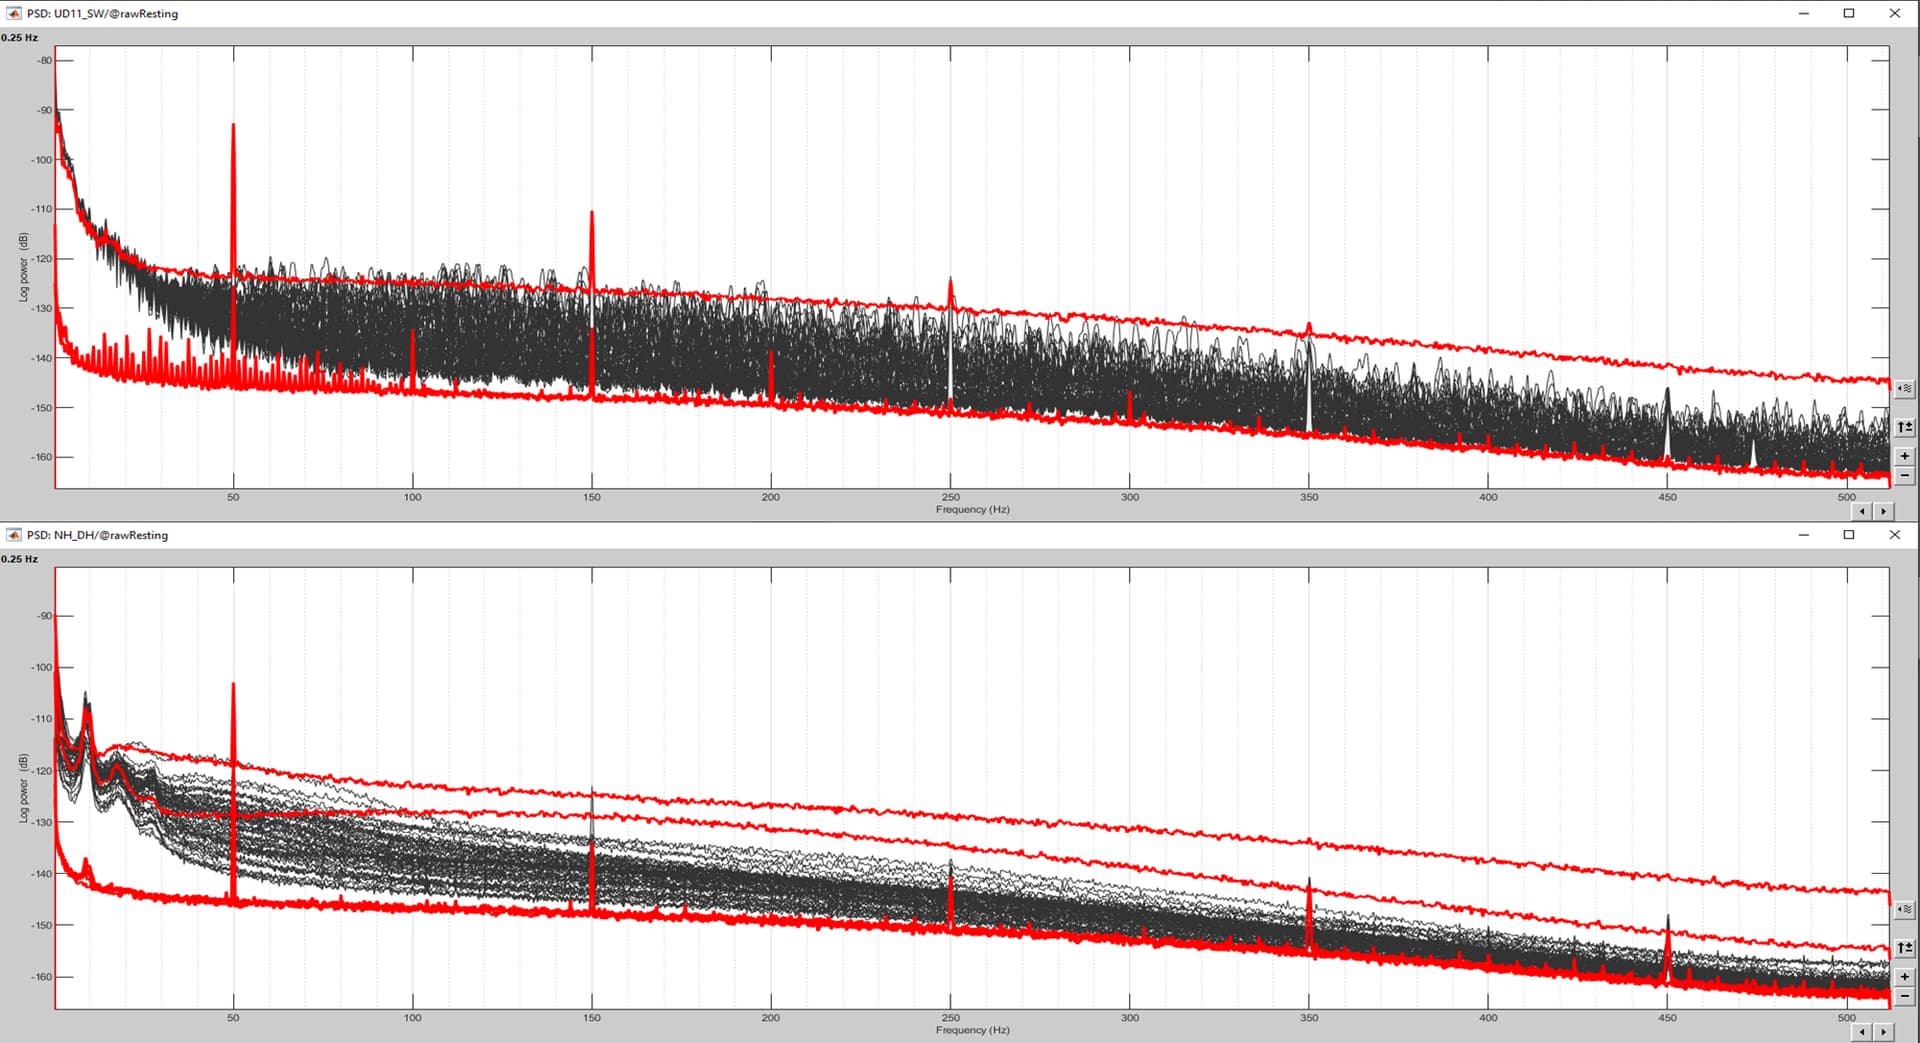
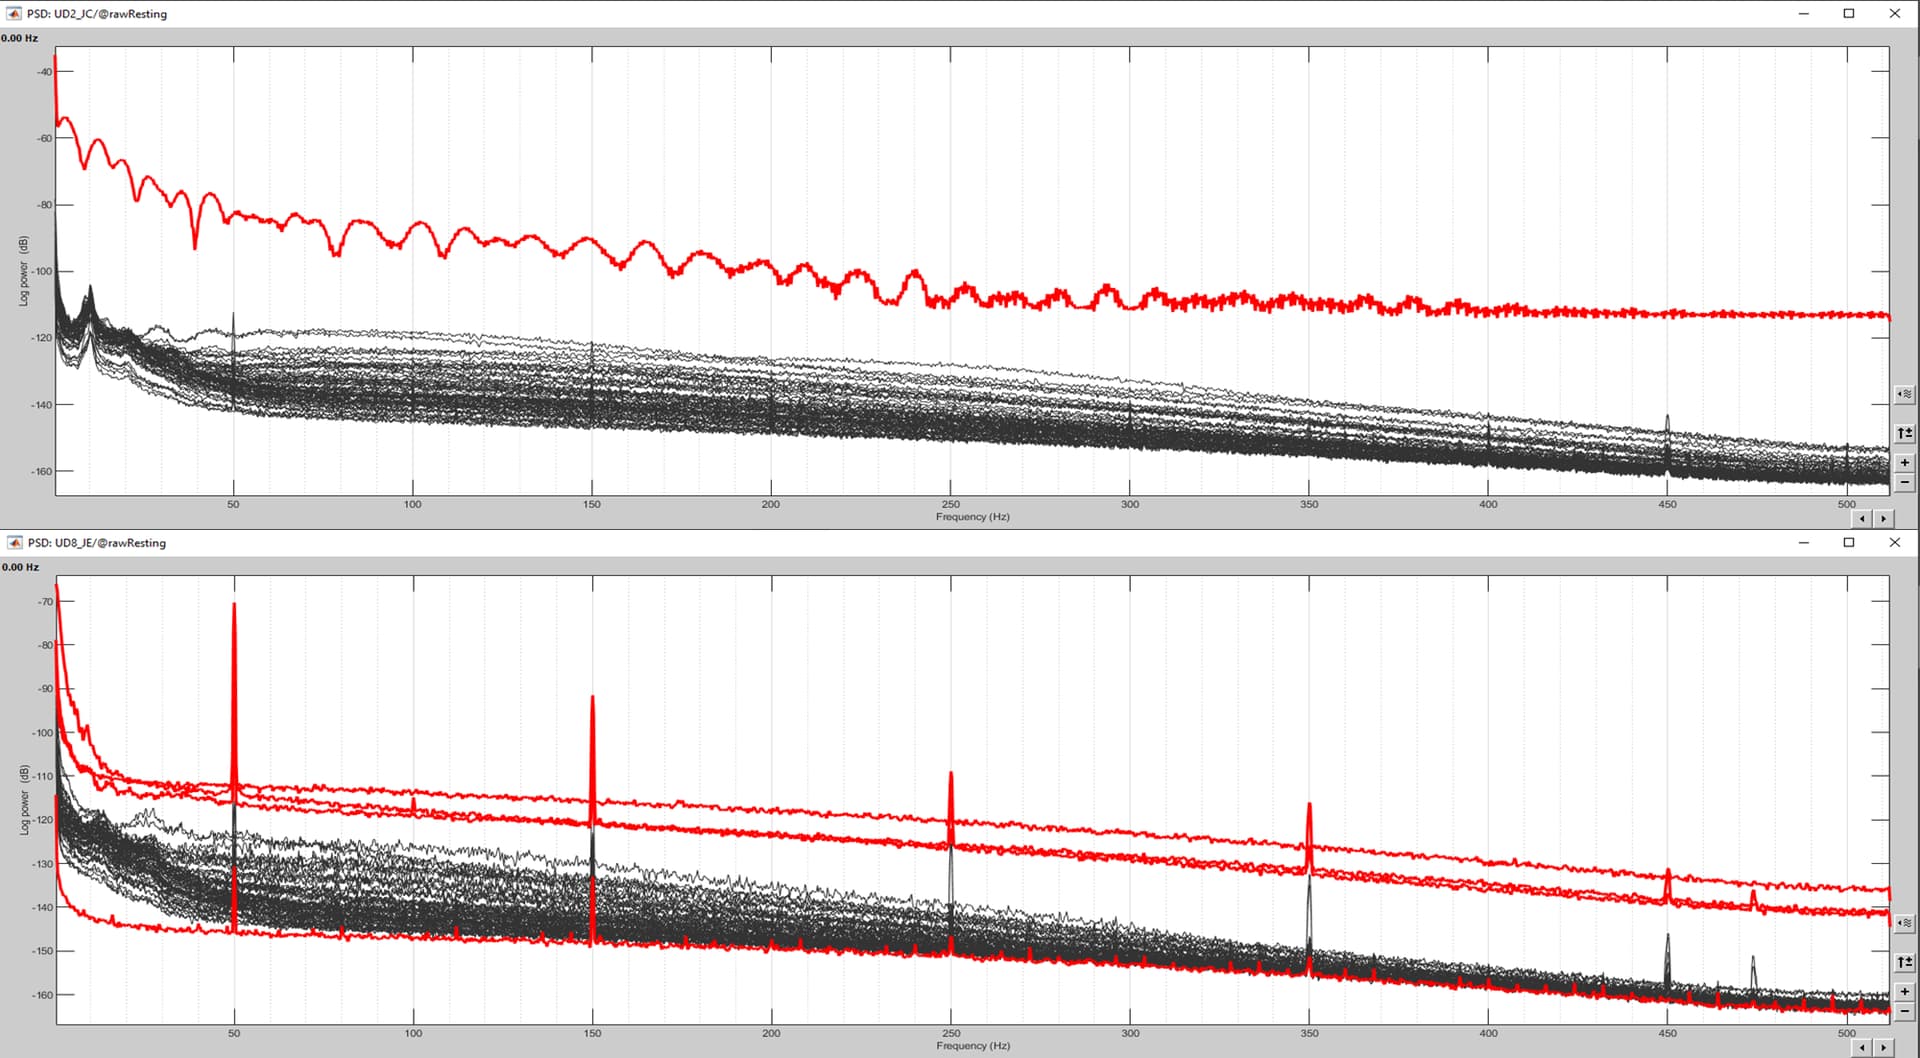
So far I've been using PSDs on raw pre-processed data to select bad channels from good ones. I’ve been removing channels that seem to be outliers from the main “group” of electrodes from eyeballing the PSDs. Here I attach some photos of some PSDs from my participants – bad channels that I’ve removed are highlighted in red.
Therefore my question is what are some recommended guidelines and/or previous literature that describes how to best decide on selecting BAD vs GOOD channels? Hope my question makes sense.
What is the original format for this data? Did the original file include electrode positions, or did you use a template?
Are you sure the positions of the electrodes is correct? Display the electrodes on the head surface, make sure the electrodes fit the head surface and that the occipital electrodes are located where they should be.
On a completely separate note, I have a different question.
Please create a new topic on the forum for each independent question. It makes it easier to handle for us, and for users to search for help.
Therefore my question is what are some recommended guidelines and/or previous literature that describes how to best decide on selecting BAD vs GOOD channels?
Everything that you highlighted on these screen captures looks bad.
I don't have any reference to give you that describes objective criteria to decide on accepting or rejecting electrodes, but this topic is commonly discussed in EEG data analysis. Maybe you can ask on the EEGLAB mailing list for the most complete reviews.
Isn't it just a colormap issue (mixed with a "display absolute values" wrongly activated)? Your colorbar goes from +16 (blue) to +25 (red), which I think is right if they were negative (as they should be, since you are in -dB). Then the occipito-parietal area would show the highest alpha level (-16 dB) compared to frontal (-25 dB).
Thank you for your response - you're right.
I went into the option of "2D Disc > Colourmap: Timefreq > Absolute values" and unclicked "absolute values" and now I can see what you are describing. Now, the occipito-parietal area IS showing the highest alpha level.
Do you know what unclicking the "absolute values" actually does to the data?
I'm not sure if this was covered in the tutorials.
You're welcome, I'm glad it worked. It does nothing to your data per se, this is just a display option (in some cases, e.g., source activation - see tutorials -, it's better to display absolute values rather than signed values).