Hi Team!
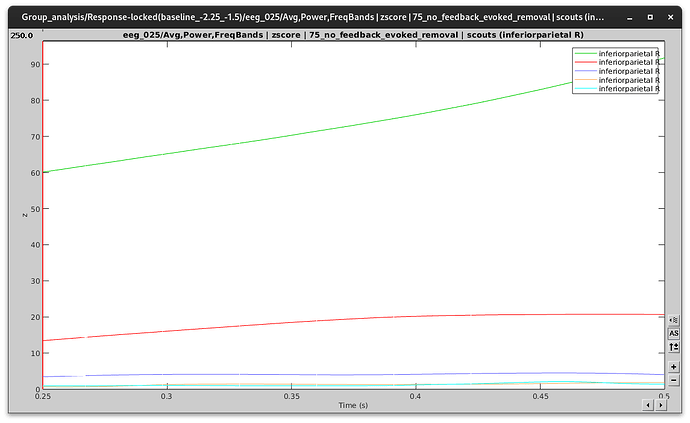
I computed time-frequency decomposition of the source time series with morlet wavelet with 5 frequency bands (delta, theta, alpha, beta, gamma). I ran ft_sourcestatistics on these files and found significant differences in certain cortical areas. I'm trying to extract from the TF files, the averaged power in each frequency band within a time window of a scout that I defined based on the above areas using the option Extract>Scout time series. The following plot is what I got from the Scout time series option.
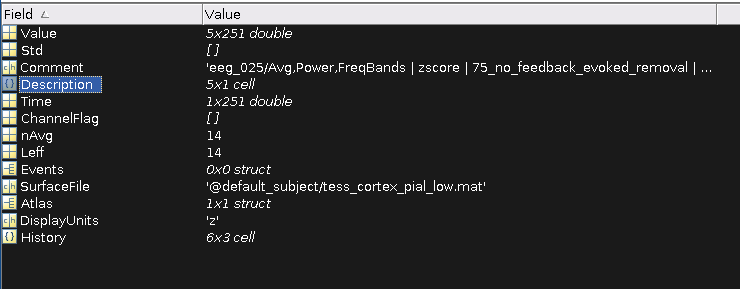
I suppose the 5 lines belong to 5 frequency bins from the above plot. But I'm not able to identify which line belongs to what frequency band as they have the same name. Even the file doesn't have any information related to the frequency bands.
It would be helpful if you fix this issue.
Thank you,
Sainath

