Hello,
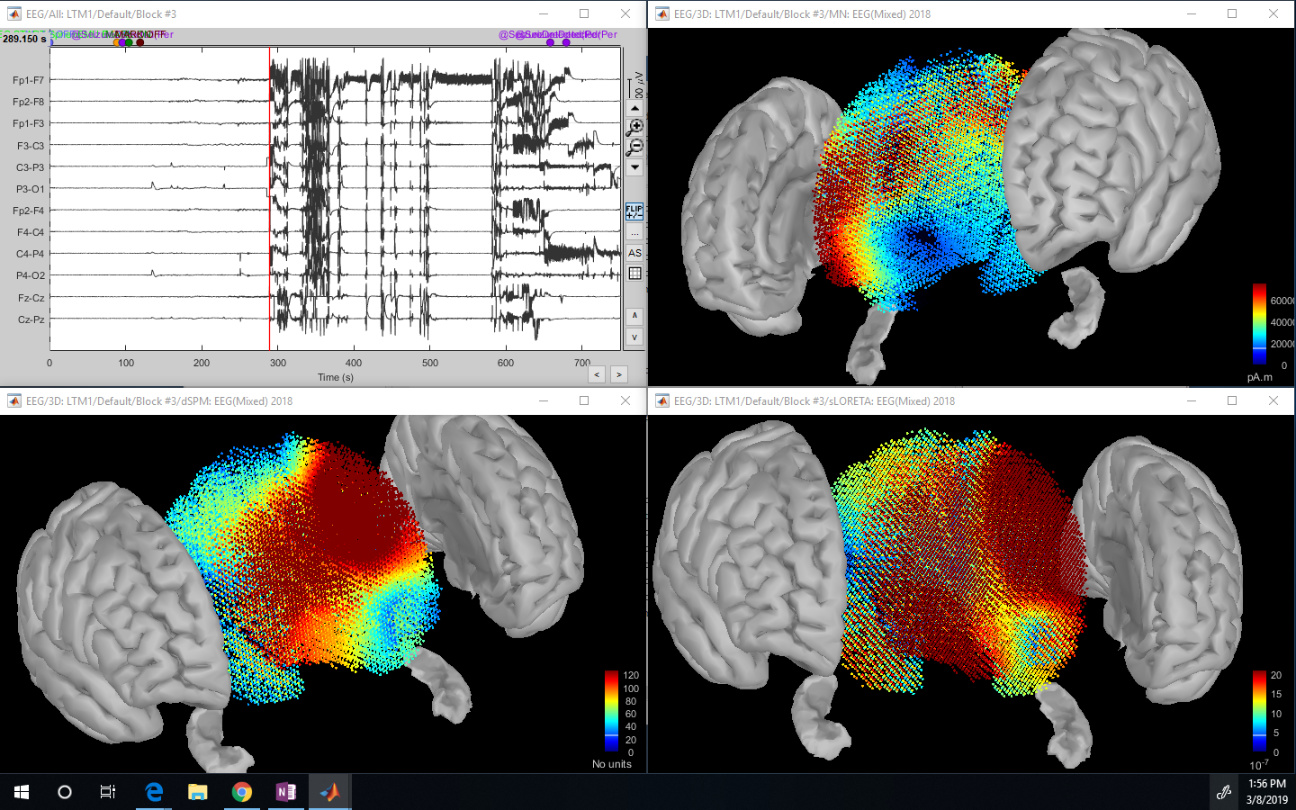
I am analyzing seizure data from a clinician. I have used the tutorials to develop the protocol shown below in order to visualize the seizure activity through the volume of the brain. Image also shown below. I was looking through the scouts tutorial and would like to display the time series for my hippocampus scouts. I have been unable to do this with User scouts, Structures or Source model selected under the scouts tab. Does anyone know why?
- Right click MRI: ICBM152 under anatomy > compute MNI transformation
- Right click default anatomy folder > generate BEM surfaces (leave defaults)
- Right clicked aseg atlas > less vertices > 15000
- Double click aseg atlas _1520V > Scout > ctrl select R and L hippocampi > Scout > edit surface > keep only selected scouts
- Ctrl select cortex_15002V and aseg atlas_15020V|keep > Merge surfaces
- Rename cortex_mixed_Hipp
- Exit figure
- Double click cortex_mixed_Hipp
- Scout > Scout > select Structures
- Scout > Atlas > New atlas > Source model options
- Ctrl select all structures > Scout > Scout > Set modeling options > Volume (This was selected rather than Deep brain, as the tutorial suggests, to view the activation within the volume rather than projecting to the surface)
- Move to functional tab
- For LTM1 then LTM2
- Right clicked channel file > Add EEG positions > ICBM152>Generic>ASA 10-20 94
- Right click Channel file > MRI registration > Edit… > Refine registration using head points, then project electrodes on scalp, save
- Ctrl select LTM1 and LTM2 > right click, Compute head model > Custom source model > leave defaults
- Checked source grids (volume and surface for both)
- Computed noise covariance matrices for both subjects, block by block, using quietest section
- LTM1 from Block 2 range 0-700s
- LTM2 from Block 6 range 0-245s
- Right clicked head model and computed sources for both LTM1 and LTM2
- MNI > current density (MNE)
- MNI > dSPM
- MNI > sLORETA
These "mixed head models" are interesting only for applying different constraints of location and orientation to the sources in the various brain structures. If you use "volume" for everything, there is really no point on using them.
I recommend you use instead volume head models. This will be much easier to compute and visualize, and less prone to errors of manipulation or interpretation.
https://neuroimage.usc.edu/brainstorm/Tutorials/TutVolSource
I did notice that and tried another protocol where I simply used the cortex and set its modeling option to volume. The tutorial you suggested I have done previously and moved away from because I wanted to view points throughout the depth of the brain, rather than have the sources projected to the surface. It was much faster though. I will be sure to use that one when we begin applying location and orientation constraints. Thank you Francois.
The tutorial I indicated just now has nothing to do with surfaces.
Please make sure you actually read the references we give you on this forum, otherwise this is not very useful that we spend time in replying.
You are right. I have been trying a number of protocols with my data to visualize it and investigate different aspects, and I got them mixed up. I moved away from the volume source protocol and began working with the structures set to volume atlases in order to visualize the sources as a 3D matrix of points. We felt this would be a more powerful way to show the clinician the analyses.
I apologize that you feel I have wasted your time. That was not my intent. I did read over tutorials and attempt to troubleshoot in the GUI before each post to the forum, however I was clearly missing a great deal. I will read back through the tutorials for a deeper understanding and read more on the methods as a whole so that I may better troubleshoot in the future.
Thank you for all your help and for the great software you have provided us.
No problem, we're here to help 
When reading the tutorials, our recommendation is that you actually follow them using the example dataset provided with each tutorial, starting with all the introduction tutorials (at least until #23 for source analysis). Reproducing is definitely the best way to learn.
There are also additional readings suggested on the main tutorial page, and at the end of many tutorials.
In my experience, clinicians are more comfortable with volume source maps (https://neuroimage.usc.edu/brainstorm/Tutorials/TutVolSource), either slice by slice (possibly using the contact sheet display) or as a "glass brain" (MIP checkboxes selected in the MRI viewer).
Making videos with multiple views is also something popular:
https://neuroimage.usc.edu/brainstorm/Tutorials/Epileptogenicity#Create_a_movie_with_the_SEEG_signals
For EEG and clinical data, make sure you also follow this one:
https://neuroimage.usc.edu/brainstorm/Tutorials/Epilepsy