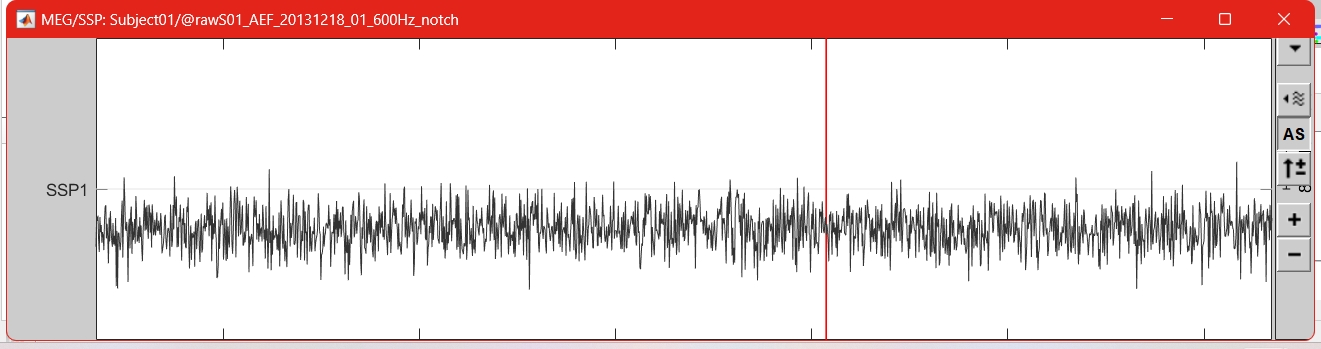
I found my "SSP1" trace was different from the example in tutorial when I practiced your providing data in Part 4 of Tutorial 13 step by step (The data I used was "sample_introduction"). My picture is as follows.
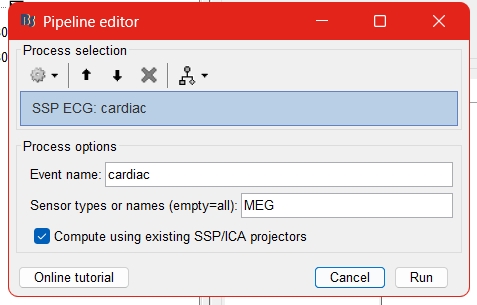
Make sure that in the previous step of the tutorial you have typed in the name of the events you wish to define the SSP around; here it should be 'cardiac'
It seems the Component #1 was selected (therefore removed) when the plot was created. Just uncheck it. The time series displayed is technically zero (as the component is removed).