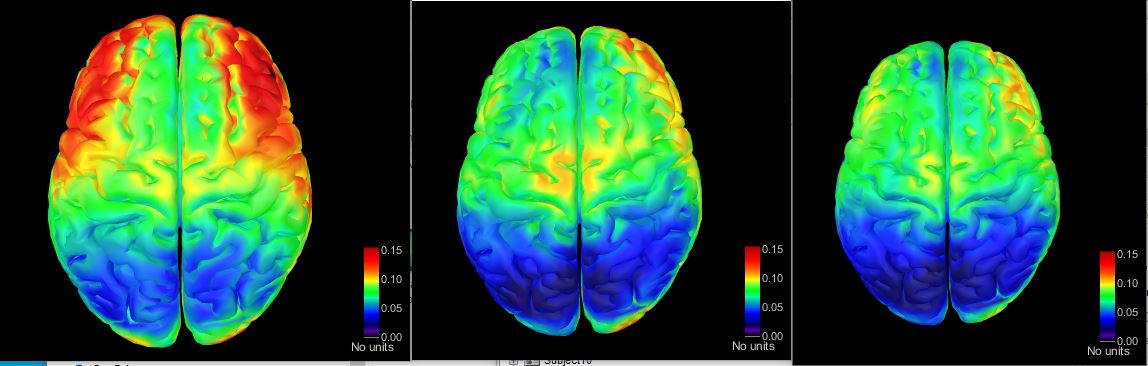
I created a average (5 participants) of relative power activity mapped to the standard brain that brainstorm uses. Here's a picture of the 5 participant average high beta activity pre, during and and post treatment using sloreta.
Originally, i was selecting some destrieux scouts (G-middle frontal, G-precentral and G-post central) and extracting relative power for each frequency band. After extraction, i'd put my numbers into my stats program (SPSS) and run a repeated measures ANOVA.
Anyway, I have a few questions
Is it possible to make statistical maps to determine which voxels display significant changes in brainstorm? For example, when i look at the precentral scout at baseline, there is a bunch of red activity laterally located on either side of the precetral region, but there is no red activity near the center part of the precentral region. I basically want to only analyze relevant voxels within the precentral scout for each patient at each frequency band, and compare those voxels across each of my conditions. I am wondering if there is a way to pick/statistically determine which voxels are significantly active within that region using brainstorm.
Does brainstorm implement statistical non-parametric mapping (SnPM) ? Or does it have something similar?
I am wondering if there is a way to pick/statistically determine which voxels are significantly active within that region using brainstorm.
Either you run your statistical tests on the full cortex (15000V) and obtain a list of cortex with significant differences between conditions.
Or you first create your scouts of interest (=ROIs), extract the mean value over the vertices in each scout, and run your tests only on the scouts time series.
From your description, it looks like you only tried to use ROIs from the anatomical atlases generated by FreeSurfer. Not all the regions in these anatomical atlases are usable for functional analysis: many are too large, or too asymmetric. If you need different shapes of ROIs, simply draw them.
Note that there is one thing you are not allowed to do: run first a full-brain analysis, observe what is "almost significant", then re-run the analysis on a smaller test set containing only this "almost significant" data to get better p-values.
Does brainstorm implement statistical non-parametric mapping (SnPM) ? Or does it have something similar?
Thanks very much for this helpful information. I have a few questions.
Sorry if this is irrelevant, but I am using minimum norm imaging, sloreta, constrained sources. For my permutation tests, do i used non-parametric (wilcoxon singned-rank test) or parametric (paired students t test)? If the constrained sources doesn't matter, which test is better for voxel data?
If i am interested in relative power data and mapping out my ROI, would i run my permutation test on relative power data and then map/select my voxels for each frequency band of interest?
In order to run my permutation test in brainstorm, do my data lengths need to be the same per condition?
For this comment "From your description, it looks like you only tried to use ROIs from the anatomical atlases generated by FreeSurfer. Not all the regions in these anatomical atlases are usable for functional analysis: many are too large, or too asymmetric."
-Are there any anatomical atlases in brainstorm that are usable for functional analysis without drawing them? If possible, could i please get a link for a tutorial on how to draw regions of interest?
Sorry if this is irrelevant, but I am using minimum norm imaging, sloreta, constrained sources. For my permutation tests, do i used non-parametric (wilcoxon singned-rank test) or parametric (paired students t test)?
would i run my permutation test on relative power data and then map/select my voxels for each frequency band of interest?
Yes, this is one possibility.
If you have a strong hypothesis for your frequency band of interest: run your analysis only for this frequency band. You'll have less multiple comparisons to correct your p-values for.
(same thing for the number of input time points, and the number of sources you're testing => Testing one single ROI leads to a lot less problems with multiple comparisons than testing 15000 sources simultaneously)
In order to run my permutation test in brainstorm, do my data lengths need to be the same per condition?
Yes, the dimensions of all the matrices need to be identical. It performs one test per signal/time/frequency. Hence the problem of multiple comparisons.
Are there any anatomical atlases in brainstorm that are usable for functional analysis without drawing them?
concerning you comment "If you have a strong hypothesis for your frequency band of interest: run your analysis only for this frequency band. You'll have less multiple comparisons to correct your p-values for.
(same thing for the number of input time points, and the number of sources you're testing => Testing one single ROI leads to a lot less problems with multiple comparisons than testing 15000 sources simultaneously)"
What i want to do, is run a permutation test on a single scout, and within that scout, i want to compare pre stimulation relative power (beta band) to post stimulation relative power (beta band) for every voxel within the scout i selected.
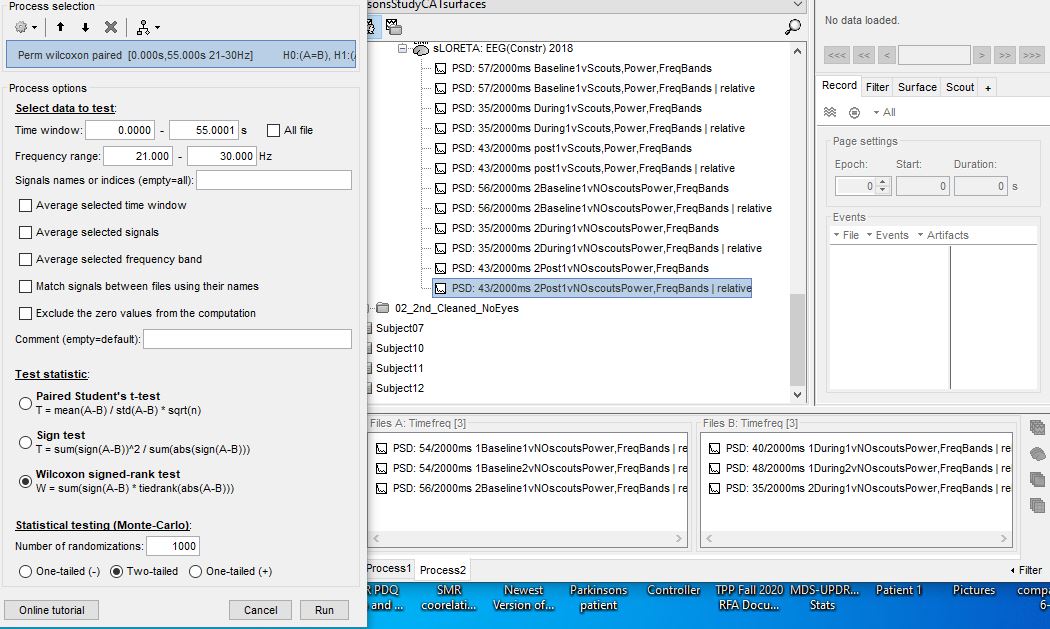
I moved my pre and post relative power data into the process two box, but there is no option for scouts. Here is a picture
I also would like to be able to visualize these significant voxels on the cortex but only for the scout i analyzed. For example, the post central region would display significant voxels and the rest of the cortex remain gray.
I moved my pre and post relative power data into the process two box, but there is no option for scouts.
In the option, format and copy-paste the list of indices in your scout of interest (https://neuroimage.usc.edu/brainstorm/Tutorials/Scouts#On_the_hard_drive).
Or easier: extract the scouts values first, with process "Extract > Extract scout time series", do not select the option "concatenate" in you process multiple files at once. Use the scout option "All" if you want to keep all the sources instead of averaging them.
I also would like to be able to visualize these significant voxels on the cortex but only for the scout i analyzed. For example, the post central region would display significant voxels and the rest of the cortex remain gray.
Is there a way to do this in brainstorm?
Hiding significant results you don't want to see is questionable scientifically.
Brainstorm will not allow that, but you can do anything you want by manipulating directly the data structures saved in your database.
You asked about this in your other thread already: please do not ask multiple questions in one thread, and do not ask the same question in two different threads, it makes it easier for everybody - Thanks