Hello
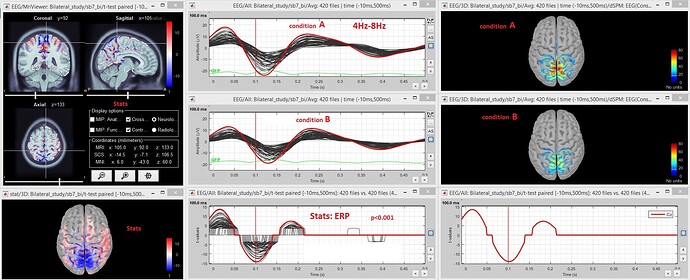
In the attached figure bellow, there is significant difference between conditions A>B over parietal region. When I do paired t test for within group comparison, there is blue spot around that area what corresponds to negative t value. If I put the scaling from zero to 4, blue area becomes gray, like background color. If I take absolute values, the scaling would differ across conditions. How should I manage this?
Thanks
Hello
I understand your figures, which are very clear, but I don’t understand what is wrong with them.
What do you mean with “If I put the scaling from zero to 4, blue area becomes gray”? For statistical results (that you can configure with the “Stat” tab), changing the colormap should not affect the selection of significant vertices on the cortex map, only the color should change.
Additionally, you may find interesting answers in these other tutorials:
http://neuroimage.usc.edu/brainstorm/Tutorials/Difference
http://neuroimage.usc.edu/brainstorm/Tutorials/Statistics
http://neuroimage.usc.edu/brainstorm/Tutorials/Workflows#EEG_recordings
http://neuroimage.usc.edu/brainstorm/Tutorials/VisualGroup
Francois
Thanks for the reply.
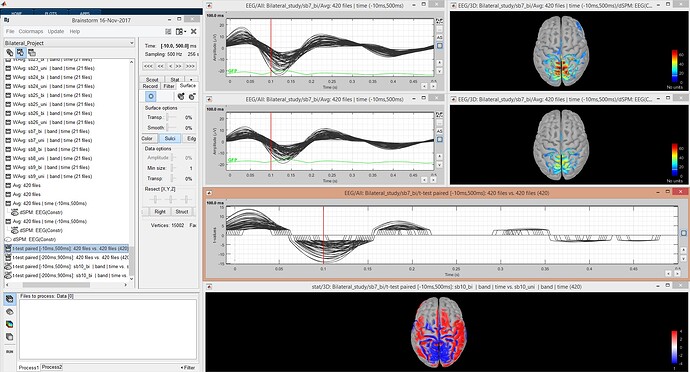
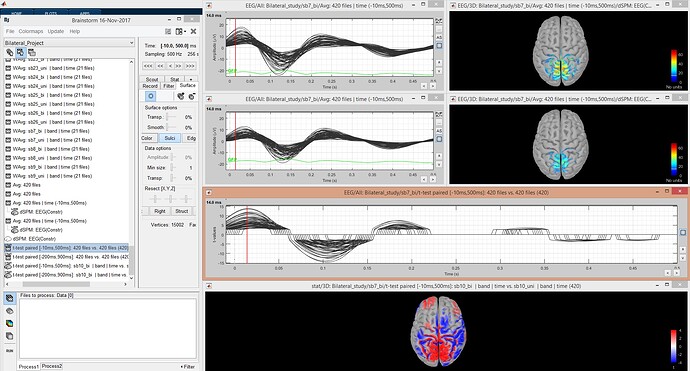
I have attached more figures. In brain maps, negative deflection is depicted as red color, and it is more red in A vs. B (above figures).
Regarding stats, when I select significantly different negative ERP deflevtion at 100 ms (figure 1), over parietal region (more activity depicted as red in above figures) there is blue color, what is misleading, it should be red. When I select positive deflection in ERP stats, 14 ms (figure 2), this time color becomes red. What is the issue, colors corresponding to negative ERP deflection in brain maps and in stats brain map figure do not match (figure 1).
Thanks
Figure 1
Figure 2
I don’t think there is anything wrong with your results. The colors you observe in the stat results on the cortex are the t-statistic estimated form the sources. It has the same sign as (A-B). Maybe start by computing simply (mean(A)-mean(B)) before the t-test, it would help you understand what happens.
Note that the source maps you display at the top-right of your images are not the real values. There is an absolute value applied to these maps. Right-click on the figure > Colormap > Unselect the option “Absolute values”. You will see the positive/negative values of the min norm source maps:
http://neuroimage.usc.edu/brainstorm/Tutorials/SourceEstimation#Sign_of_constrained_maps
Comparing source maps is not easy, as you have two options: |A|-|B| or |A-B|. Read carefully these tutorials to understand the implication of one option or the other:
http://neuroimage.usc.edu/brainstorm/Tutorials/Difference#Constrained_sources
http://neuroimage.usc.edu/brainstorm/Tutorials/VisualGroup#Group_analysis:_Sources
Thanks Francois, it is now clear. In the figures above I have absolute values, but not in stats figures.


