I’ve done some source reconstructions and statistics for ERP components with your toolbox and I’d like to ask if I done everything correctly.
It is a between-subject design so I’m only interested in group differences. The EEG files were already preprocessed with another software. Thus, I imported an average file for each participant. Then I defined a scout mask and checked whether there are any group differences in the current density values over the duration of an entire ERP component (e.g. N1).
This is my processing pipeline after calculation the head models:
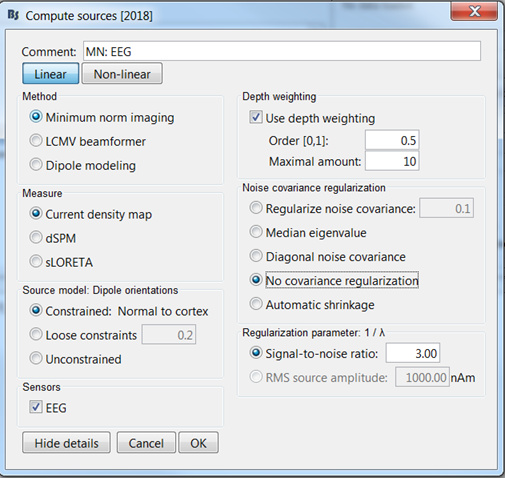
Compute sources on the average files for every participant (full kernel and current density map)
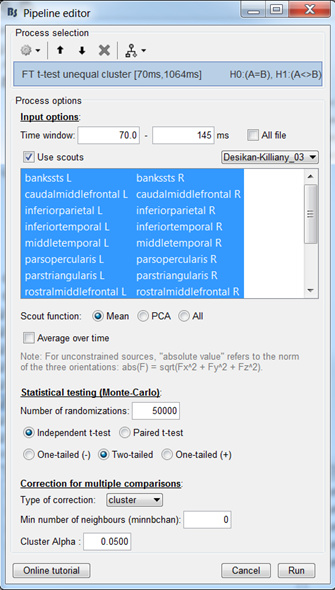
Are the steps correct or did I miss something? I’m also wondering whether the cluster wise correction, spatial smoothing, and the z-score transformation are appropriate in this case.
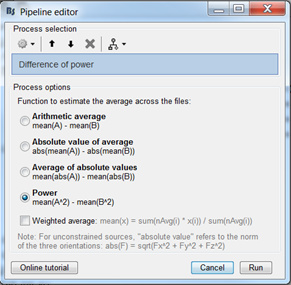
Then I calculated power differences to visualize for which group the response is stronger or weaker
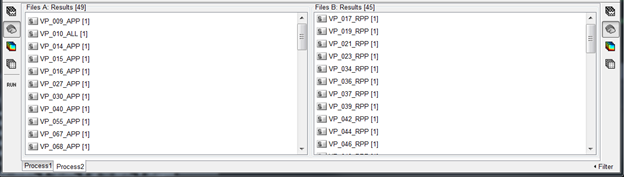
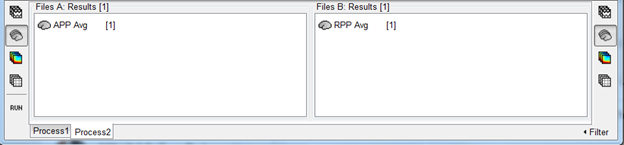
Group averages were inserted to process2
Thank you very much for your help!
Best regards,
Anja
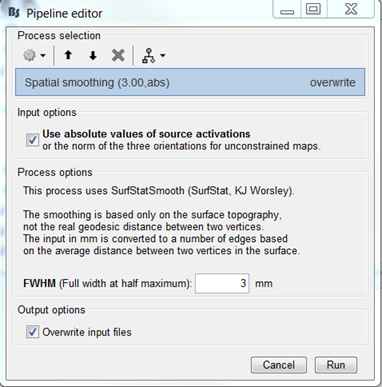
Everything looks fine except the absolute value taken on the z-scores: the z-score signs are meaningful (increase/decrease from baseline). Hence either the smoothing is done on signed values (uncheck the abs option), or compute zscores of absolute value of source amplitudes (check the box where it says ‘not recommended’: I know… It’s a matter of debate )
Indeed, not recommended in our standard pipeline…
In case of doubts in the order in which to apply the different operations in a group analysis, you can refer to this page: https://neuroimage.usc.edu/brainstorm/Tutorials/Workflows
@Francois
I Loocked at the group analysis chapter and I’d like to ask if I understood it right:
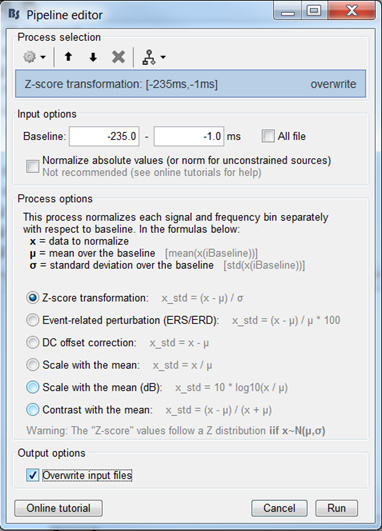
First, I do the baseline normalizations on the subject level.
Secondly, I average the subjects to create a group average, then I do the smoothing, and with the smoothed group averages I do the power differences.
Furthermore, for the cluster source statistic I use the subject sources that are only normalized without smoothing.
First, I do the baseline normalizations on the subject level.
Secondly, I average the subjects to create a group average, then I do the smoothing, and with the smoothed group averages I do the power differences.
This depends a bit on what you are doing and what type of data. But if you understood how to read this page, you should be able to find the appropriate analysis pipeline for your case.
Furthermore, for the cluster source statistic I use the subject sources that are only normalized without smoothing.
Where did you get this from? If you are expecting to use the FieldTrip cluster-based analysis, you won't be able to run it on full brain source maps. This typically requires too much computation time and/or too much memory. Prefer an ROI analysis, or another non-parametric test.
Sorry if I annoyed you with my questions.
Since I'm relatively new to BS I just wanted to make sure that I do not make any mistakes.
I read the page again and I think I got it right.
I think we missunderstood us here. As you can see from my first post I’m doing FieldTrip cluster-based analysis only on a specific time window (70-145ms) and on some scouts (26 scouts from Desikian Killiany atlas).

 )
)