Hello everyone, I'm currently using brainstorm to create the time-frequency graph. However, my graph is a little bit weird. I can not confirm the graph is acceptable or not. If my graph is not right, please give me some recommendation to correct it.
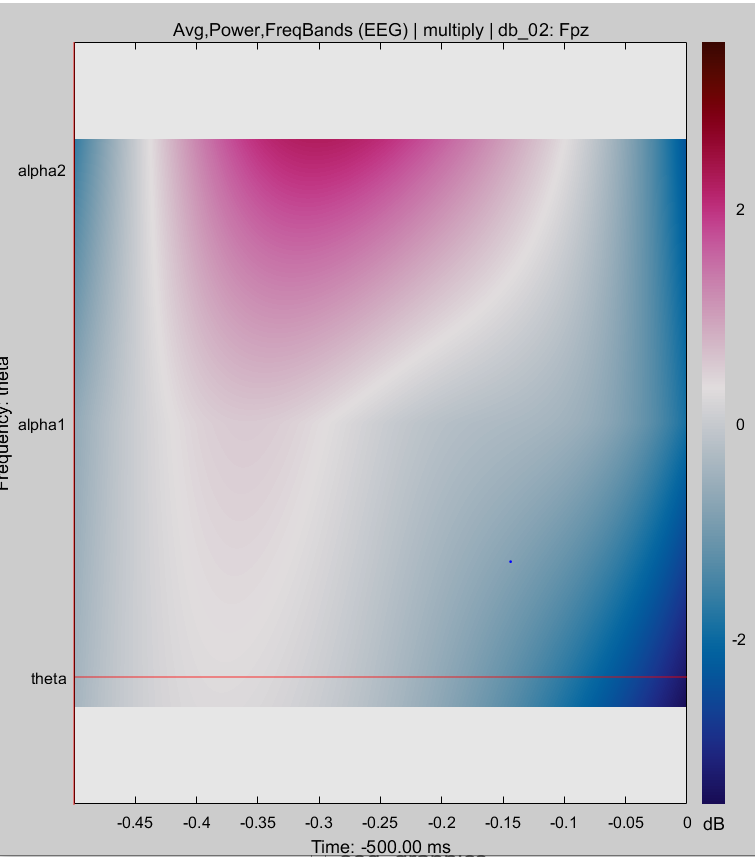
The graphs looks OK.
If you want the full frequency spectrum, change it in the options of the TF process:
https://neuroimage.usc.edu/brainstorm/Tutorials/TimeFrequency#Process_options
What is more concerning is the short duration of your epochs for expecting to study theta rhythms. Make sure you read and understood the notion of edge effects presented in the tutorials:
https://neuroimage.usc.edu/brainstorm/Tutorials/TimeFrequency#Edge_effects
Use a linear or log list of frequencies, and display these edge effects on your TF maps:
https://neuroimage.usc.edu/brainstorm/Tutorials/TimeFrequency#Display:_Time-frequency_map
Thank you, sir. I will revise it according to your suggestion.