Hello,
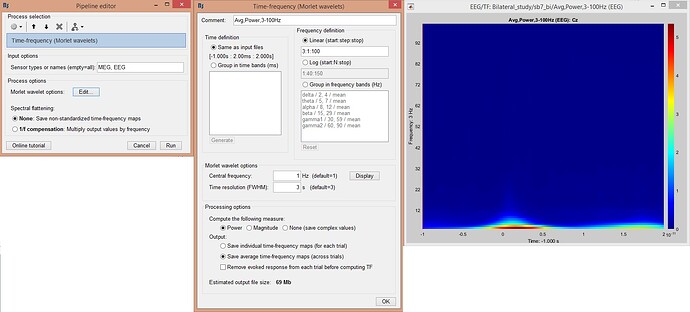
I did time-frequency analysis, using Morlet wavelets (figure 1). To show the oscillations at lower frequencies, I used longer time window but I could not get expected strong oscillations at lower frequencies after baseline normalization.
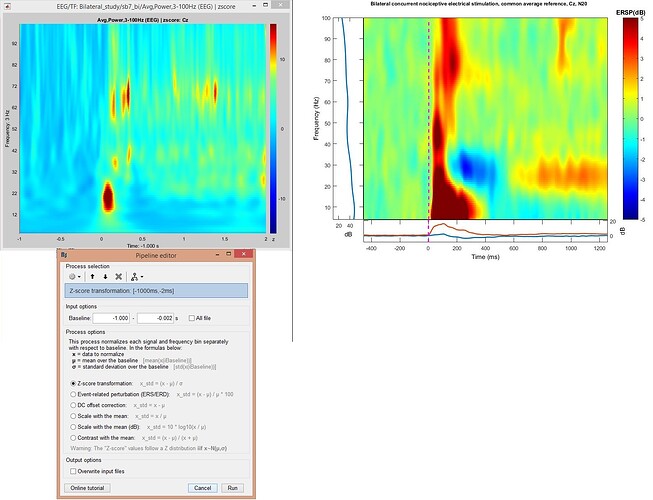
After baseline normalization (figure 2), the figure looks very different from the figure I got with EEGLab (figure 2). I prefer to use Brainstorm, because here I can also do source analysis. I wonder what I did wrong with Brainstorm?
EEGLab parameters were:
Each trial: -540 ms before to 1340 ms
Image frequency direction: normal
Using 0.5 cycles at lowest frequency to 15 at highest.
Generating 200 time points (-457.0 to 1257.0 ms)
The window size used is 83 samples (166 ms) wide.
Estimating 97 linear-spaced frequencies from 4.0 Hz to 100.0 Hz.
Processing time point (of 200): 10 20 30 40 50 60 70 80 90 100 110 120 130 140 150 160 170 180 190 200.
Computing the mean baseline spectrum
Thanks
Figure1
Figure 2
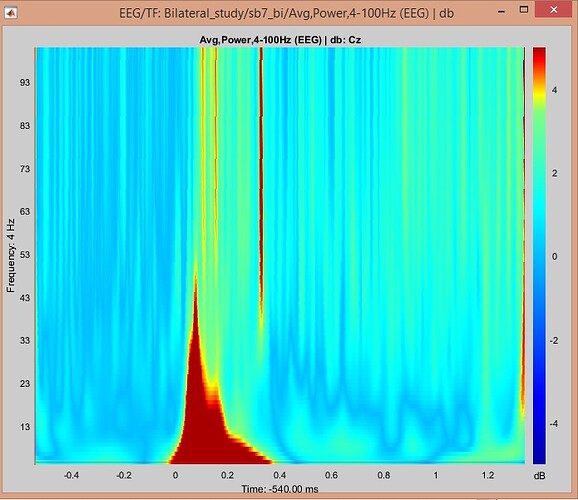
And this is in dB, using Brainstorm
Here is a response from Dimitrios Pantazis:
I can see 2 differences in the analysis:
- In the first figure you used z-score in brainstorm vs. db in EEGLab. When you used dB in your subsequent post, results looked somewhat closer to EEGLab
- Your EEGLab results have lower temporal resolution and higher spectral resolution than the brainstorm figure. I am also unsure if the EEGLab analysis is based on Morlet wavelets, maybe they are implemented in a way that I don’t understand (“The window size used is 83 samples (166 ms) wide”, how can the window size be fixed?)
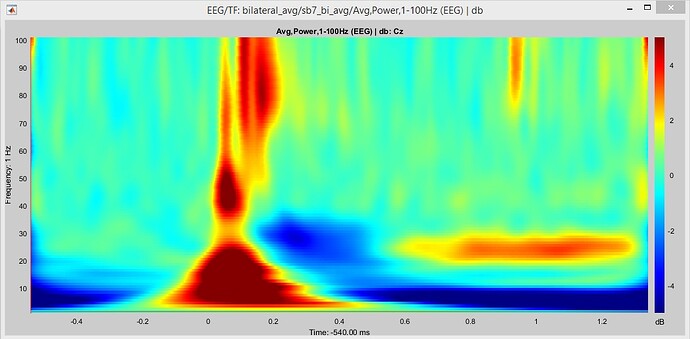
Please recompute the Morlet wavelet power using a much longer Morlet wavelet (e.g. central frequency 1 and time resolution FWHM 6; perhaps try even higher than 6). This should yield something closer to the EEGlab results if plotted as db.
Thanks Francois. It is done.
- I wonder if there is an easy way to apply Morlet wavelets per trial but for each folder, condition, separately. We have 2 options: average across all trials and per each trial. If I put data from 10 conditions into a RUN box, can I get averages for 10 conditions separately as well? I would need it for running the statistics using the averages from each condition.
- How can I get rid of dark blue spots at lower frequencies, before and after zero (stimulus onset)?
Thanks
Thanks Francois, for the suggestions.
Hi
I wonder what can be the reason of getting different time-freqeucny analysis results with Brainstorm vs. EEGLab. With Brainsrom the maximal high gamma oscillation is over over AF7 and when I do source localisation it is localized in the frontal lobe. But with EEGLab maximal high gamma oscillation is over Cz:
I am more convenient with Brainstorm results, because in general EEGLab always shows maximal activity over Cz when we create topoplots. I wonder if the discrepancy can be due to different approachs in analysis. In Brainstorm I used Morlet transform in EEGLab it should be multitaper.
Thanks
I moved your new question to your previous topic, as it is the same question of differences between Brainstorm and EEGLAB in time-frequency analysis.
Another of your related posts: How to get rid of activity before zero in time frequency plot?
If the method is different, it is normal to obtain different results (Morlet wavelets vs multitaper).
If you use exactly the same method, then you should still observe differences in the results because of the differences in implementation. If you want to check how Morlet wavelets are implemented in Brainstorm:
https://github.com/brainstorm-tools/brainstorm3/blob/master/toolbox/timefreq/bst_timefreq.m#L454
https://github.com/brainstorm-tools/brainstorm3/blob/master/toolbox/timefreq/morlet_transform.m
https://github.com/brainstorm-tools/brainstorm3/blob/master/toolbox/timefreq/morlet_wavelet.m
Ideally, no matter what measure you use, you should obtain similar results at the level of the group-level statistics. What is relevant is not so much the actual value given by one metric or another, but to know whether the difference of this measure taken between experimental conditions or subject groups is significant.
Thanks Francois for the comment.


