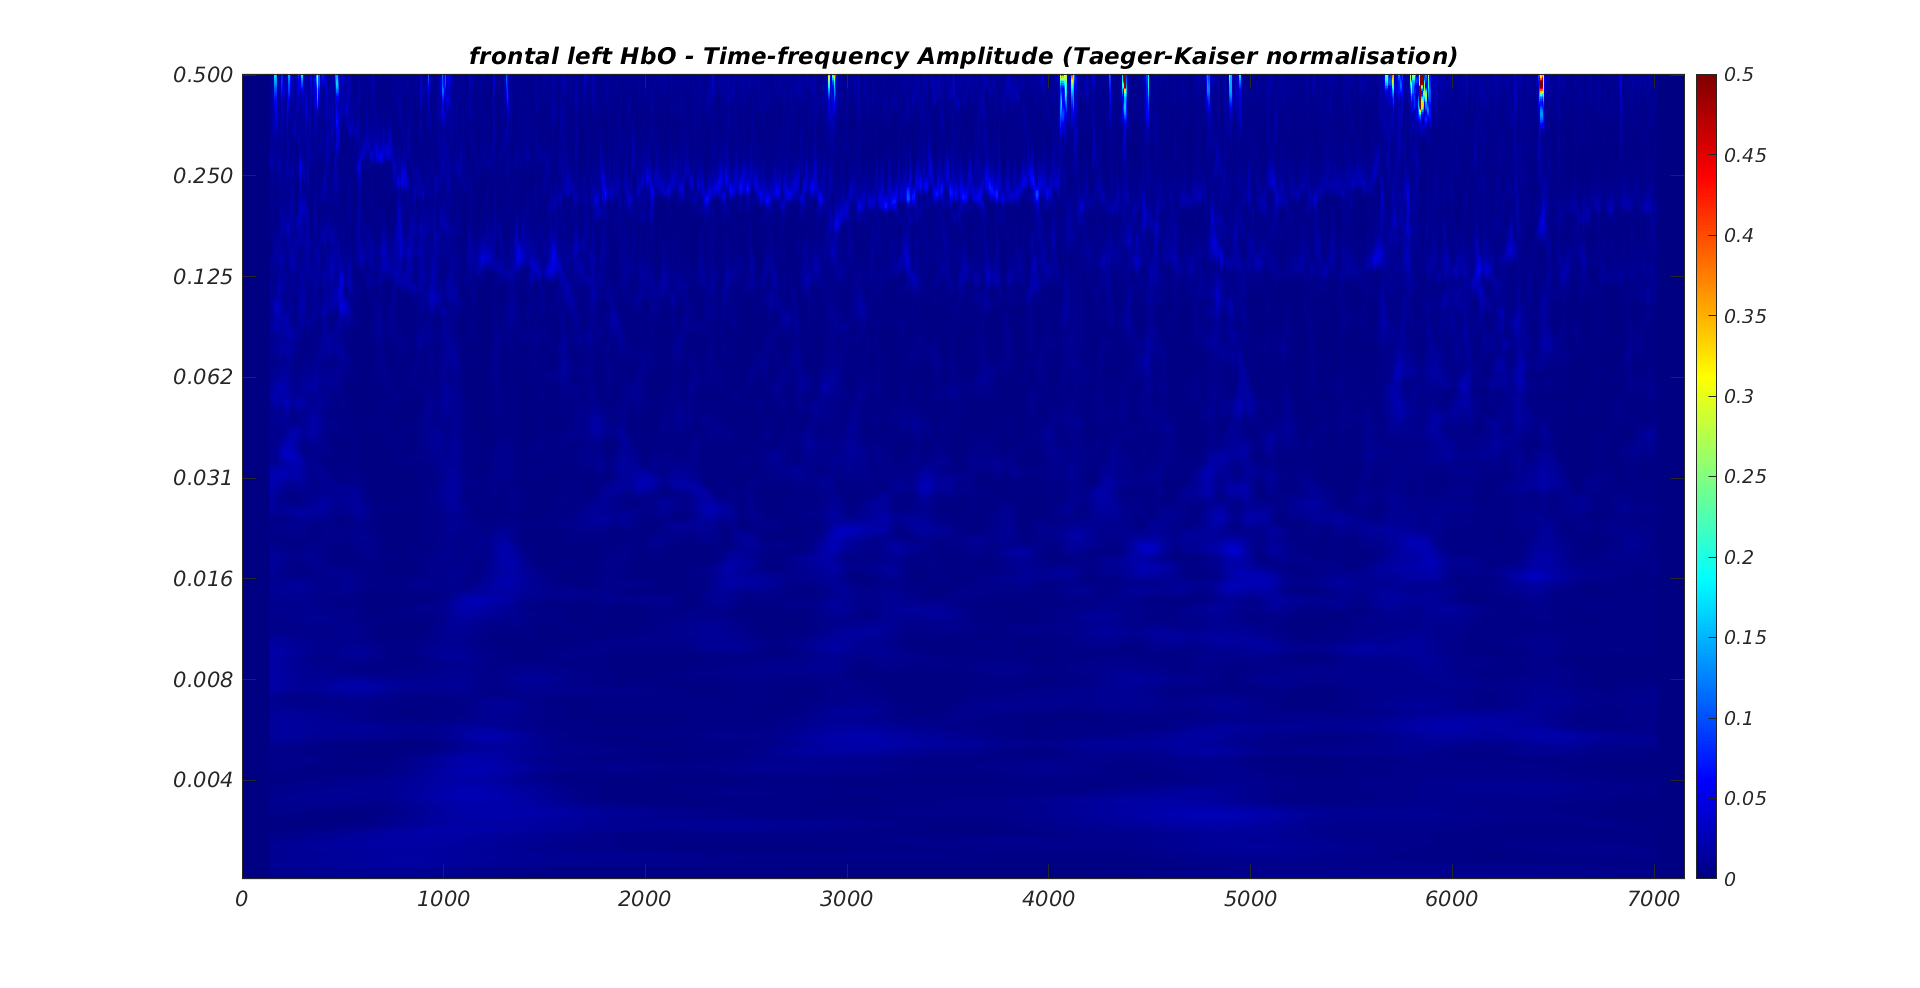
I am currently trying to perfom time-frequency analysis of the entire recording of EEG/NIRS data saved as raw/continuous data in Brainstorm.
I was able to update the process I have to estimate the time-frequency representation but I was wondering how could i save it in Brainstorm. Ideally, I would be able to visualize the signal and the TFR simultaneously (they have the same sampling rate).
I tried to execute Brainstorm's time-frequency process to have an example of how the data are organized but it seems it only works for epoched data and not continuous files.
What would you recommend? Also knowing that saving as mat file might be tricky as the TFR of long recording can be quite heavy and sometimes too large for mat file.
This goes down to the way raw files are handled. For most of the formats, when a segment of raw data is plotted only that data is read from the binary file and hold in memory. TF representations of raw data one of the future works. Tentatively, the TF transformation on the fly on the requested segment (similar to what happens with online frequency filters). Although this implies edge effects, the approach avoids enormous TF files.
As per doing it now, if RAM is not a limitation, you could import the entire recording, compute the TF on it, then the simultaneous plot is supported.
What I was trying to ask is, now in brainstorm, do you think it would be possible to load this time-frequency map as a continuous file so only loading specific time windows instead of the entire file.
As you said, I think computing on windows of the signal is not great because of the edge effect, but if we can compute the TF of the entire signal of one sensors, then we can save it and for display only load the time being displayed as for time-course.
What do you think?
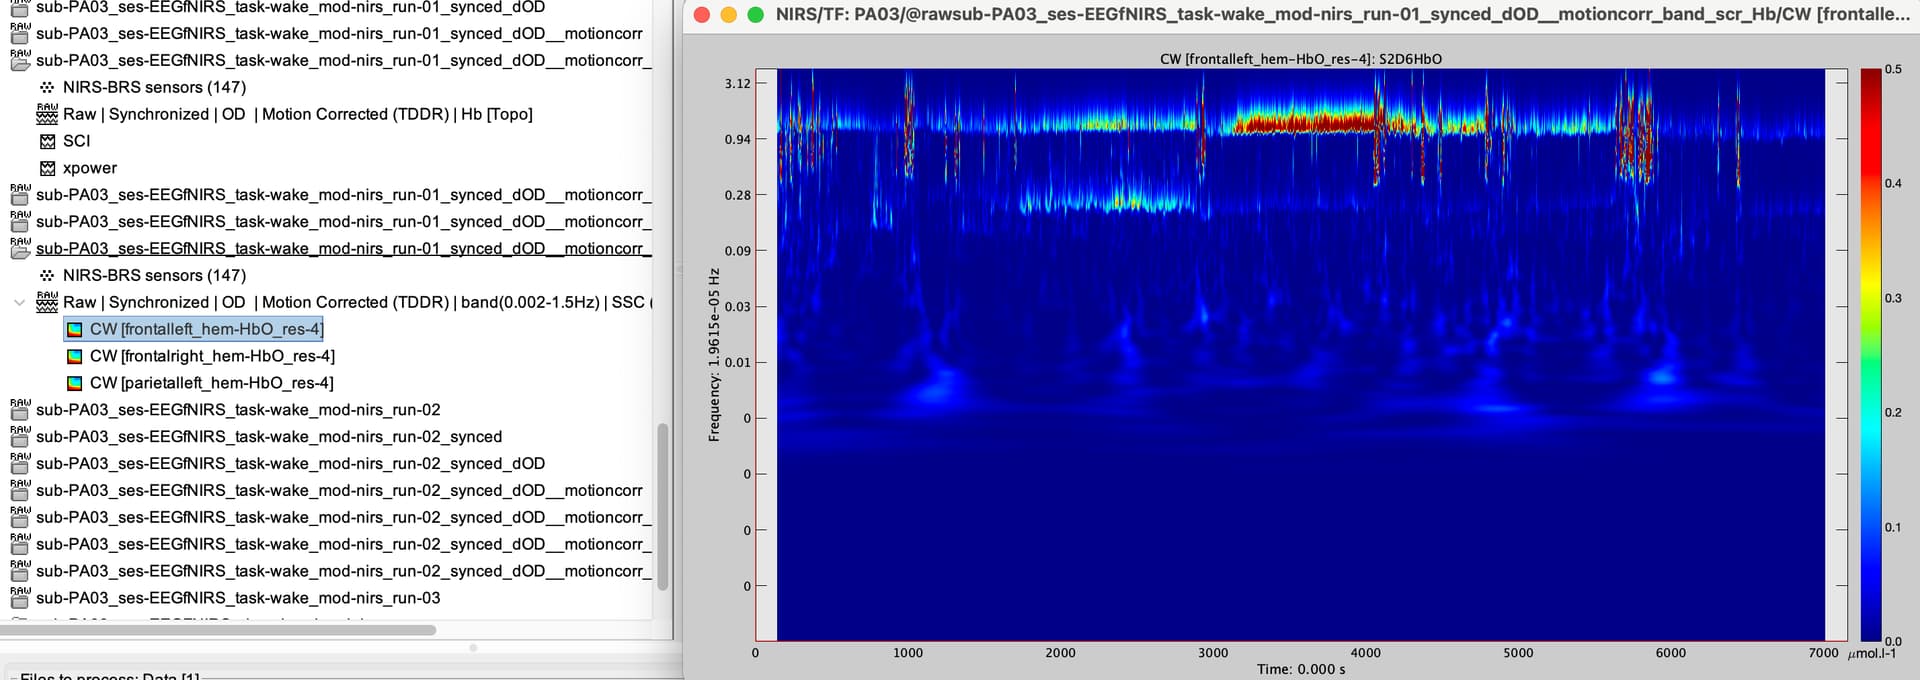
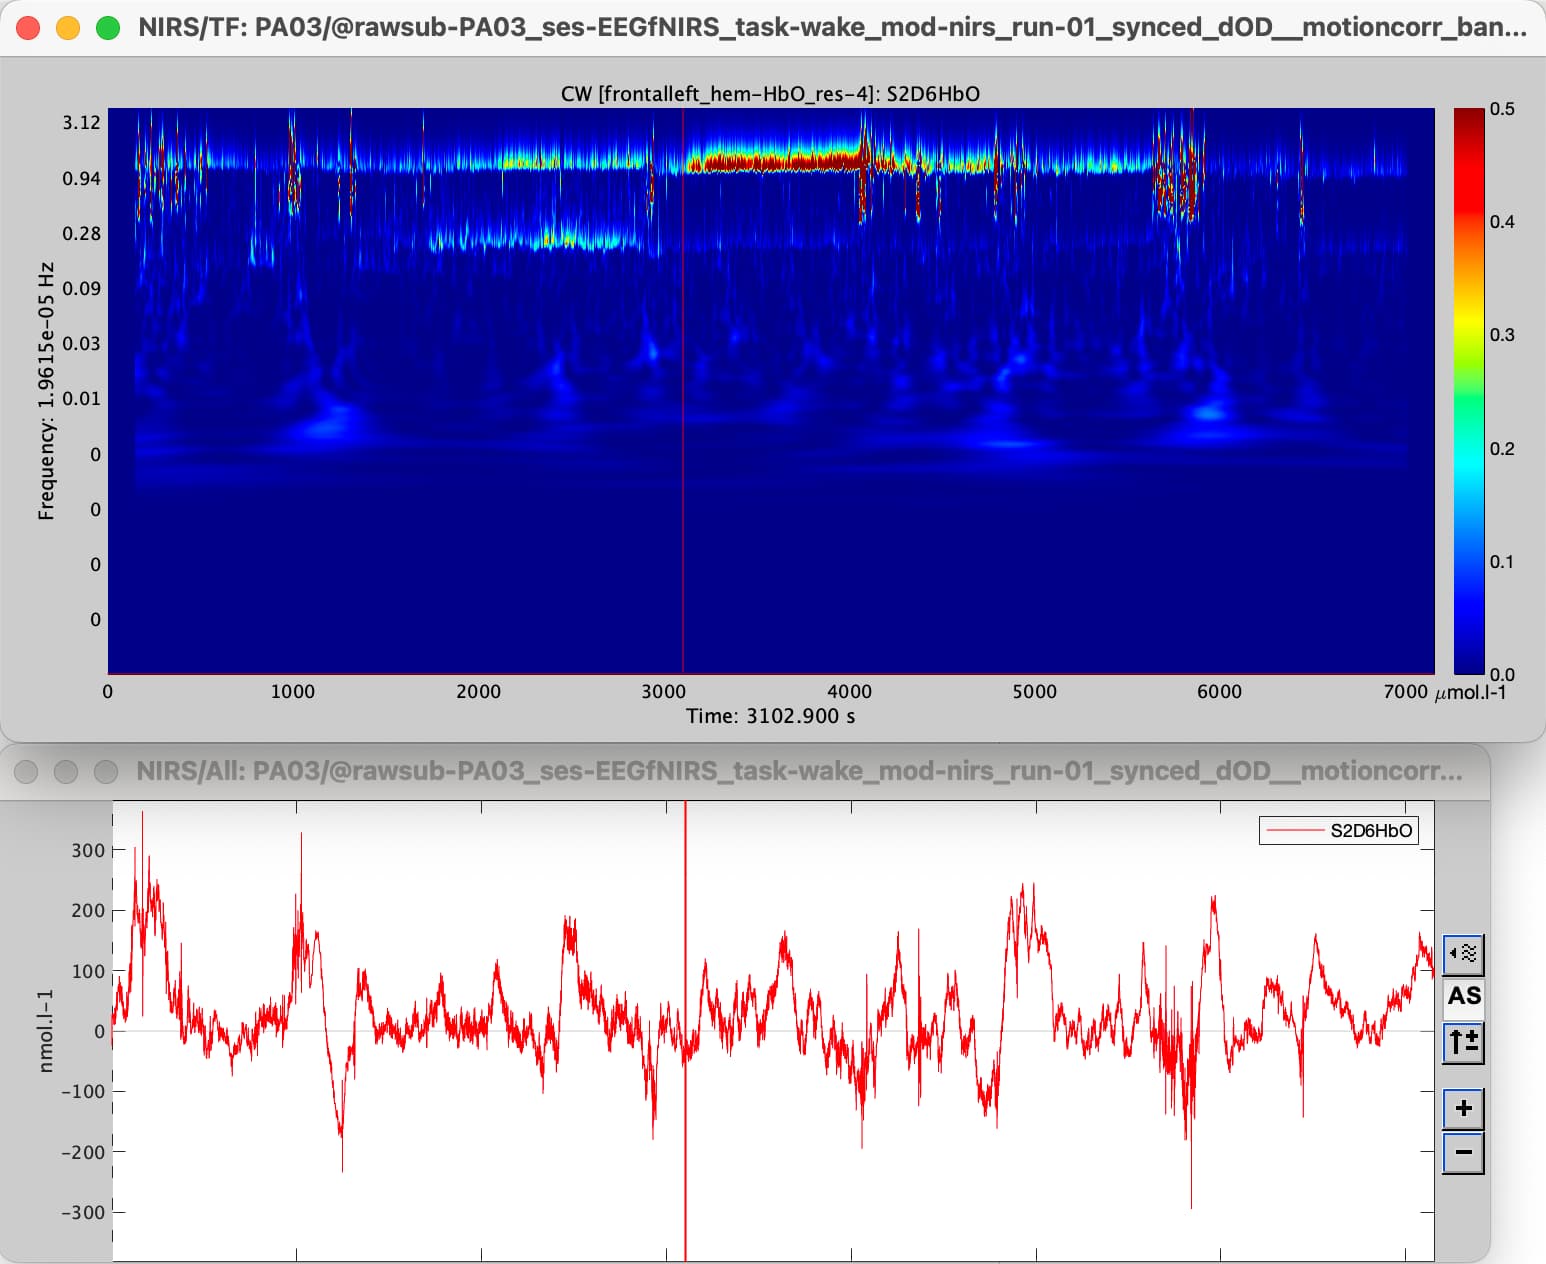
Also I am currently unable to view the time-series used to generate the tf map using right click > Recordings (one sensor):
Dot indexing is not supported for variables of this type.

Error in panel_record>UpdatePanel (line 925)
        FullTime = GlobalData.FullTimeWindow.Epochs(iEpoch).Time;

Error in panel_record>CurrentFigureChanged_Callback (line 773)
    UpdatePanel(hFig);

Error in panel_record (line 30)
eval(macro_method);

Error in bst_figures>SetCurrentFigure (line 1078)
            panel_record('CurrentFigureChanged_Callback', hFig);

Error in bst_figures (line 59)
eval(macro_method);

Error in view_timeseries (line 272)
bst_figures('SetCurrentFigure', hFig, '2D');

Error in figure_timeseries>DisplayDataSelectedChannels (line 2054)
    view_timeseries(DataFile, Modality, SelectedRows);

Error in figure_timeseries (line 41)
eval(macro_method);

Error in figure_timefreq>ShowTimeSeries (line 1771)
        figure_timeseries('DisplayDataSelectedChannels', iDS, RowName, Modality);

Error in figure_timefreq>@(h,ev)ShowTimeSeries(hFig) (line 763)
        jItem = gui_component('MenuItem', jPopup, [], 'Recordings (one sensor)', IconLoader.ICON_TS_DISPLAY, [], @(h,ev)ShowTimeSeries(hFig));
Sounds feasible. The best approach would be to save it in a binary format, so we can compute where to start to read.
Computing and storing all the TF decomposition for raw data is a big burden. Regarding the edge effects: two approach could work: (i) the user has to have in mind to set the time window longer than needed so the shown edge effects are not in the area of interest. (ii) It is possible to read extra data before and after the showed time segment and compute the FT here, so the effects will not show.
It doesnt seems like out_fwrite_bst is supporting time frequency data.
Any idea for this? is this because my TF map is linked to a raw recording ?
I am not sure I see how it's more difficult if we have a continuous recording or eppoched data. As long as we can have the entire time-frequency map for one channel fit in memory; then we are fine.
It won't be an issue of memory, as you point, only the displayed channel could be loaded. I'm more concern about first the computing time the TF map for the entire recording for all the channels; then the storage of such a file (e.g., the TF map for 40 frequencies for 50 channels, 5min, sampled at 500 Hz would lead to a file of ~5GB, if saved efficiently as complex double)
While I couldn't replicate with your process code, as there are missing files, I could replicate the error with a custom TF.
The issue is related on the fact that the raw data is not loaded. For the moment, there are two ways opening the recordings a you intend:
Open the recordings for the raw file, and set the window to the maximum length. Then plot the TF map, now the Recordings (one sensor) options should work.
Since the TF is computed for the entire recording. You could import the entire raw file, compute the TF map, then the Recordings (one sensor) options should work (even without the recordings plotted)
thx. Also, it is kind of defeating the point of having the data imported into Brainstorm as continuous recording instead of imported epoche. It would mainly create a mess in the database.