Dear all,
I am performing time-frequency analysis using wavelets on a set of epoched data, ranging from -1 sec to +1 sec.
For visualization purposes, I am looking for a way to plot the results of my TF analysis (ERSP) using a shorter epoch length. Specifically, I would like to plot using a shorter baseline [-0.5 0], in order to avoid that high values due to edge effects at the very beginning of the epoch cause a rescaling of the whole plot, making all the activity looking flat (or at least very small).
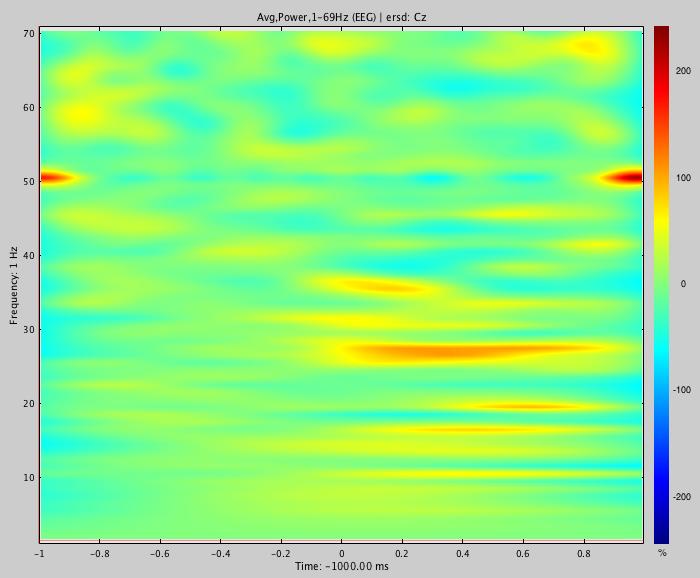
In attachment you can find an example of the plot that I am getting now, in which you see the rescaling problem due to the edge effect at the beginning of the epoch around 50 Hz.
Thanks for any help,
Antonio