Hello.
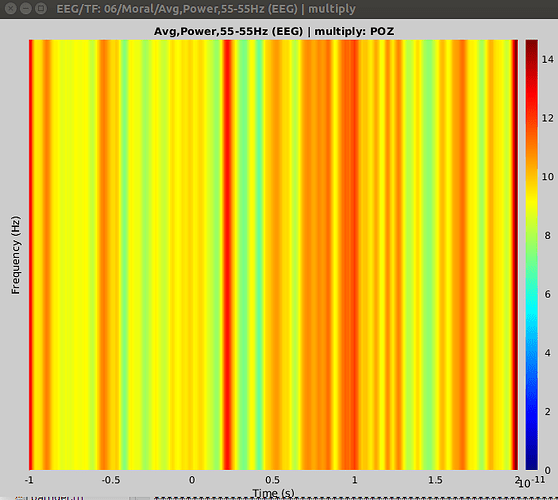
I ran a time-frequency analysis based on tutorial 12. This is epoched data, but I am looking at the whole brain, not scouts. I chose to look at all channels and I got this result (attached). Where is my mistake? Is it not possible to do a whole brain analysis? Also, I did the same for phase amplitude coupling (whole brain, not a scout), and I wasn’t able to smooth the image. Is this not possible?
Thank you.
Annemarie
Hi Anne-Marie,
What is wrong with the screen capture you submitted? It represents the evolution of the power at 30Hz for each sensor.
There are many options available for displaying and computing time-frequency files. Let us know if you need help with specific options.
Whole brain analysis is available in the time-frequency process, you just have to disable the option “Use scouts”.
However this is usually not recommended: it is awfully slow to compute, it produces gigantic files that are difficult to explore. Recommended approaches are instead to focus on one parameter at a time: either by identifying a few regions of interest first, or by computing the value for one frequency band everywhere (if possible larger than “30Hz-30Hz”).
Francois
PS: Smoothing the full-brain PAC maps is not available at this time.
Thanks Francois. My supervisory wants to look at the change in power spectrum as a result of an event (Event Related Spectral Perturbation), but he wants to do this on the whole brain. I’ll see if I can narrow it down.
Annemarie
Hello again. I want to do an event-related spectral perturbation (time-frequency) at specific electrode sites (ex: Fz, FCz, Cz, etc) in the electrode space, not the source space. Since I don’t have structural MRI’s or head points for each participant, I don’t want to do the analysis in source space. I understand that I can’t do time-frequency analysis using clusters, so can I do this analysis at the electrode level without going into the source space?
Thanks.
Annemarie
You can do you analysis in sensor space for all the sensors, then average across a few electrodes with the process “Extract values” for instance. Or run the TF analysis on only the sensors of interest, then average the TF power with the process “Average frequency bands”.
Just do not average your signals before you run the TF decomposition, you may lose a lot of information.
You have many ways to do this without going to sources space.
Hello again. I have been trying to do time-frequency again in the past few days, and have run into the same problem. I followed the EEG and Epilepsy tutorial, time-frequency section, exactly and got this result:
What am I doing wrong? I know you previously said that this represents the 30Hz power of the sensors, but how do I do it properly? I am trying to run an event related spectral perturbation for my epoched data, and want to compare the changes between conditions and stimuli within a condition. Also, when I figure out how to do this properly, how can I extract the values in order to run the statistics? Would exporting the files to Matlab and extracting the values there be the best option? I don't think we can run t-test stats in Brainstorm for time-frequency yet.
Thank you very much for your help.
Annemarie
Hello,
Looking at the title of the figure, this represents the power at 55Hz, not 30Hz.
Is there anything wrong with it?
About the statistics, as I mention in the other thread you started, I suggest you start by reading the following tutorials:
http://neuroimage.usc.edu/brainstorm/Tutorials/Difference
http://neuroimage.usc.edu/brainstorm/Tutorials/Statistics
http://neuroimage.usc.edu/brainstorm/Tutorials/Workflows
http://neuroimage.usc.edu/brainstorm/Tutorials/VisualGroup
Francois
