Hello!
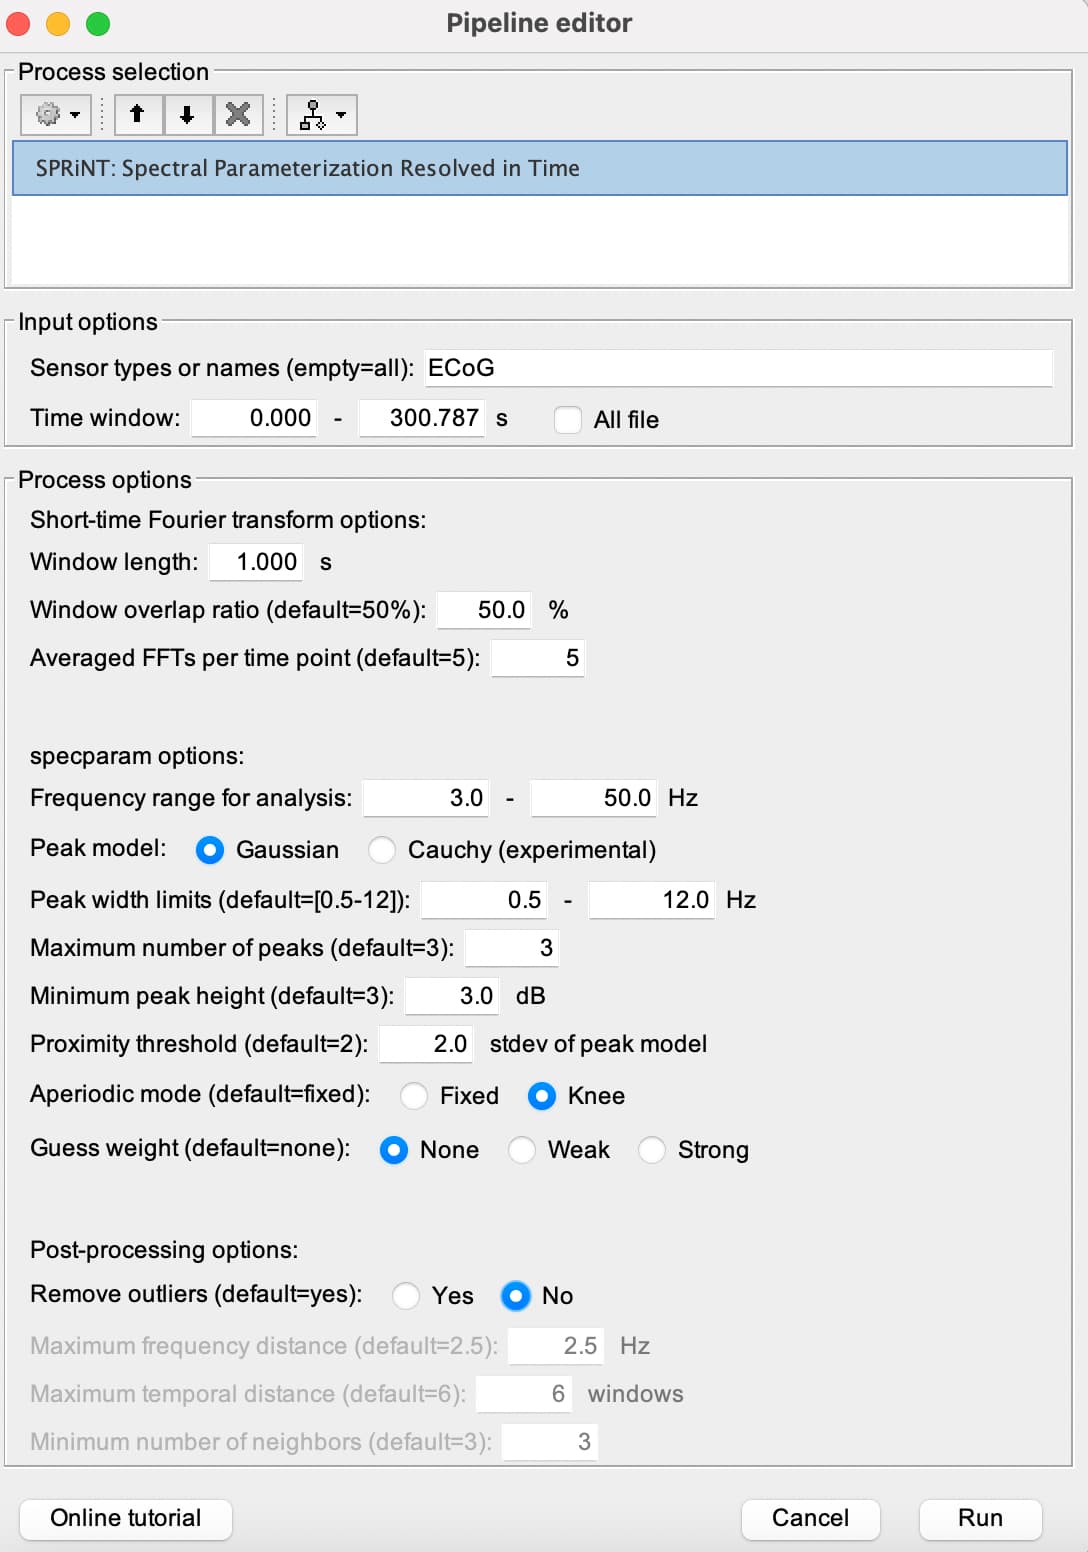
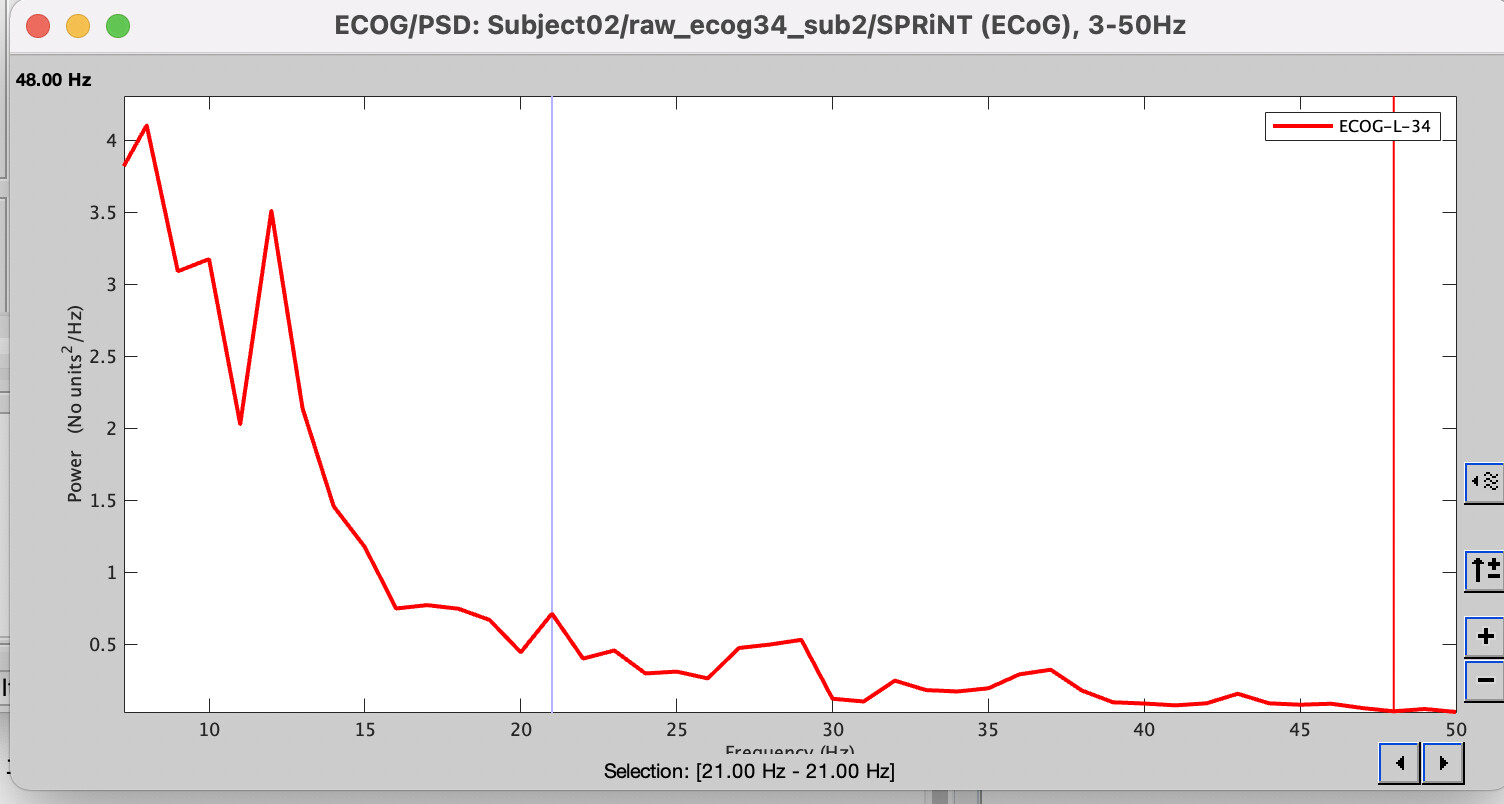
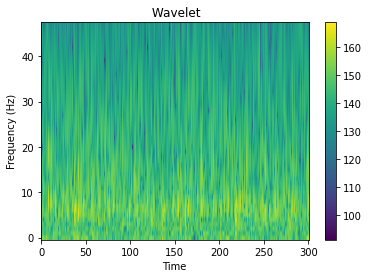
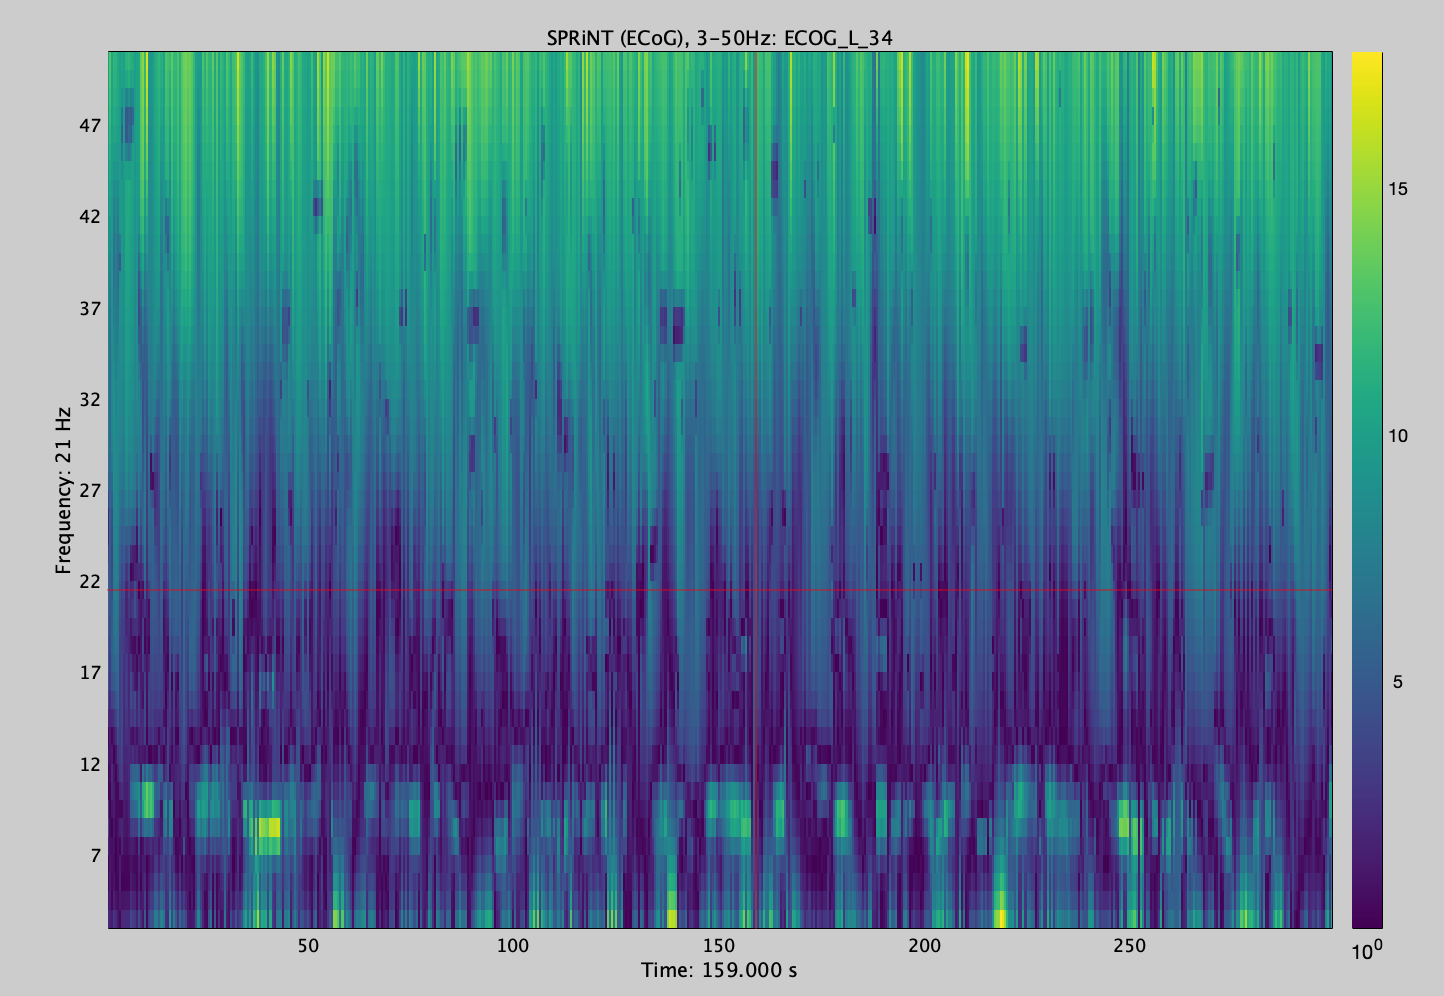
I have recently started using Brainstorm in order to explore the newly implemented SPRiNT tool. When I run it on my data (1 ECoG channel) I see a strange tfr plot, namely, it has very high power values in the higher end of the calculated frequency band (in this case 40-50 Hz) but the power spectrum doesn't show that. Also, I have tfr plots calculated by Morlet wavelet function in MNE, which also looks different and doesn't show these high-power regions on top of the plot. Do you have any idea of what these could be?
I attach the screenshots of the parameters for SPRiNT (all default), the resulting tfr in brainstorm, the power spectrum and the tfr-plot from MNE for the corresponding data set. (all pre-processing is exactly the same, namely resampling at 600Hz and high pass filter at 2Hz)
I will appreciate any comments or help on this! Thanks!
0GQFdSIi6mVYYP5UjS093BIaT.jpeg)
PS
I can only upload one screenshot since I am a new user, how can I go around this?