Hello,
I just computed some timefrequency analysis on the cortex using SPRINT after MNE.
and I was wondering if there would be a way to visualize the power spectrum on the surface ?
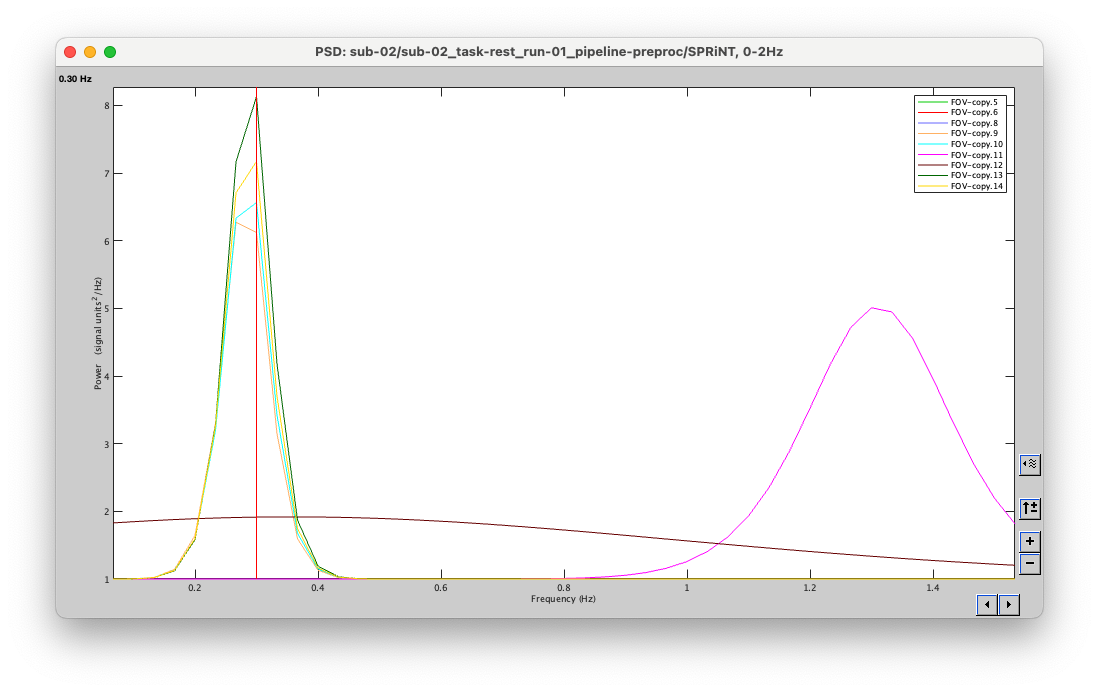
in this case, I would like to see where the peak at 0.2Hz is located
Thanks a lot
Edouard