I am working on SEEG data for localizing sources. As a first step, I want to visualize and confirm the location of SEEG electrodes on MRI. I have MRI and coordinates of each SEEG electrodes. I tried to import channel file which contanins x,y,z MNI coordinate and when I display the sensor, the results are plotted on some ambiguous space, not on the MRI. Could you help me how to plot sensors on MRI?
Those tools for SEEG and ECOG are under development, and some interface elements are still missing.
I'm sorry there is no easy way to display or place the electrodes on the MRI viewer yet. These essential elements will be most likely developed over the summer.
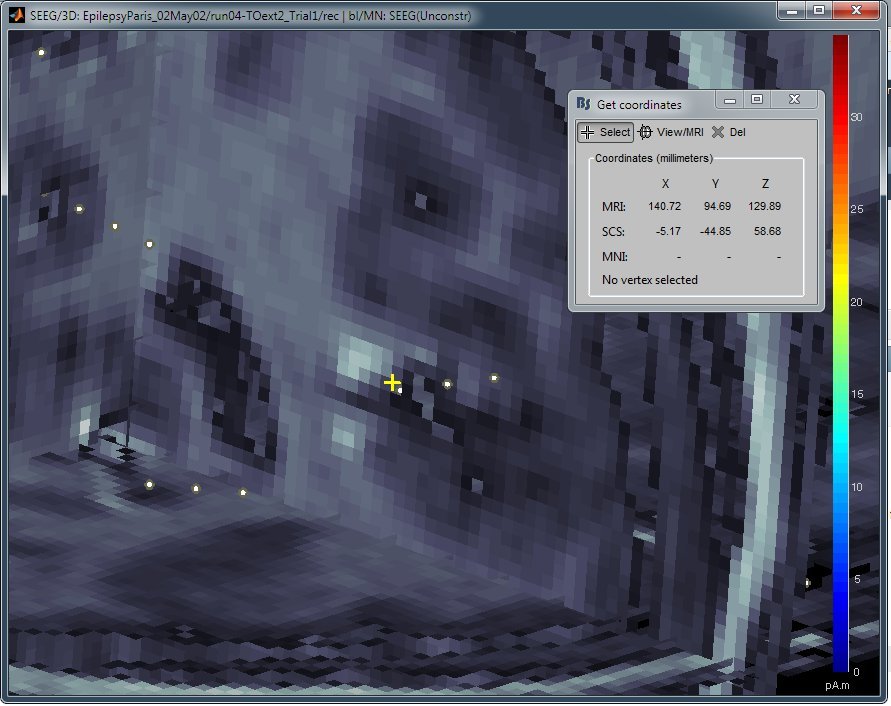
The closest thing you can get now is the 3 orthogonal MRI cuts in a 3D figure, together with the electrodes:
Calculate sources for your model (volume source model)
Display them, maximize the window and bring the amplitude slider to 100% so that you only see the MRI
Add the electrodes to this 3D figure: right-click > Channels > Display sensors (or Control+E)
You can move the MRI slices with right-click+move the mouse, or with the "reset" sliders in the Surface tab
If you need to know the coordinates of a point on the MRI slices for this figure, you can right-click on the figure > Get coordinates, and then pick a point on the slices
(see attached figure)
I’m sorry I don’t know what the bioimage suite is, or what are the files are are manipulated in that software.
If you can get the (x,y,z) coordinates of your electrodes in a referential compatible with Brainstorm (either the MRI or the SCS/CTF coordinate system), or if you have the nasion/left ear/right ear position: yes it is possible.
I was curious if there was an updated tutorial or go by for labelling seeg? With 20 or so 10 contact depths, using the 3 slice method seems very difficult. I have been using bioimagesuite to label these, and it can make a version of a text file, but it is not importable. I am happy to send a text file, raw text file (*.mgrid format but its really just text) and the vtk it makes if that would help. If there is a way in brainstorm or brainsuite to do this in 3D using the thresholded CT or MRI, I would love that.
If you have your contact positions in plain text, you should be able to import them into Brainstorm.
Right-click on the channel file > Add EEG positions > Import from file > Select a corresponding ASCII format.
FYI: We improved significantly the tools available in Brainstorm for processing and visualizing SEEG and ECOG data, including new options for volume coregistration. They are now documented in a new tutorial: http://neuroimage.usc.edu/brainstorm/Tutorials/Epileptogenicity
Hello!
I have been using brainstorm for seeg recordings and love the visualization for individual elextrodes. However, I was wondering if I could also display single electrodes without manually typing in their location. I have a list of 200 electrode positions and I want to visualize their localization.
Is there a way without typing in the whole electrodes?
Thank you.
Best wishes,
Johannes
Of course, you can load a text file with the list of contact locations.
If you have imported SEEG recordings into your database: right-click on the channel file > Add EEG positions > Import from file.
If this is just for the display of the electrodes: right-click on a new folder > Import channel file.
Then you need to select a file format that matches your file. If you simply have a simple list (eg. Name,X,Y,Z), use one of the entries "EEG: ASCII: ...".
The registration with the MRI/CT in Brainstorm can be tricky...
If your SEEG coordinates are registered with the MRI volume you used as the first anatomy file of your subject, use one of the "XYZ_World" entries.
If they are in MNI coordinates, uste "XYZ_MNI".
Otherwise, you need to include the three fiducials NAS/LPA/RPA in the coordinates file, in the same referencial as the SEEG electrodes, and defined exactly as in the Brainstorm MRI Viewer.
If you have difficulties with this, please describe what kind of data you have in input (contact position in a text file? please share the file) and what kind of display or behavior you'd like to have in Brainstorm.
Screen captures would help (ATL+PrintScreen, then CTRL+V directly in the forum editor).
Thanks
thank you very much for your answer. That sounds awefully simple and in the end it was.
It turned out that I had the wrong format. I kept getting "BST> Warning: No channel information was read from the file." After stripping the file of the column headings it worked just fine!
Thank you very much for your help!
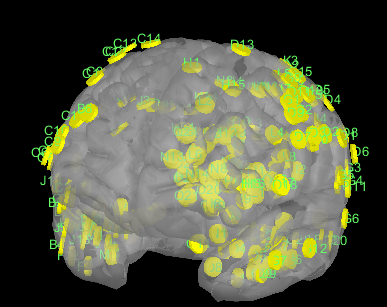
Now get a nice picture.
However, I was wondering if there is a way to change the platelet style to a shere or dotlike display of the electrodes? Preferably, for some electrodes I would like to keep some of the electrodes the way they are now and only change the subset which were depth electrodes.