UNDER CONSTRUCTION
ECoG/sEEG tutorial
Authors: Francois Tadel, Marcel Heers.
This tutorial introduces some concepts that are specific to the management of ECoG/sEEG recordings in the Brainstorm environment. It is based on a clinical case from the Epilepsy Center at the University Hospital of Freiburg, Germany.
Note that the operations used here are not detailed, the goal of this tutorial is not to introduce Brainstorm to new users. For in-depth explanations of the interface and theoretical foundations, please refer to the introduction tutorials.
NOT FOR CLINICAL USE:
The performance characteristics of the methods and software implentation presented in this tutorial have not been certified as medical devices and should be used for research purposes only.
Contents
Dataset description
License
This tutorial dataset (EEG and MRI data) remains proprietary of the Epilepsy Centre, University Hospital Freiburg, Germany. Its use and transfer outside the Brainstorm tutorial, e.g. for research purposes, is prohibited without written consent from the Epilepsy Centre in Freiburg. For questions please contact A. Schulze-Bonhage, MD, PhD: andreas.schulze-bonhage@uniklinik-freiburg.de
Acknowledgements
We would like to thank the patient for providing his dataset for this tutorial, the clinical team of the Epilepsy Center Freiburg for the aquisition of the dataset and Verena Schulte for her help in preparing the dataset for the tutorial.
Clinical description
The patient is a 38yr male who suffered from drug resistant focal epilepsy since his 13th year of age with two different types of focal aware seizures that rarely evolved at nighttime to bilateral tonic-clonic seizures. Seizure type I consisted of daily aware focal seizures with myoclonic or clonic jerks of the right leg that occasionally led to falls. Type II consisted of formication paraesthesias that propagated from the right calf to the hip region. It could be provoked by stress or hot weather and occurred 2-3 times a week. In the presurgical 3T epilepsy MRI no structural abnormality was detected.
Implantation scheme
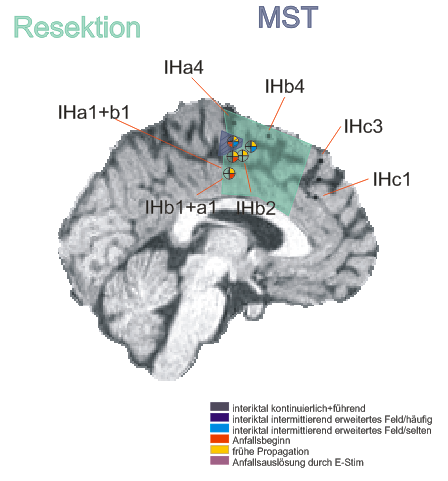
After non-invasive telemetry intracranial recordings were performed. It was decided to implant a 64 channels Ad-Tech subdural grid with 8x8 contacts (stainless steel, 10mm between centers of contacts, 2.3mm diameter exposure) over the left fronto-centro-parietal convexity covering the central region. The most inferior lateral row of contacts of the grid electrode is named A and the row of contacts next to the midline is named H. The contacts of the grid have numbers between 1-8 with the most posterior contacts of each row starting with number 1.
Additionally, 3 interhemispheric Ad-Tech strip electrodes with 4 contacts each named from posterior to anterior with IHA being the most posterior followed by IHB and IHC being the most anterior strip electrode. The numbering convention is that the deepest contact is named contact "1": and the most superficial contact of each electrode has the highest number.
In addition, 2 Ad-Tech sEEG electrodes were implanted in the right parietal lobe facing to the insula (TA & TB, distance between centers of contacts: 10mm, diameter: 0.86mm). Both sEEG electrodes have 10 electrode contacts each. The contacts are counted from anterior to posterior starting with contact number 1 at the tip of each sEEG electrode.
The figure illustrating the electrode positions was created as reported by Kovalev et al. 2005.
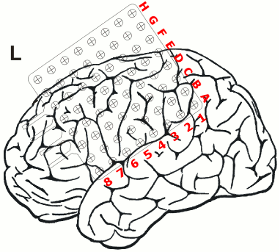
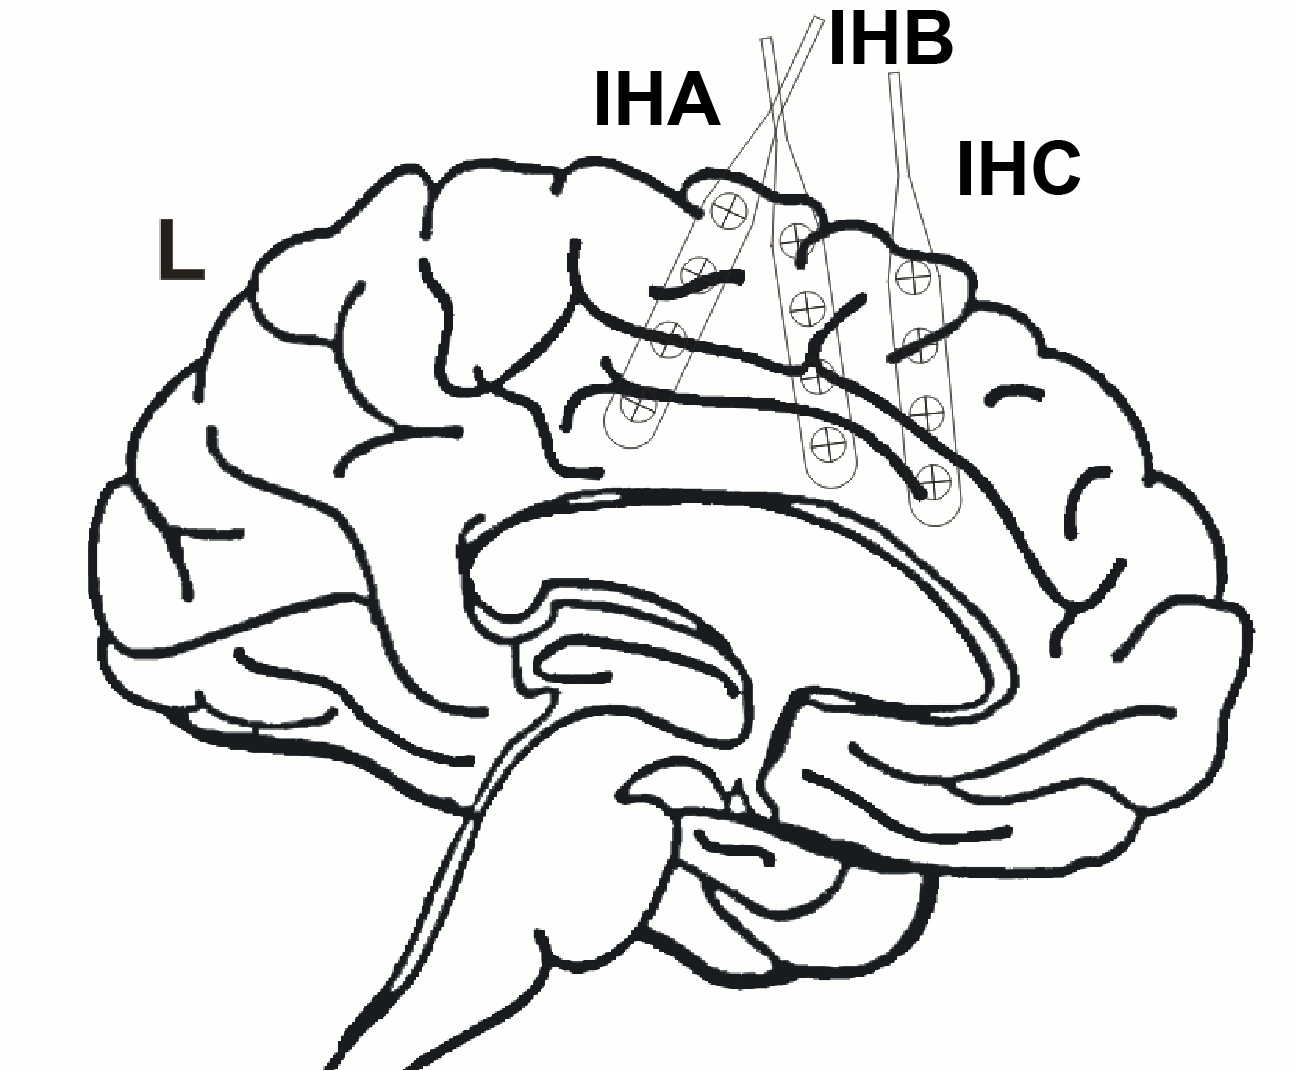
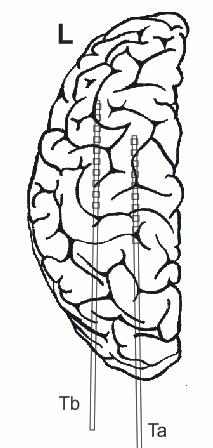
Recordings
The EEG data distributed here was recorded at 1024Hz, using a Neurofile NT digital video-EEG system with 128 channels and a 16-bit A/D converter. The signal was filtered in the recording system with a high-pass filter with a time constant of 1 second (cut-off frequency ~ 0.16Hz) and a low-pass filter with a cut-off frequency of 344 Hz.
Clinical evaluation
Interictal findings:
Repetitive sharp waves and interictal fast epileptic activity in the gamma frequency band (FEA; for advanced spectral analysis of FEA see also (Heers et al., 2018)) was almost continuously recorded in contacts G5-6 extending towards H5-6 or F5-6 and less frequently expanding to H3-4 & 7, IHA1-3, IHB1-3
Ictal findings:
- Seizure onset pattern: Repetitive gamma bursts interrupted by sharp slow waves in G5-6, H3-4 and IHA1-3
- Semiology: Myoclonic and clonic movements of the right leg intermingled with not clearly localizing habitual formication paraesthesias of the right leg
Electrical stimulation:
- Stimulation of contacts G5: habitual myoclonic seizures
- Stimulation of contact G6: habitual paraesthesias of the right leg
- Detailed function mapping was performed, which is not reported in detail here.
Resection, histopathology and postsurgical outcome:
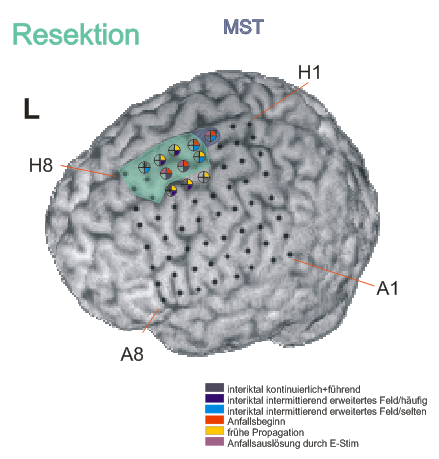
- Resection of the posterior part of the superior frontal gyrus anterior of the precentral gyrus including the cingulate gyrus was performed. Because there was overlap between the primary motor cortex (confirmed by functional mapping) at contact H3 position H3, which was also involved in the seizure onset zone this brain area was spared and only multiple subpial transections were added here.
- Histological examination revealed focal cortical dysplasia type Ib (Palmini et al., 2004). After surgery the patient developed a severe SMA syndrome with diminished activity, problems in movement initiation and speech production from which he recovered completely after rehabilitation.
- After surgery the patient remained completely seizure free (Engel IA outcome, follow up 10 years).
References
Heers M, Helias M, Hedrich T, Dümpelmann M, Schulze-Bonhage A, Ball T (2018): Spectral bandwidth of interictal fast epileptic activity characterizes the seizure onset zone. NeuroImage Clin 17.
Kovalev D, Spreer J, Honegger J, Zentner J, Schulze‐Bonhage A, Huppertz HJ (2005): Rapid and fully automated visualization of subdural electrodes in the presurgical evaluation of epilepsy patients. AJNR Am J Neuroradiol 26:1078–1083.
Palmini A, Najm I, Avanzini G, Babb T, Guerrini R, Foldvary-Schaefer N, Jackson G, Luders HO, Prayson R, Spreafico R, Vinters H V (2004): Terminology and classification of the cortical dysplasias. Neurology 62:S2-8.
Files
The dataset we distribute with this tutorial follows the Brain Imaging Data Structure (BIDS) standard for neuroimaging data organization. This specification was first established for MRI and fMRI (Gorgolewski, 2016) and then refined with an extension dedicated to iEEG (Holdgraf, 2019). The files that will be imported in this tutorial are the following:
sample_ecog/
derivatives/: Everything that cannot be considered as raw data
freesurfer/sub-ecog01_ses-preimp/: Result of the FreeSurfer 7.1.1 segmentation for subject ecog01 (T1 pre-implantation)
sub-ecog01/: Raw data for subject ecog01
ses-preimp/: Imaging exams performed before the implantation of the ECoG/sEEG.
anat/sub-ecog01_ses-preimp_T1w.nii.gz: T1-weighted MRI pre-implantation
ses-postimp/: Exams performed with the sEEG/ECoG devices implanted.
anat/sub-ecog01_ses-postimp_T1w.nii.gz: T1-weighted MRI post-implantation
ieeg/..._task-seizure_run-01_ieeg.eeg: 1 hour ECoG+sEEG recordings with 3 seizures (saved using the BrainVision file format, with the header files .vhdr and .vmrk)
ieeg/..._space-IXI549Space_electrodes.tsv: Position of the contacts in MNI space (SPM12 Segment non-linear normalization)
ieeg/..._space-other_electrodes.tsv: Position of the contacts in world coordinates
All the anatomical images have been de-identified with mri_deface from FreeSurfer 6.
Download and installation
Requirements: You have already followed all the introduction tutorials and you have a working copy of Brainstorm installed on your computer.
SPM: If you are running Brainstorm from the Matlab environment, for the coregistration between pre- and post-implantation MRI volumes, you need to have the SPM12 toolbox installed on your computer and added to your Matlab path.
No need to worry about SPM if you are using the stand-alone compiled version of Brainstorm: all the needed SPM scripts have been compiled and included in this executable.Go to the Download page of this website, and download the file: sample_ecog.zip
- Unzip it in a folder that is not in any of the Brainstorm folders (program folder or database folder)
- Start Brainstorm (Matlab scripts or stand-alone version).
Select the menu File > Create new protocol. Name it "TutorialEcog" and select the options:
"No, use individual anatomy",
"No, use one channel file per acquisition run".
Import the anatomy
The entire dataset, anatomy and recordings, is organized following the BIDS specification. It could be loaded automatically with the menu Import BIDS dataset, as illustrated in the Resting/OMEGA tutorial. However, in this tutorial we will detail the step-by-step instructions to load the anatomy and ECoG recordings manually.
Pre-implantation MRI
The pre-implantation T1 MRI is available as a .nii file (sample_ecog/sub-ecog01/ses-postimp/anat). This volume was processed with FreeSurfer 6, and the output segmentation is available in the derivatives folder (sample_ecog/derivatives/freesurfer/sub-ecog01/ses-preimp). We don't need to import both to the Brainstorm database: in order to minimize the number of operations, we will import only the FreeSurfer folder.
- Switch to the "anatomy" view of the protocol.
Right-click on the TutorialEcog folder > New subject > ecog01
- Keep the default options you set for the protocol
Right-click on the subject node > Import anatomy folder:
Set the file format: "FreeSurfer folder"
Select the folder: sample_ecog/derivatives/freesurfer/sub-ecog01/ses-preimp
- Number of vertices of the cortex surface: 15000 (default value)
In the MRI Viewer, click on "Click here to compute MNI transformation". It computes an affine transformation between the subject space and the MNI ICBM152 space, and sets default positions for all the anatomical landmarks.
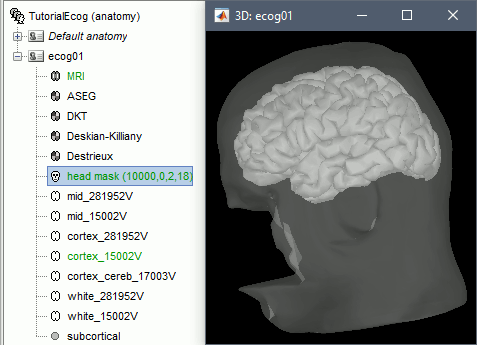
Click on [Save] to continue with the importation of the anatomy. At the end, make sure the file "cortex_15000V" is selected (downsampled pial surface, that will be used for the source estimation). If it is not, double-click to select it as the default cortex surface.
Post-implantation MRI
- The pre-implantation MRI will be used as the anatomical reference for this subject. We will now import a second scan done after the sEEG/ECoG implantation, on which we can see the recording contacts. In this dataset, the post-implantation volume is another T1 MRI scan (contacts hyposignal appear in black), but it is more commonly a CT scan (contacts hypersignal appear in white).
Right-click on the subject node > Import MRI:
Select: sample_ecog/sub-ecog01/ses-postimp/anat/sub-ecog01_ses-postimp_T1w.nii.gzDo you want to apply the transformation to the MRI file? YES
This will reorient the MRI in Brainstorm's standard orientation, so you can see the coronal/sagittal/axial views correctly oriented.How to register the new volume? SPM
For more information about these options, see the section Volume coregistration. Note that you need to have the SPM12 toolbox installed on your computer and added to your Matlab path for using this registration method.Reslice the volume? NO
This operation rewrites the volume with the orientation and resolution of the pre-implantation MRI, so that the two volumes can be overlaid in the MRI viewer. In this tutorial, we are going to place the ECoG/sEEG contacts manually on this post-implantation volume. For a better image quality, it is better to do it using the non-resliced volume. We do want the resliced volume, at least to check that pre- and post-implantation MRI volumes are correctly registered, but we can compute the resliced volume separately.Right-click on the post-implantation volume > Register with default MRI > Reslice / vox2ras.
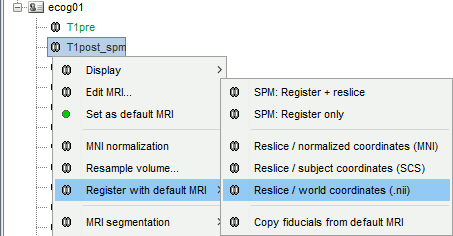
Right-click on the resliced post-implantation volume >
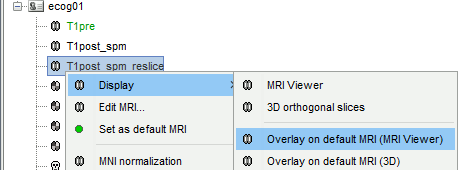
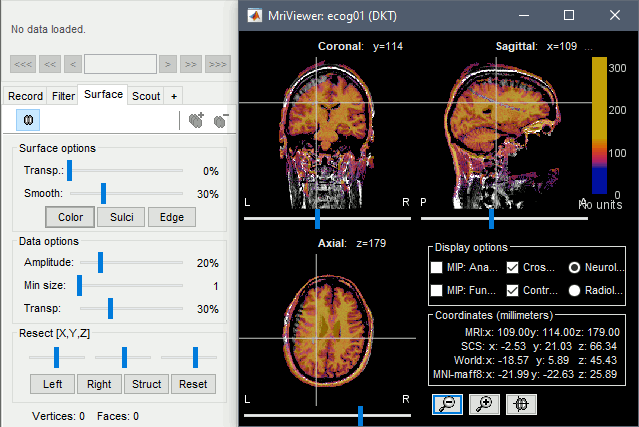
The MRI viewer opens, showing the post-implantation volume as a colored layer on top of the previous volume. Adjust the transparency and amplitude threshold of this layer in the section "Data options" of the Surface tab, adjust its colormap with the popup menu of the figure. Use this display to validate that the coregistration of the two volume is correct, all the parts of the head must align well.
Generate skull surfaces
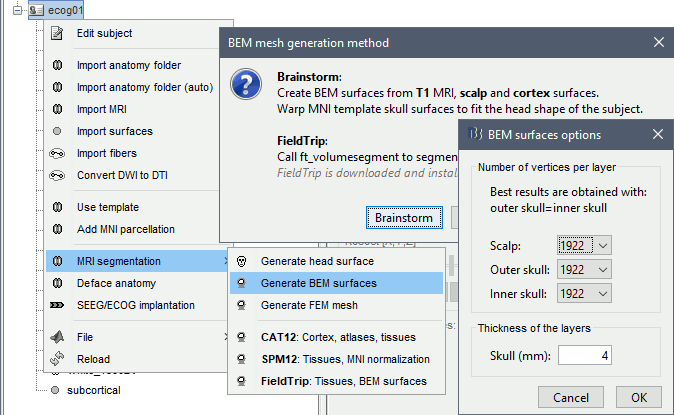
Right-click on the subject folder > Generate BEM surfaces. Keep the default options.
When the computation is done, double-click on the the original head surface ("head mask") to select it as the default instead of the new BEM version, which is not estimated well because the volume was defaced.
Access the recordings
Link the recordings
- Switch to the "functional data" view (2nd button, on top of the database explorer).
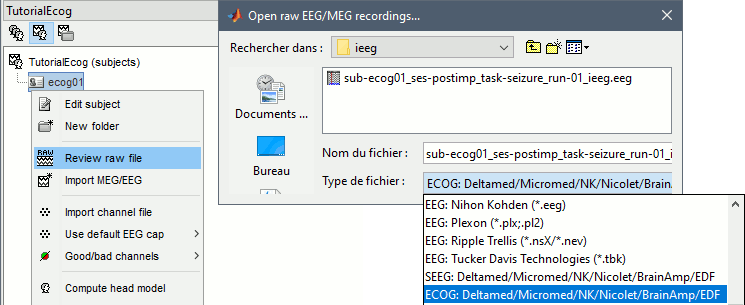
Right-click on the subject folder > Review raw file:
Select the file format: "ECOG: Deltamed/Micromed/..."
Select the recordings: sample_ecog/sub-ecog01/ses-postimp/ieeg/..._ieeg.eeg
The new "Link to raw file" entry lets you access directly the contents of the original file. The menu "Review raw file" does not actually copy any data to the database. More information.
Edit the channel types
At the previous step, we explicitly defined that we were importing ECoG recordings. However, this file contains both sEEG and ECoG recordings, therefore we need to modify manually the type of some channels.
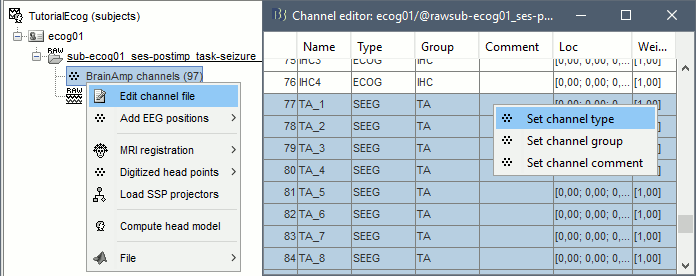
Right-click on the channel file > Edit channel file.
Select all the TA and TB channels, right-click > Set channel type: enter SEEG.
Edit the contacts positions
For 3D mapping and to generate epileptogenicity maps, we need accurate 3D positions for the contacts of the grids and depth electrodes. Placing the contacts requires a good understanding of the implantation scheme reported by the neurosurgeon, and some skills in reading MRI scans. This tutorial will now explain how to do this manual marking with the MRI Viewer from the post-implantation MRI, which shows clear hyposignal artifacts around the ECoG and sEEG contacts. We prefer using the non-resliced volume because it offers a clearer view of these artifacts.
If you have no interest in this or if you want to skip faster to the analysis of the signals, you can load the 3D positions from the BIDS dataset: right-click on the channel file > Add EEG positions > Import from file, select format "EEG: BIDS electrodes.tsv, subject space mm" and file sample_ecog/sub-ecog01/ses-postimp/ieeg/sub-ecog01_ses-postimp_space-other_electrodes.tsv, use transformation=Yes.
ECoG grid: G
Right-click on the channel file > MRI registration > Edit (MRI Viewer: sub-ecog01_ses-postimp_T1w.nii_vox2ras_spm).
Adjust the brightness and contrast of the colormap in order to see the contacts artifacts correctly: right-click on the figure and move your mouse up/down, or left-click on the colormap and move your mouse up/down (brightness) or left/right (contrast), or right-click on the figure > Colormap:Anatomy.
For help with all the options iEEG tab, refer to the Epileptogenicity tutorial.
Related tutorial: Edit implantation without recordings.In the iEEG tab, select "G", and select the information we know about this grid:
Type: ECoG
Number of contacts: 8 8 (8x8 grid, for a total of 64 contacts)
Contact spacing: 10 mm
Contact height: 1 mm
(the grid is thinner, but giving it some thickness makes the figures easier to read)Contact diameter: 4 mm
(Ad-Tech contacts have 4mm diameters, with a 2.3mm exposure)- Wire width: Keep the default value, or adjust it later to your taste
- ECoG grids can be defined by pointing successively at their 4 corners. In this example, the contacts of the grid G are labelled sequentially: A1 A2 .. A8 B1 B2 .. B8 .. .. H1 H2 .. H8. You should point at the 4 corners starting by the first two ones, then finish rotating in the same direction: A1, A8, H8, H1.
Navigate in the volume and position the cursor at the center of the artifact corresponding to contact G_A1 (look at the implantation schemes above, it is the more frontal and mesial in the grid), then click on button [#1] in the iEEG tab.
If you can't find this point, you could enter manually the coordinates of the point: click on the button "Set current coordinates" at the bottom of the MRI Viewer window, and copy the MRI coordinates from the screen capture below.
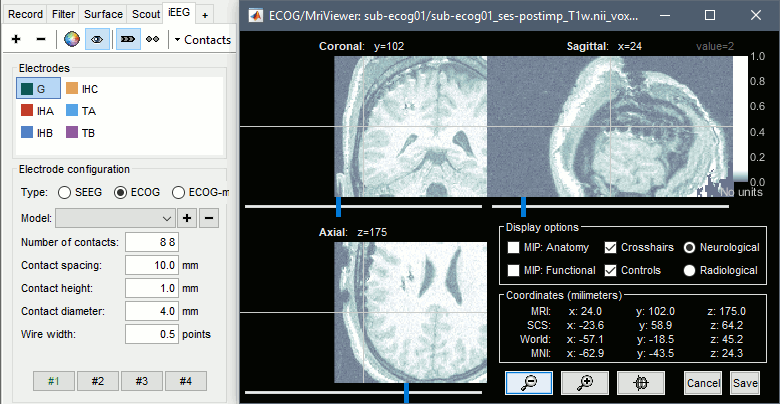
Zoom in/out with the buttons or the associated shortcuts (Ctrl+Scroll or +/-) and explore the volume with (Shift+)x/y/z. Additional display options are available in the popup menu for this figure. All the shortcuts are listed in this tutorial.
Place the cursor at contact G_A8 and click on button [#2].
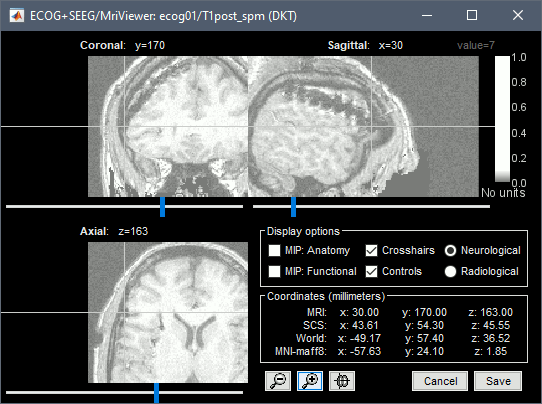
Place the cursor at contact G_H8 and click on button [#3].
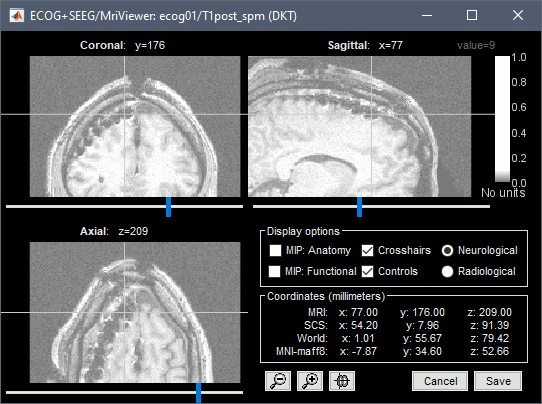
Place the cursor at contact G_H1 and click on button [#4].
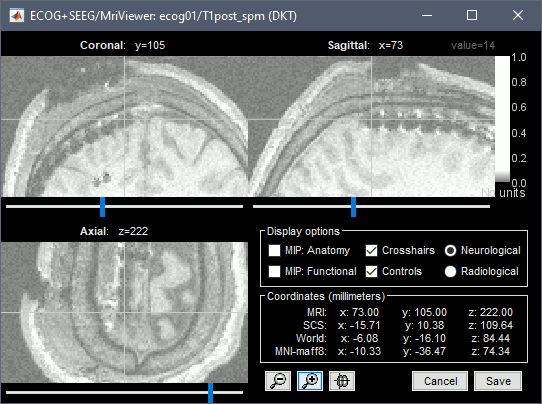
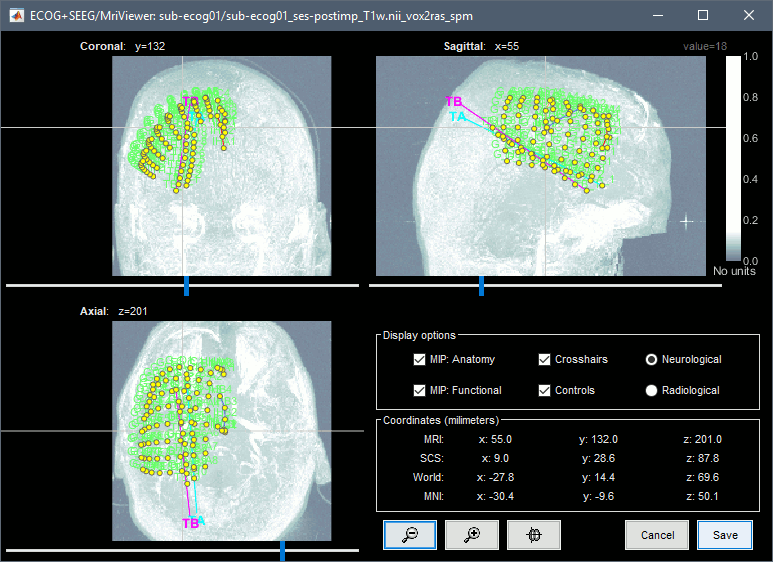
After placing the last corner, it should start computing for a while. The positions of the 64 contacts are distributed in the polygon you defined, and then adjusted to the shape of the brain. To get the figure below, with all the contacts projected on all slices, select the checkbox "MIP: Functional" in the MRI Viewer.
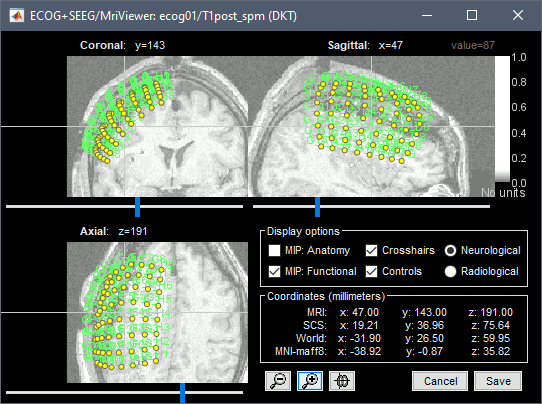
In this window, the contacts can be moved by simple drag-and-drop of the dots representing them. If you move them by mistake, there is unfortunately no undo button. But you can cancel your modifications in two ways: close the figure and discard the modifications, or select "G" in the iEEG tab and then use the menu Contacts > Use default positions, to recompute the initial positions from the 4 four corners of the ECoG grid. In the same menu Contacts, you can find additional projection options: Project on inner skull and Project on cortex. All these menus work well only when skull surfaces are available for the patient (see the section above that explains how to use the menu Generate BEM surfaces).
From time to time, you can click on the menu Contacts > Save modifications in the iEEG tab. This would prevent you from losing your work if anything unexpected happens.
ECoG strips: IHA, IHB, IHC
IHA
In the iEEG tab, select strip IHA and edit the options:
Type: ECOG-mid (for strips or grids that are not in aligned with the skull surface)
Number of contacts: 4
Contact spacing: 10 mm
Contact height: 1 mm
Contact diameter: 4 mm
- ECoG strips are defined only with two points, the first and the last contact. The intermediate contacts are uniformly distributed between the first and last point. In the convention used here, the first contact is always the deepest one.
If you want to hide the contacts of previously edited devices: select the item in the list at the top of the iEEG tab, then click on the button Show/hide selected electrodes just above the list.
Place the cursor on IHA1 (the deepest contact on the most frontal strip) and click [#1].
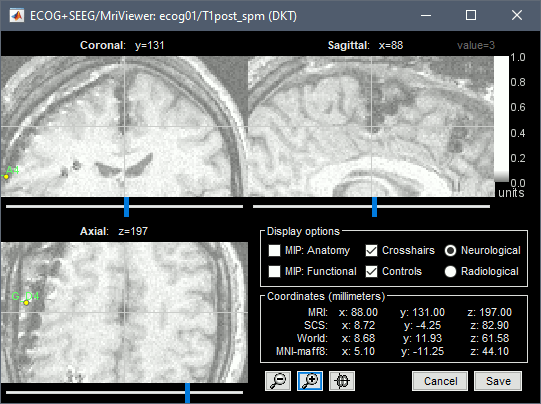
Place the cursor on IHA4 and click [#2].
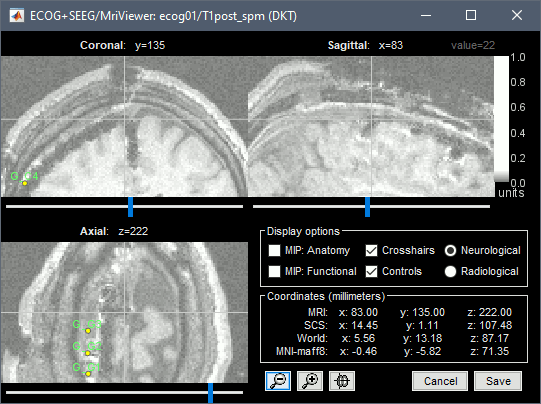
Because you have selected the type ECOG-mid, the contacts are not be aligned on the skull or the cortex automatically. The contacts between the first and the last one are by default distributed uniformly on a straight line, which probably doesn't match their actual positions. Move slightly contacts IHA2 and IHA3 so that they appear in the middle of the artifacts.
IHB
Repeat the same steps with IHB: Set it as ECOG-mid, contact distance=10mm.
Place the cursor on IHB1 (the deepest contact on the middle strip) and click [#1].
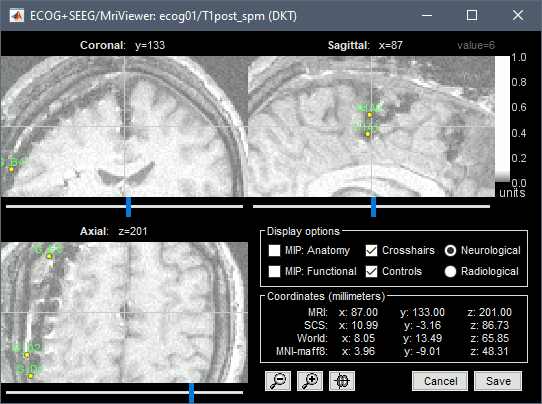
Place the cursor on IHB4 and click [#2].
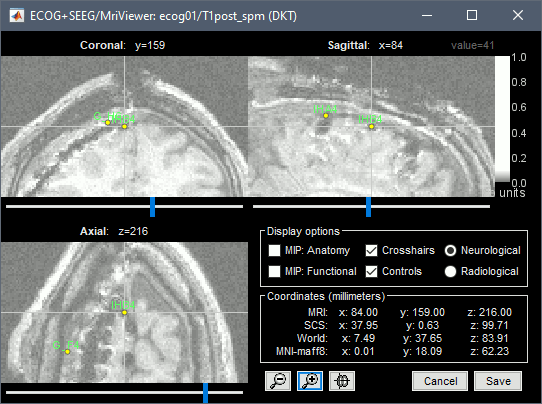
Move the IHB2 and IHB3 contacts on the slices to center them on the artifacts.
IHC
Repeat the same steps with IHC: Set it as ECOG-mid, contact distance=10mm.
Place the cursor on IHC1 (the deepest contact on the posterior strip) and click [#1].
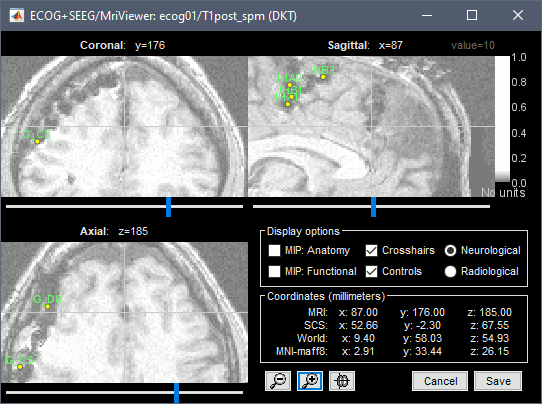
Place the cursor on IHC4 and click [#2].
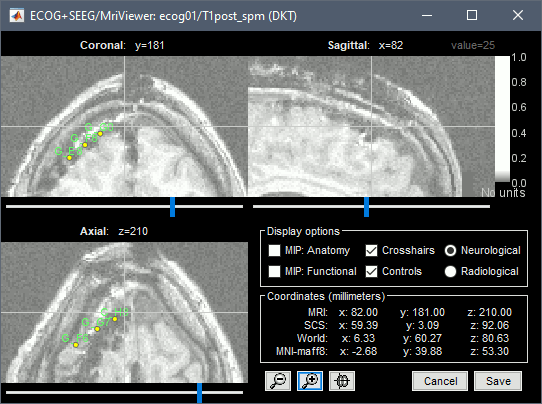
Move the IHC2 and IHC3 contacts on the slices to center them on the artifacts.
sEEG depth electrodes: TA, TB
TA
In the iEEG tab, select electrode TA and edit the options:
Type: SEEG
Number of contacts: 10
Contact spacing: 10 mm
Contact length: 2.5 mm
Contact diameter: 1 mm
Electrode diameter: 0.9 mm
Electrode length: 120 mm
- The contacts actually have the same diameter as the electrode itself, but we use a slightly higher diameter for display, so that they render well in most 3D and 2D views.
- sEEG electrodes are defined with two points, the tip of the electrode (deepest contact) and a second point anywhere along the axis the electrode. One typical solution is to use the entry point in the skull as this second point, because the screws are always easy to identify. In this example, the electrodes are curved, and the entry point is not aligned with most of the contact, therefore we suggest to pick the last contact on the electrode instead. The intermediate contacts are placed along electrode, separated according to the "contact spacing" option, starting from the tip.
Place the cursor on TA1 (the deepest contact on the more mesial probe) and click [Set tip].
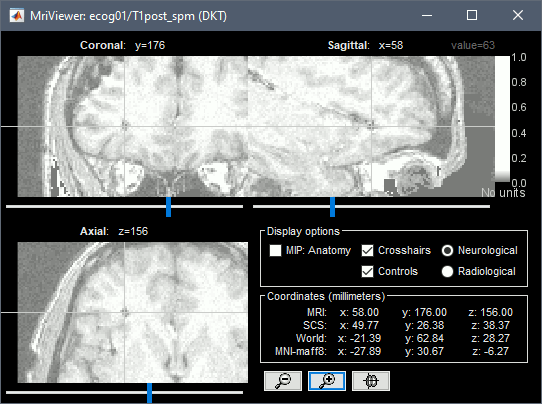
Place the cursor on TA10 (the last contact on this electrode) and click [Set skull entry].
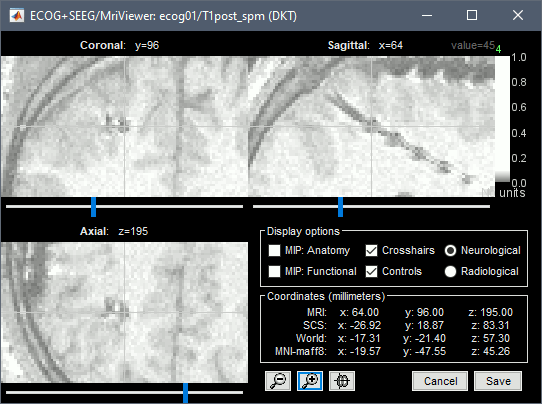
The electrode is curved, therefore you need to move most of the intermediate contacts TA2-TA9 to more appropriate positions, at the center of the matching artifact. Unfortunately, Brainstorm does not handle well curved electrodes yet: if you move the contacts, the electrode remains represented as a straight line. This is a display issue only, which has no impact on any computation, but we hope to improve it at some point.
TB
Repeat the same steps with TB: Set it as SEEG, and use the same configuration.
Place the cursor on TB1 (the deepest contact on the more mesial probe) and click [Set tip].
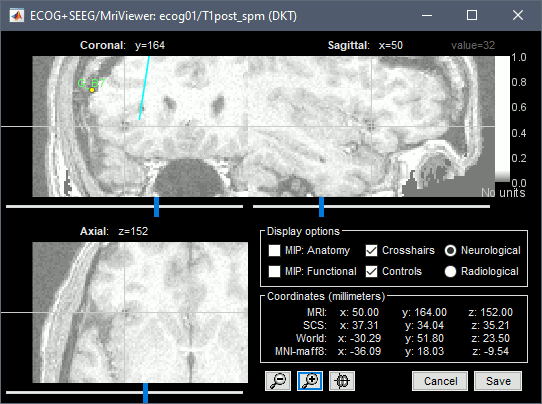
Place the cursor on TB10 (the last contact on this electrode) and click [Set skull entry].
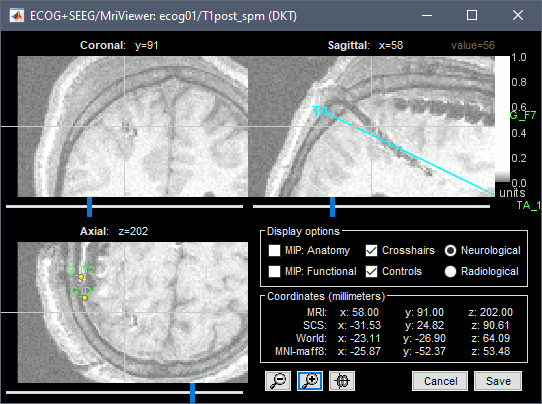
Move the intermediate contacts TB2-TB9 to the centers of the artifacts.
When you are done with marking all the electrodes, click on [Save] in the MRI viewer.
3D display
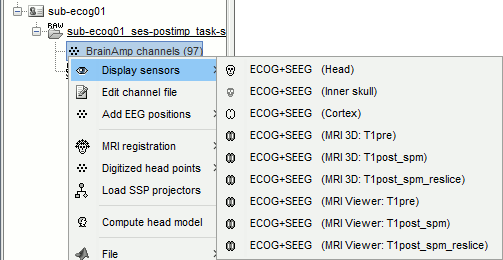
Right-click on the channel file > Display sensors > Explore all the options available.
For help with the display options in the iEEG tab: Epileptogenicity tutorial.
You can add more anatomy elements to the figure with the button "Add a surface" at the top-right of the Surface tab. For more help: Display the anatomy.

Project on brain surface
You probably noticed that many the contacts of the ECoG grid appear under the surface of the cortex in these 3D figures. This is mostly due to the brain shift between the volumes we used to mark the contacts (post-implantation MRI) and the volume from which the cortex surface was reconstructed (pre-implantation MRI). One solution to compensate for this brain shift and produce more readable figures is to project the contacts on the pre-implantation surfaces.
In the iEEG tab, select the grid G, then use menu Contacts > Project on cortex.
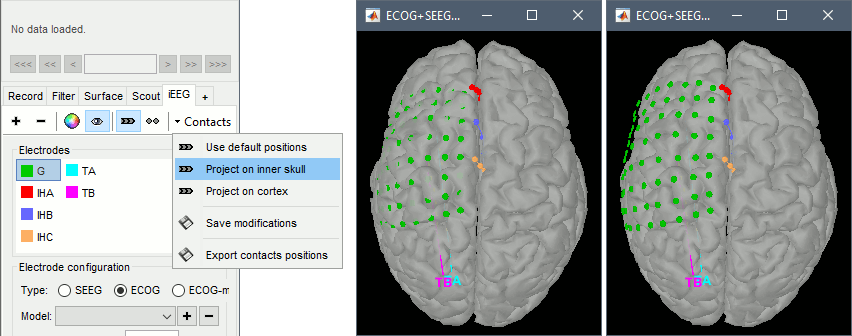
You could also test what you obtain by projecting the contacts on the inner skull. It produces similar results, but with a different method, projecting the contacts possibily a bit further away from the brain. Depending on the quality of the surfaces, the shape of the brain, and the position of the contacts, one solution may produce weird results, try the other one in that case.
Display the recordings
ECoG/sEEG time series
Right-click on any "Link to raw file" > ECOG+SEEG > Display time series.
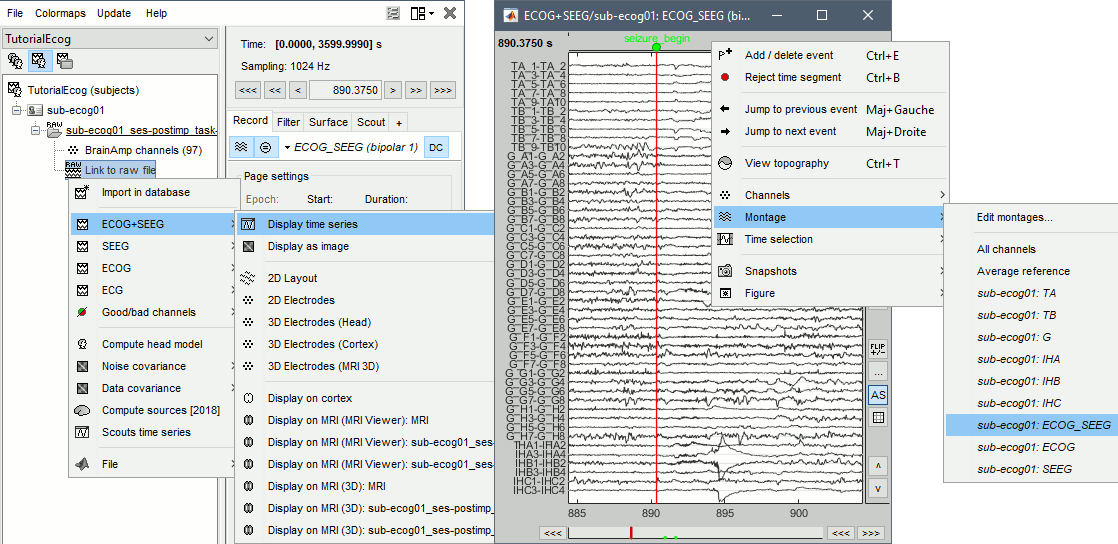
- For instructions on how to use this viewer, please refer to these tutorials:
- Typical display configuration includes:
Set the page duration to 20s or 30s: Record tab > Page settings.
Change the display mode to "columns": Record tab > Toolbar > First button.
Change the montage (bipolar/monopolar): Record tab > Drop-down menu.
- Set visualization filters: Filter tab.
- Disable the automatic scaling when changing page: Button [AS] in the time series figure.
- Adjust the amplitude scale: Right-click+move up/down, or buttons [^] and [v].
Set the resolution precisely: Right-click on the figure > Figure > Set axes resolution.
- Montage options include, for each group separately or all the channels together:
Bipolar 1: Difference of pairs of adjacent sensors (sparse), eg. A1-A2, A3-A4, A5-A6
Bipolar 2: Difference of pairs of adjacent sensors (exhaustive), eg. A1-A2, A2-A3, A3-A4
Local average reference: Average reference computed independently for each group
2D/3D topography
With the menus 2DLayout, 2D Electrodes and 3D Electrodes you can visualize the ECoG/sEEG values at the current time point. Move the time cursor and it will update the values represented on the contacts.
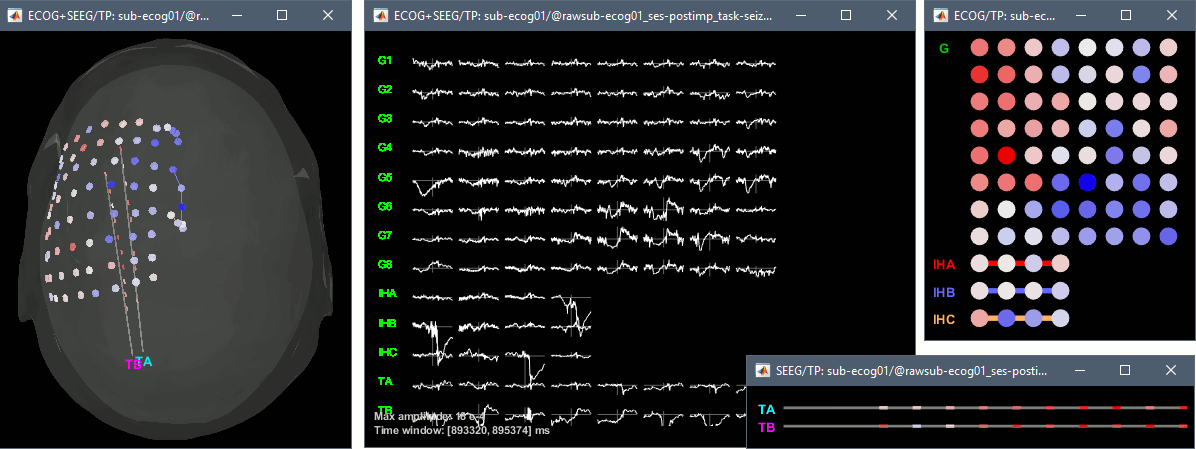
Interpolate on the anatomy
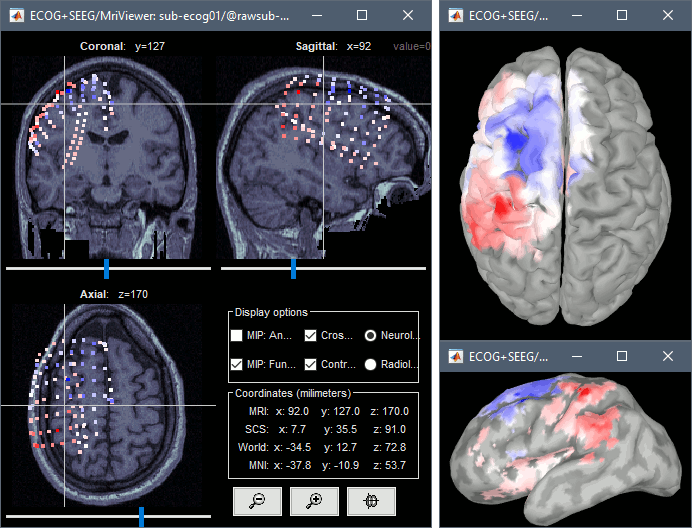
From the same ECOG+SEEG display menu, you can also project the recordings on the MRI or the cortex. You can edit the colormap for the displayed values like any other colormap.
MRI volume: All the voxels in the neighborhood of a contact are attributed the value associated with this contact. In the figure below, both "MIP: functional" and "MIP: anatomy" options are selected (maximum intensity projection along each axis = "glass brain" view).
Cortex surface: The values of the vertices are interpolated from the nearest SEEG contacts (the magnitude decreases with the distance to the contact).
Power spectrum
We recommend you always start your data analysis with a spectral evalution of the recordings, it may help you identify bad channels. This is described in tutorials Power spectrum and EEG and epilepsy.
- In Process1, select the continuous file.
Run process Frequency > Power spectrum density (Welch): All file, Length=10s, Overlap=50%.
Double-click on the PSD files to display them, change to a log-scale for the X axis, zoom in. None of the channels seem to have noise levels that are higher or lower than the others, all the channels are possibly good.

- If the spectrum plots are too noisy and difficult to read, you can recompute them with lower frequency resolution. Decrease the duration of the estimator window, possibly down to 1s depending on the sampling frequency. This will estimate the PSD by averaging the power of more time windows with less data bins, the result will be smoother.
Import epochs of interest
At this point of the analysis, we are still looking at the original files, no data was copied to the database. The montages are saved in the Brainstorm preferences, the bad channels and new events are saved in the links of the database but not reported to the original files. If you delete your protocol at this point, you would only lose the event marking and bad channel selection.
We are now going to import two segments of recordings for each seizure file: the seizure (10s before and 40s after the onset). This will make real copies of the data in the database, so we can run additional processes on them.
Import in database
Right-click on SZ1 / Link to raw file > Import in database:
- Time window: All, the only interesting point is to have access to the Onset marker.
- Split in time blocks: Disabled
Use events: Enabled, select Onset
Epoch time: [-10000, +40000] ms (imports -10s to 40s around the event "Onset")
- Remove DC offset: Disabled
- Resample: Disabled
- At the end, you should have three new folders SZ1/SZ2/SZ3, the same name as the original .TRC files, but without the tag "raw" on top. These new folders contain copies of the SEEG recordings, if you delete these folders from the database explorer, you lose the recordings they contain.
The imported epochs are saved with a new timing: for the seizure onsets, the reference time t=0s is now the event "Onset", which has been removed from the list. You can still see the other marker Seizure, which should be slightly before 0s. For the baselines, the reference t=0 is the beginning of the segment.
![[ATTACH] [ATTACH]](/moin_static198/brainstorm1/img/attach.png)
Time-frequency analysis (pre-onset baseline)
The aim of this section is to evaluate the frequency range for the computation of the epileptogenicity maps. We need to identify which frequency band is the most representation and specific of the high-frequency activity at the beginning of the seizures.
Starting from this step, you need to have the SPM12 toolbox installed on your computer and added to your Matlab path. We need here the multitaper functions from the FieldTrip toolbox, which are also already in the SPM package.
- In Process1, select all the Onset bipolar files.
Select the process: Frequency > FieldTrip: ft_mtmconvol (Multitaper): (do not run)
Time window: [-10, 10]s
Sensor types: SEEG
Taper: hanning
Frequencies: 10:3:220
Modulation factor: 10
Time resolution: 1000ms
Measure: Magnitude
Save average: Disabled
Add the process: Standardize > Baseline normalization:
Baseline: [-10, -1]s
Method: Z-score transformation
Overwrite: Enabled
Add the process: Average > Average files:
Group files: Everything
Function: Arithmetic average
- Four new files are available in the database: one for each bipolar Onset epoch, and one average, saved in folder "Intra-subject".
Right-click on the average time-frequency map > All channels. Then you can click on a channel to open it in a separate figure. Change the colormap to "GIN" and the colormap maximum to [-0.1,+0.1]*10^2 to reproduce the figures below.
Create a movie with the SEEG signals
Saving the conclusions of your visual exploration as a video file is an efficient solution for keeping track of your analyses and sharing them with your colleagues. In such a movie, it can be interesting to display simultaneously the original SEEG recordings with the epileptogenicity maps. However, if you try to open the two files, you get an error message explaining that Brainstorm cannot display two files with different time definitions at the same time.
A solution to go around this limitation is to resample the epileptogenicity results (one value every two seconds = 0.5Hz) with the same frequency as the SEEG recordings (initially 512Hz). This would multiply the size of the file containing the epileptogenicity results by 2*512, creating a file of several Gb. To avoid wasting too much disk space and risking to crash Matlab by creating gigantic variables, we can cut and downsample the SEEG recordings of interest. Let's illustrate this with the seizure SZ2.
In Process1, select the file SZ2_bipolar_2/Onset.
Select process Extract > Extract time: 0-20 s
- Run the execution. The output is a downsampled version of the first 20s after the seizure onset.
In Process2, select:
FilesA = Resampled seizure recordings SZ2_bipolar_2/Onset | time (target time definition)
FilesB = Stat results Epileptogenicity_surface/EI_SZ2_120_200_3 (file to resample)Run process Standardize > Interpolate time: You can try the interpolation methods "nearest" or "linear", depending on if you would like to see the real statistical results or smooth (but inaccurate) transitions between the steps of two seconds for which the epileptogenicity maps were computed.
- The new resampled epileptogenicity file has the same time definition as the resampled seizure SEEG recordings: the two can now be opened simultaneously.
- After creating all the files you want to display, open them simultaneously and position the various figures on your screen the way you would like them to appear in the movie. Note that the text is displayed with a fixed size, it doesn't change if you reduce the size of the figures, so if you make the figures smaller the text will be bigger relatively to the graphics, making it possibly more readable in your screen captures.
To display only a subset of channels in the figure, either use an existing predefined montage, create a montage with the Montage editor, or select the channels you want in the time series figures and use the menu "Create from selection".
Right-click on any of the figures > Snapshot > Movie (time): All figures. You can experiment the effect of the various parameters to obtain exactly the movie you want. The figure on which you right-click will show a time stamp at the bottom-left corner in the movie.
The video file generated can be viewed on any computed, added to a website or included in a slide of a presentation.
Scripting
The following script from the Brainstorm distribution reproduces the analysis presented in this tutorial page: brainstorm3/toolbox/script/tutorial_ecog.m