I used the interface of the process “Frequency > Time-frequency(Morlet wavelets)” to analysis my data of two groups subjects. Then I got the results, like “Power, 1-50Hz (EEG) | multiply”. If I want to average the results among 5 subjects, I would put the results in a new folder in brainstorm and run “Average > Average Files”(Process options: Group files: Everything; Function: Arithmetic average). Am I right? Also, after averaging within groups, what should I do if I want to do subtraction between time-frequency files of two groups.
1 Like
up up up 
If I want to average the results among 5 subjects, I would put the results in a new folder in brainstorm and run “Average > Average Files”(Process options: Group files: Everything; Function: Arithmetic average)
You don't need to move the results in a different folder first, just average the subject-level results.
what should I do if I want to do subtraction between time-frequency files of two groups.
In Process2, put one file on the left, the other on the right, and call a difference process.
https://neuroimage.usc.edu/brainstorm/Tutorials/Difference#Time-frequency
https://neuroimage.usc.edu/brainstorm/Tutorials/Statistics
https://neuroimage.usc.edu/brainstorm/Tutorials/Workflows#Time-frequency_maps
https://neuroimage.usc.edu/brainstorm/Tutorials/VisualGroup
Thanks for your answer. Another question is that color bars of time-frequency results (different subjects or channels) are different. In order to compare time-frequency results of different situations, how should I adjust the color bar to be uniform?
You can set a fixed range for the color bars with the option Maximum: Custom.
https://neuroimage.usc.edu/brainstorm/Tutorials/Colormaps
Thanks a lot.
Dear Francois,
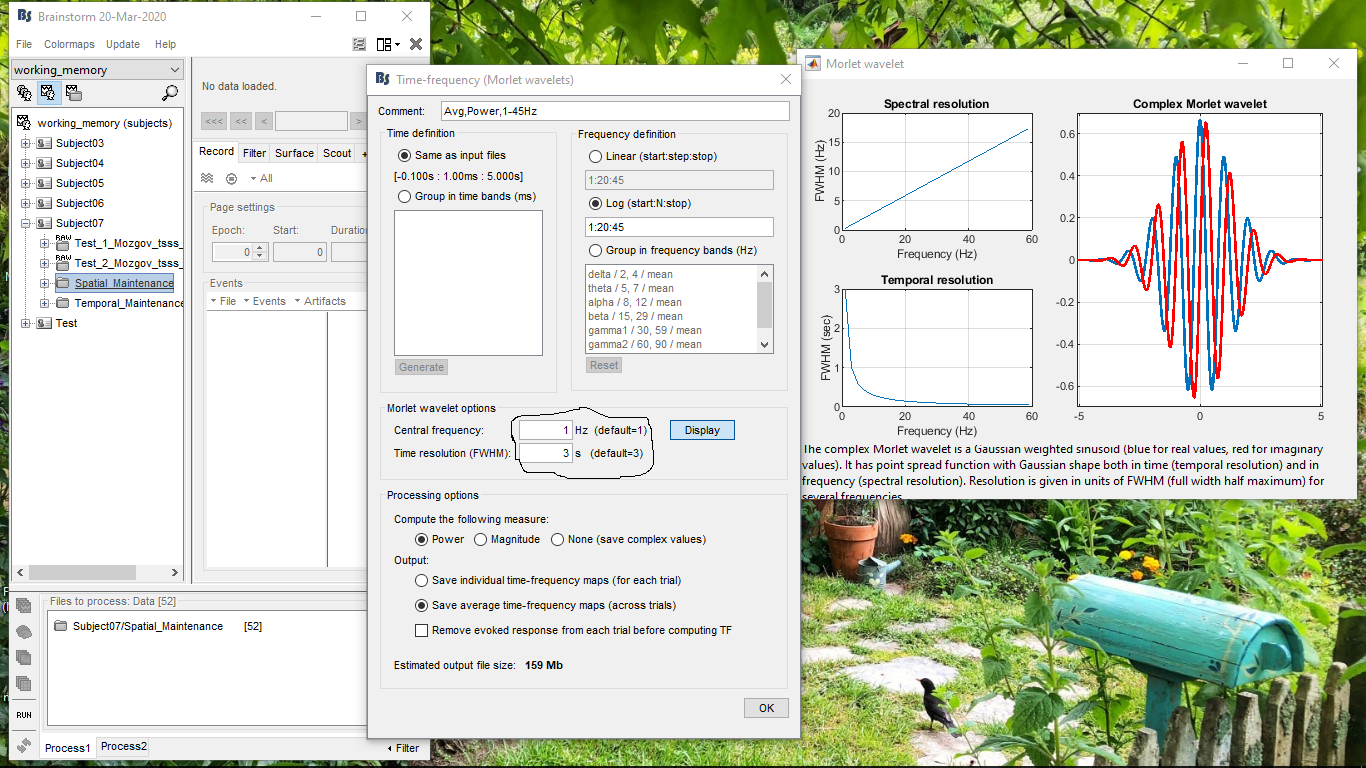
I have a question, how can I define number of cycles for Morlet Wavelet in TF analysis? For example 2, 4, 6 and 8 no. of cycles for Alpha (9-12 Hz) Beta (14-28 Hz) and Gamma (30-45 Hz) in each range individually or for all together. I've gone through TF tutorial but couldn't really understand how to set the no. of cycles.
Thanks and look forward.
Best,
Abrar
Dear Abrar,
Cycles can be set by using the FWHM parameter together with the center frequency parameter. A good paper by Mike X Cohen explaining this can be found here : https://www.biorxiv.org/content/10.1101/397182v1.full.pdf
Kind regards,
Steven
Dear Steven,
Thank you for your comment. So here I just need to change only the value of central frequency and FWHM? Pls see attached screenshot
Dear Abrar,
Yes the paper that I mentioned presents a way to write number of cycles in the other parameters.
If you follow that i'm sure you will get your results 
Kind regards,
Steven
2 Likes
If I'm not mistaken, just figured out that formula to set cycles and a temporal resolution at FWHM would be like (n*1/f)/2; where n= no. of cycles, f= desired frequency. Thus for 6 cycles at 10 Hz, it will be 0.3 s= 300 ms; for 4 cycles at 10 Hz 0.4 s = 400 ms and so on.
Comparing 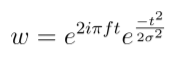 with
with 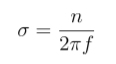 where n is the number of cycles and
 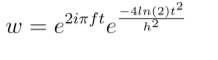 with h being the FWHM would lead to n =
Which would relate the parameters n h and f. For 6 cycles at 10 Hz this gives 0.2648 for h which comes quite close to 0.3
Hi Francois,
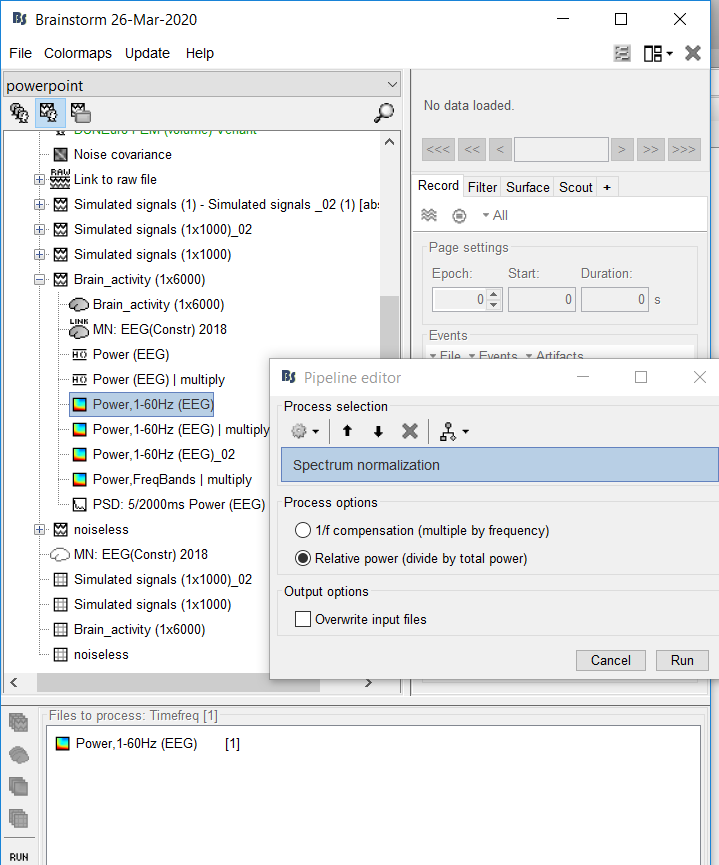
I have a new question, I want to compute ratio of the power of different bands to all bands(such as, power of alpha /power of all bands) based to the results of time-frequency(morlet wavelets), what should I do in brainstorm?
And I also have a question about the display of the time-frequency results, the x-coordinate in the result is from -0.5s to 0.5s, how can I represent it in milliseconds and make the spacing smaller (such as, -500ms, -250ms, 0ms, 250ms, 500ms)
You can use the spectrum normalization function in brainstorm, in which you normalize against the total power, which would automatically give the ratio
I think your second question can be solved using the matlab plot options which can be accessed by right clicking in the figure then go to figure and then to matlab controls
Use either the normalization process suggested by @SBeumer, or if you need to compute other measures (eg. ratio of two frequency bands), you can use the generic process "Pre-process > Run Matlab command"
how can I represent it in milliseconds and make the spacing smaller (such as, -500ms, -250ms, 0ms, 250ms, 500ms)
Indeed, you can edit the properties of the axes object, either interactively (Figure > Matlab controls) or from the command line. Look for help in the Matlab documentation.
Hi SBeumer,
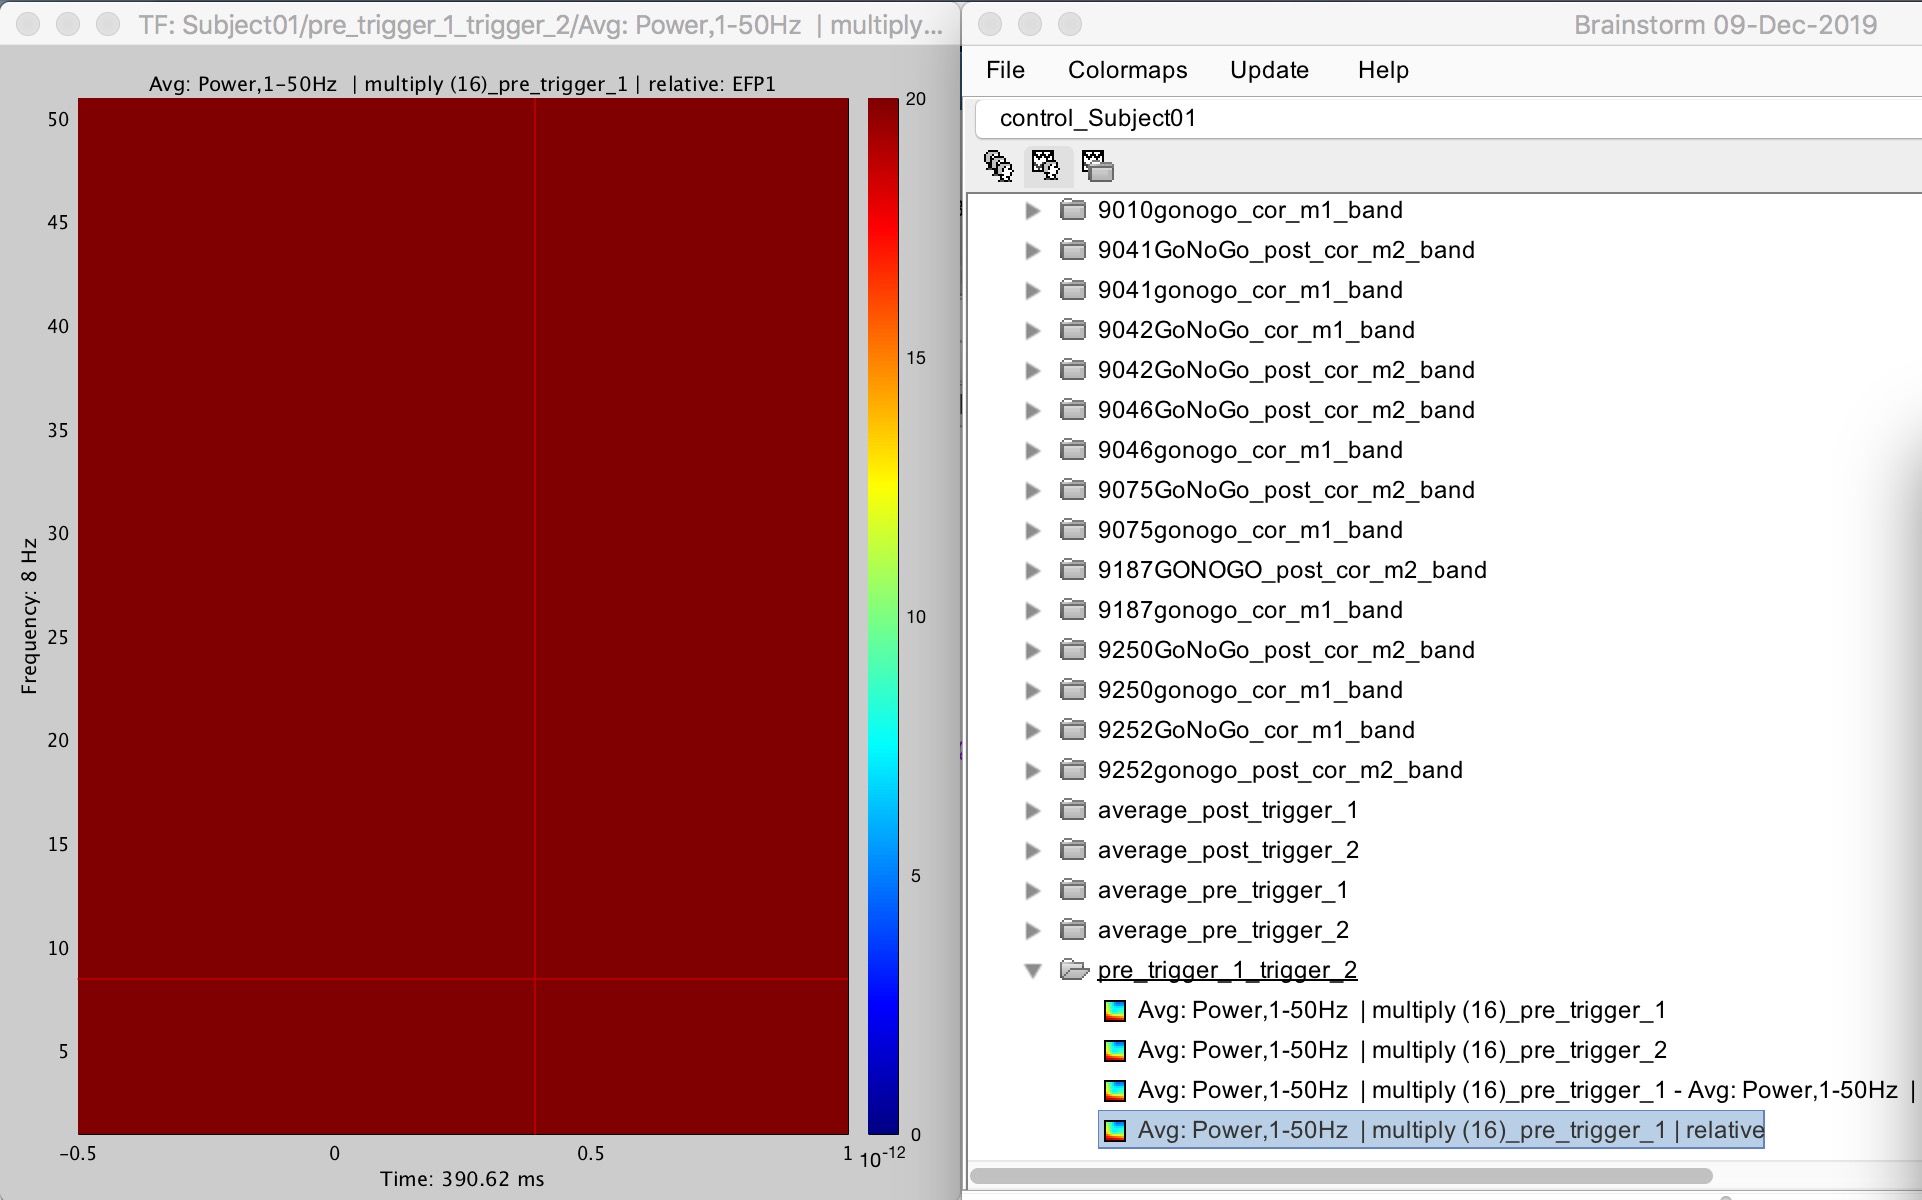
I use the spectrum normalization, and get the result. I open the picture of one channel. How can I see the ratio of different bands?
Francois, thank you. I understand the second question.
There are multiple options, you can plot the time series of a single channel for the bands and see the levels on that, you can also export the matrix to matlab and inspect the values over there
Hi SBeumer,
Each value in the time-frequency result is divided by the total power by using spectrum normalization, and get the ratio. Then I export the result of spectrum normalization to matlab, value of TF matrix represents these ratios, if I want to compute the proportion of theta band in whole time process, just add the value of all points of theta band in the matrix. Am I right?