Hi Francois and all,
I am currently running an analysis on ERPs and am coming across some difficulties.
My amplitude values are within normal when visualizing my mean waveforms in Brainstorm. However, at the point of exporting the data to a csv file, I get amplitude values that do not match the ones I’m visualizing in Brainstorm. The resulting trend in the data remains accurate, but its position is highly skewed on the Y axis. This gives the impression that an unknown constant is being multiplied to the data, but that the software automatically corrects for it, as my data is properly displayed on Brainstorm. I tried different manipulations and the issue seems to be introduced at the averaging step.
Please let me know if / which visual support would help in better understanding this issue.
Thank you for your help!
My best,
Shady
Hi Shady,
I have two guesses:
- The time series in Brainstorm have amplitudes in
[fT] for MEG, and [μV] for EEG. However, when exported the units are [T] and [V]. This will lead to scaling factor of 1×10^-15 or 1×10^-6 for MEG and EEG signals respectively.
- Other potential source of the difference could be that the visualization Filter in Brainstorm is active. Thus the data will look smoother in Brainstorm than in the CSV data.
If none of these two options explain the difference. Can you upload more information?
For example, a screenshot of your data in Brainstorm and the CSV file that was created.
Best,
Raymundo
Hi Francois and Raymundo,
Thank you for helping Shady.
A bug with the filtering does appear to be involved.
The ERP pipeline was as follows:
ICA to remove blinks
Apply SSP projectors
Bandpass 1-50 Hz
Import into database
remove bad epochs
Average all epochs
Here is the file history of the resulting ERP (yes, I know that the number of epochs is few)
Path: D:\BrainstormDB_D\Existenz\data
Name: P01/Stim1/data_Stim1_average_210825_0929.mat
- 25-Aug-2021 09:29:24 | average | Average: By subject
- 25-Aug-2021 09:29:24 | average | History of the first file:
- 25-Aug-2021 09:27:52 | import | - Import from: D:\BrainstormDB_D\Existenz\data\P01@rawP01_Combined_Filtered_clean_band_02\P01_Combined_Filtered_clean_band_02.bst (Event)
- 25-Aug-2021 09:27:52 | import | - Apply SSP projectors
- 25-Aug-2021 09:29:24 | average | List of averaged files:
- 25-Aug-2021 09:29:24 | average | - P01/Stim1/data_Stim1_trial001_02.mat
- 25-Aug-2021 09:29:24 | average | - P01/Stim1/data_Stim1_trial002_02.mat
- 25-Aug-2021 09:29:24 | average | - P01/Stim1/data_Stim1_trial003_02.mat
- 25-Aug-2021 09:29:24 | average | - P01/Stim1/data_Stim1_trial004_02.mat
- 25-Aug-2021 09:29:24 | average | - P01/Stim1/data_Stim1_trial005_02.mat
- 25-Aug-2021 09:29:24 | average | - P01/Stim1/data_Stim1_trial006_02.mat
- 25-Aug-2021 09:29:24 | average | - P01/Stim1/data_Stim1_trial007_02.mat
- 25-Aug-2021 09:29:24 | average | - P01/Stim1/data_Stim1_trial008_02.mat
- 25-Aug-2021 09:29:24 | average | - P01/Stim1/data_Stim1_trial009_02.mat
- 25-Aug-2021 09:29:24 | average | - P01/Stim1/data_Stim1_trial010_02.mat
- 25-Aug-2021 09:29:24 | average | - P01/Stim1/data_Stim1_trial011_02.mat
- 25-Aug-2021 09:29:24 | average | - P01/Stim1/data_Stim1_trial012_02.mat
- 25-Aug-2021 09:29:24 | average | - P01/Stim1/data_Stim1_trial013_02.mat
- 25-Aug-2021 09:29:24 | average | - P01/Stim1/data_Stim1_trial014_02.mat
- 25-Aug-2021 09:29:24 | average | - P01/Stim1/data_Stim1_trial015_02.mat
- 25-Aug-2021 09:29:24 | average | - P01/Stim1/data_Stim1_trial016_02.mat
- 25-Aug-2021 09:29:24 | average | - P01/Stim1/data_Stim1_trial017_02.mat
- 25-Aug-2021 09:29:24 | average | - P01/Stim1/data_Stim1_trial018_02.mat
- 25-Aug-2021 09:29:24 | average | - P01/Stim1/data_Stim1_trial019_02.mat
- 25-Aug-2021 09:29:24 | average | - P01/Stim1/data_Stim1_trial020_02.mat
- 25-Aug-2021 09:29:24 | average | - P01/Stim1/data_Stim1_trial021_02.mat
- 25-Aug-2021 09:29:24 | average | - P01/Stim1/data_Stim1_trial022_02.mat
- 25-Aug-2021 09:29:24 | average | - P01/Stim1/data_Stim1_trial023_02.mat
- 25-Aug-2021 09:29:24 | average | - P01/Stim1/data_Stim1_trial024_02.mat
- 25-Aug-2021 09:29:24 | average | - P01/Stim1/data_Stim1_trial025_02.mat
- 25-Aug-2021 09:29:24 | average | - P01/Stim1/data_Stim1_trial027_02.mat
- 25-Aug-2021 09:29:24 | average | - P01/Stim1/data_Stim1_trial028_02.mat
- 25-Aug-2021 09:29:24 | average | - P01/Stim1/data_Stim1_trial029_02.mat
- 25-Aug-2021 09:29:24 | average | - P01/Stim1/data_Stim1_trial030_02.mat
- 25-Aug-2021 09:29:24 | average | - P01/Stim1/data_Stim1_trial031_02.mat
- 25-Aug-2021 09:29:24 | average | - P01/Stim1/data_Stim1_trial032_02.mat
- 25-Aug-2021 09:29:24 | average | - P01/Stim1/data_Stim1_trial033_02.mat
- 25-Aug-2021 09:29:24 | average | - P01/Stim1/data_Stim1_trial034_02.mat
- 25-Aug-2021 09:29:24 | average | - P01/Stim1/data_Stim1_trial035_02.mat
- 25-Aug-2021 09:29:24 | average | - P01/Stim1/data_Stim1_trial036_02.mat
- 25-Aug-2021 09:29:24 | average | - P01/Stim1/data_Stim1_trial037_02.mat
- 25-Aug-2021 09:29:24 | average | - P01/Stim1/data_Stim1_trial038_02.mat
- 25-Aug-2021 09:29:24 | average | - P01/Stim1/data_Stim1_trial039_02.mat
- 25-Aug-2021 09:29:24 | average | - P01/Stim1/data_Stim1_trial040_02.mat
- 25-Aug-2021 09:29:24 | average | - P01/Stim1/data_Stim1_trial041_02.mat
(For info on the SSP/ICA projectors: read the history of the channel file)
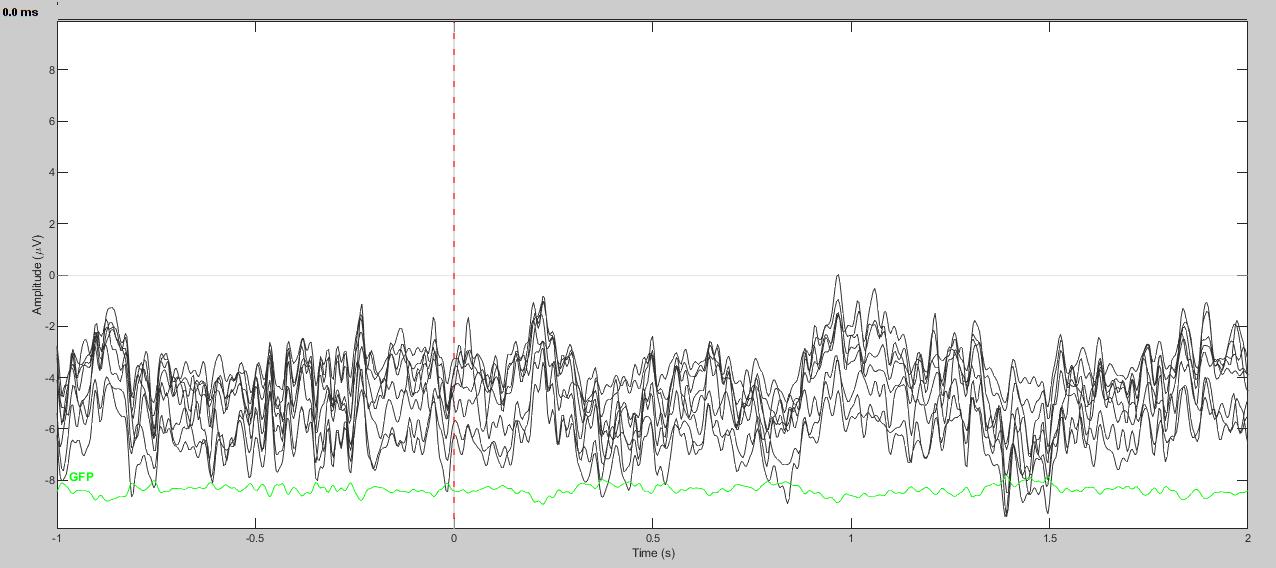
However, it appears that the band pass filter was not hard encoded in the file. Because, as you suggested, the resulting ERP appears to not be high-pass filtered.
Here is what the resulting ERP looks like without the visualization high pass:
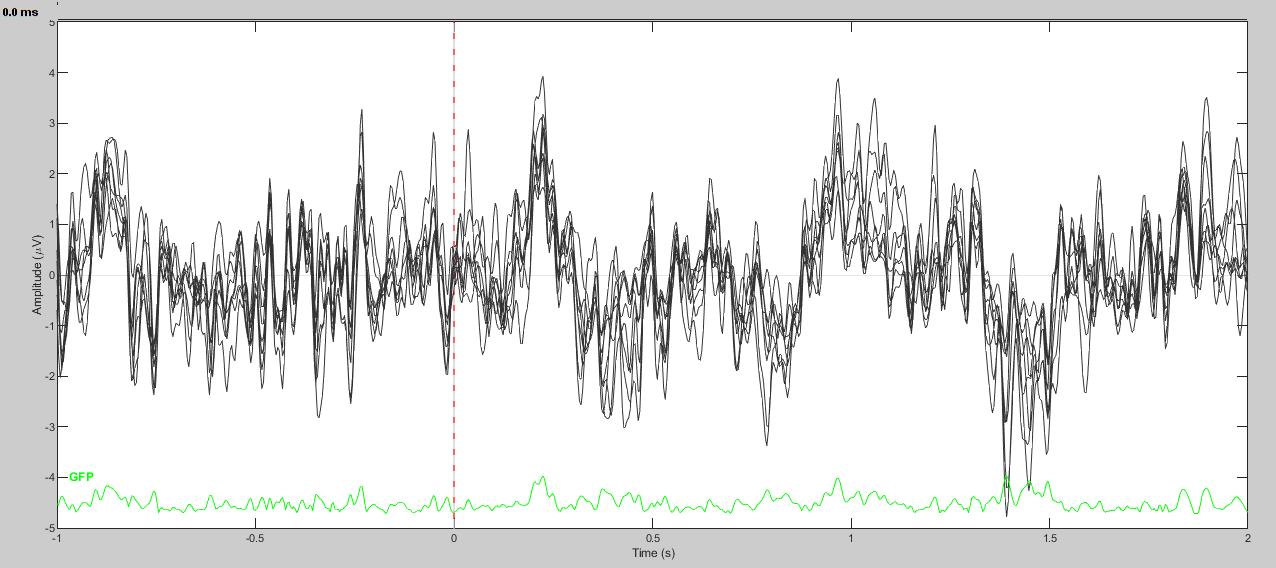
Here is what the resulting ERP looks like with the visualization high pass at 1Hz:
It seems quite clear that filtration of the cleaned data did not work as it was supposed to. I don't think this should happen. However, I am going to invert the steps of the pipeline to bandpass filter first, and then clean. In the meantime, I would appreciate your further thoughts on this issue when you have a moment.
Best,
Jared
P.S. Indeed, filtering before cleaning solves the problem. Or rather, I should say, ICA was performed. However, I did not immediately proceed to apply SSP projectors. Instead, I performed the bandpass filtering with the "Process the entire file at once" checked. Thus, the SSP projectors were applied in the same step as the filtering. Though, I don't understand why this would be functionally different from my original pipeline. It shouldn't matter if bandpass filtering is done before or after cleaning, no?
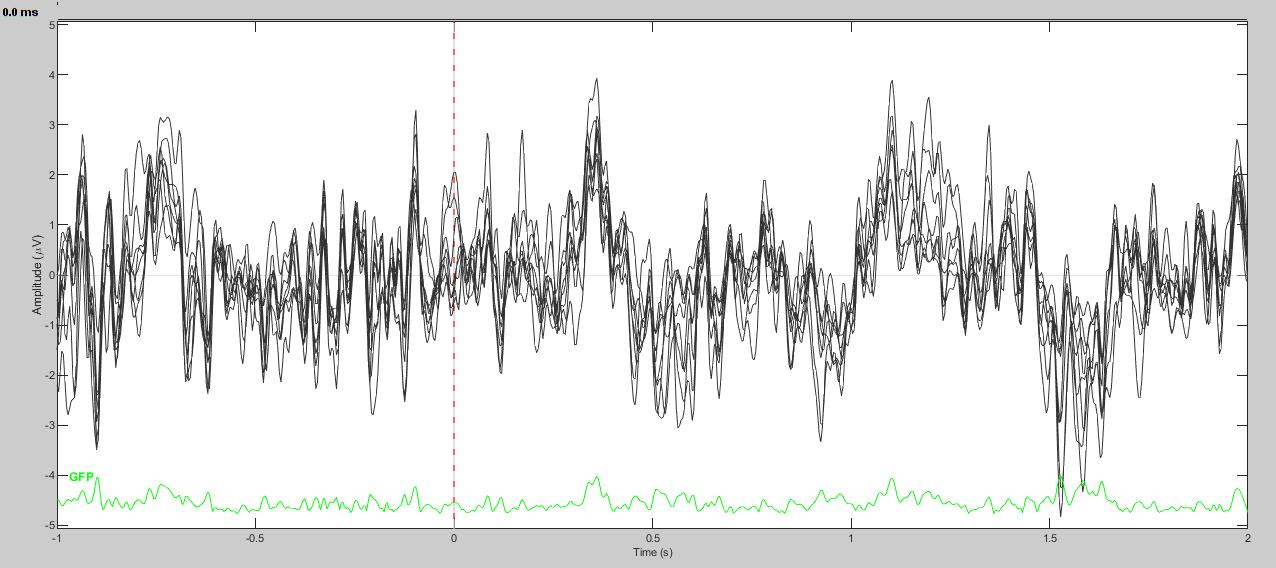
Here is the new ERP with bandpass 1-50 first, then ICA:
Apply SSP projectors
Why exactly do you need to add this extra step?
ICA to remove blinks
Bandpass 1-50 Hz
Our recommended pipeline is to run all the frequency filters before any additional and more interactive spatial filtering.
ICA+bandpass vs. bandpass+ICA would produce very different results.
Here is what the resulting ERP looks like without the visualization high pass:
As explained in the introduction tutorials, and in the red warning in the Filter tab:
Visualization filters are for visualization only, they are not applied to the data.
https://neuroimage.usc.edu/brainstorm/Tutorials/ReviewRaw#Filters_for_visualization
If the filters were correctly applied on the continuous files, adding visualization filters should not change the display (or a little bit, because of the edge effects of the filters, but definitely not as much as what you describe).
https://neuroimage.usc.edu/brainstorm/Tutorials/ArtifactsFilter
I applied the SSP projectors because I handed over the files to a student to complete the pipeline. She did not have the signal processing toolbox available to work with, and could not successfully perform the ICA. I wanted her to learn all the steps, but be able to work with cleaned data. Hence why I did not follow your recommended pipeline.
ICA+bandpass vs. bandpass+ICA would produce very different results.
But you can set the frequency band upon which to perform ICA... You have piqued my curiosity now.
As explained...visualization filters are for visualization only...
Yes. Exactly. It was precisely because of this that we were able to track down this bug.
If the filters were correctly applied...
This is entirely the point of the post. Regardless if the pipeline was the recommended one or not doesn't change the fact that bandpass filtration does not work if you try to apply it to a file where the "apply SSP projectors" has been performed. This does not make sense. A filter should not care what has been done to the data. It should still be able to filter. However, it clearly does not. No error message is shown. But the pictures we posted show clearly that the filtration does not happen. The visualization filters work fine, but filtration processing does not. Has no one encountered this issue when working with data where the "apply SSP projectors" has been performed? It seems like something you guys should be made aware of, regardless of whether the pipeline is standard or not. I have not tried playing with it further, but what if TF decomposition also doesn't work correctly on such files. That would be a serious problem no?
She did not have the signal processing toolbox available to work with, and could not successfully perform the ICA
You can always use the compiled version of Brainstorm, no toolbox limitation (but no scripting).
But you can set the frequency band upon which to perform ICA... You have piqued my curiosity now.
It would filter again the data. It is not recommended to use this input if you already filtered your signals in the same frequency band.
We don't have a lot of expertise with ICA by frequency bands, you may receive better advice from the EEGLAB community.
The visualization filters work fine, but filtration processing does not. Has no one encountered this issue when working with data where the "apply SSP projectors" has been performed?
I don't manage to reproduce what you describe here.
I'd need more help from you in order to first reproduce this bug, and then hopefully fix it.
Could you please:
- Share a short example file on which you obtain this wrong results: upload the original EEG recordings somewhere and post the download link here.
- Generate a Matlab script to reproduce exactly what you describe: stack all the processes in the pipeline editor (from "Create link to raw file" to "Average" - skip the bad epochs removal as it wouldn't change anything), then generate the script
https://neuroimage.usc.edu/brainstorm/Tutorials/Scripting#Starting_a_new_script
- Copy-paste your script here.
If you really don't understand how to generate this script: try reproducing the same results using only the Pipeline editor and post screen captures of the options of all the processes.
Thanks