I have a query regards the average re-referencing. I applied this after removing bad channels and before ICA in my pre-processing pipeline. After importing epochs for 4 outcomes and removing the DC offset (based on -190 to -10ms, within -200ms pre-baseline) I averaged (weighted) the epochs for subjects and then obtained the grand average for two groups. I noticed for two of the four outcomes for both groups the channels pre-baseline are slightly slanted upward (moving from -1uv to 1uv before 0 ms). When I select the avg ref option for visualization purposes this is 'corrected' and the channels are flat relative to the x-axis. This also shifts the ERP downward (it's size/amplitude from top to bottom stays roughly the same).
Is applying a re-reference again to the imported epochs before obtaining the subject average appropriate (using the apply montage process)? Or would applying avg ref after ICA make a difference (I read some papers that ran their processing pipeline this way)?
I'm assuming (if the hypothesis is focused on the ERP) a 'flatter' baseline pre-0 ms is better as any activity not related to the ERP of interest has been filtered out and this gives a more accurate estimate of the ERP itself.
I noticed for two of the four outcomes for both groups the channels pre-baseline are slightly slanted upward (moving from -1uv to 1uv before 0 ms). When I select the avg ref option for visualization purposes this is 'corrected' and the channels are flat relative to the x-axis. This also shifts the ERP downward (it's size/amplitude from top to bottom stays roughly the same).
A screen capture would help much more understanding what is happening here.
Press Alt+PrintScreen to capture the window, then CTRL+V in the message editor to paste the image.
Is applying a re-reference again to the imported epochs before obtaining the subject average appropriate (using the apply montage process)?
Re-referencing your EEG is something you should do during the early pre-processing stages: after marking bad channels, after filtering, before or after ICA (it seems that they are people defending both orders, in my little experience it doesn't seem to cause dramatic changes), but before epoching and group averaging. https://neuroimage.usc.edu/brainstorm/Tutorials/Epilepsy#Average_reference
What distorts the most the data in the pipeline you present here is the DC offset correction, as it adds a somewhat arbitrary shift to all the signals. If you filtered your EEG with a high-pass filter, you probably don't need this. This is part of our recommended pipeline mostly for epoching non-filtered MEG recordings.
I'm assuming (if the hypothesis is focused on the ERP) a 'flatter' baseline pre-0 ms is better as any activity not related to the ERP of interest has been filtered out and this gives a more accurate estimate of the ERP itself.
Not necessarily, it has to make sense and match your hypothesis
I averaged the epochs within subjects (selecting the weighted average option) then obtained the grand average across the subjects within the groups (weighted option deselected). I followed part 4 of the MEG visual tutorial: Group analysis (BIDS) tutorial (with exception that I only had the one acquisition run per subject).
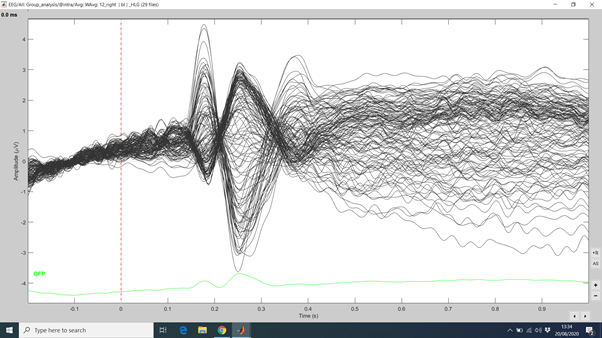
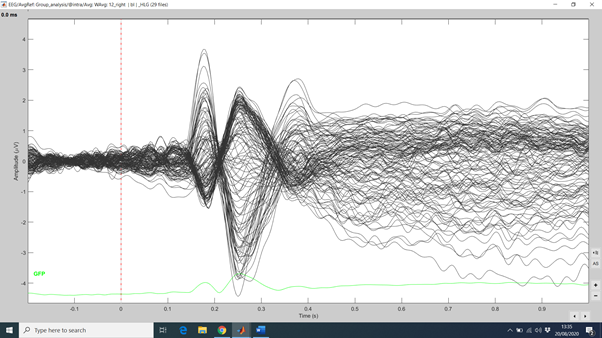
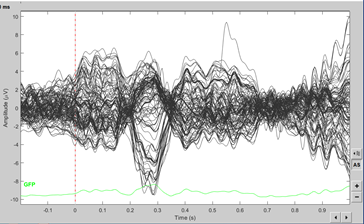
I copy two screen captures below of a grand average for one of the groups. In the first image, without the avg ref, the channels are slanted upward from before 0 ms. In the second image, with avg ref, the bottom and peak of the ERP shift downwards about 0.8 uv and channels pre-0ms are flat. The same difference with avg ref is there for the other group too on the same outcome.
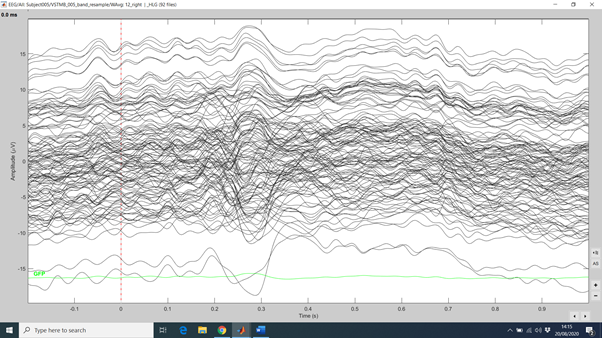
I applied a high-pass filter of 0.5 Hz (and low pass of 30 Hz). This was the first thing I did to my raw files. The third image below is an weighted average of one epoch for one subject with DC offset correction. You can see in the following image which had the DC offset correction that there was a huge difference. I applied the DC offset after importing epochs from raw files.
I averaged the epochs within subjects (selecting the weighted average option)
This has no effect if you have only one recording session per subject, as all the trials have the number of average. It makes sense only if you are (as in the tutorial) averaging together run-level averages with different numbers of trials within one subject.
I applied a high-pass filter of 0.5 Hz (and low pass of 30 Hz).
Then you should not apply additional baseline correction ("DC offset removal"). A high-pass filter at 0.5Hz ensures that over a window of 2s, the average value for each electrode is zero. This is somewhat redundant but more stable that the removal of the average over a short baseline.
(I'm not sure I understand what you illustrate with all the screen captures, it would be easier to follow if they were labelled individually)
I'm not sure about applying an average reference after computing your grand average. You could ask this questions, and maybe your other questions about baseline corrections, to EEG experts (like to EEGLAB community, or authors of your reference publications). If you get any interesting feedback, please share it here for helping other users.
Just to clarify, it was one acquisition run with a memory test that had one hundred trials per outcome. I only included those trials where the participant gave a correct answer so the number of trials vary from subject to subject. Following your response I assume that weighted subject average is the correct way.
I've labelled the images for clarity. I included the images regards the DC offset (images 3 and 4) to illustrate the difference this made even after a high-pass filter. Thanks for your help. I'll check those sources.
grand/group average without the second avg ref
same image as in 1 but with second avg ref
weighted average of one epoch for one subject without DC offset correction
If you follow the guidelines of the group analysis tutorial, the weighted average is used only for averaging different run-level average together (if you have only one run, then there is no weighted average possible), and across subjects we did NOT use a weighted average not to introduce any bias towards a given subject, but the imbalance between subjects should not be too large. .
looks ok
if you force the all the values to be centered on zero, then of course, it would look "more centered on zero", but what is your justification?
This looks unlikely that you applied a high-pass filter at 0.5Hz on this data
=> "weighted average of one epoch for one subject": there is some terminology issue here - if this is one epoch it is not averaged, if this is an average of single trials for one subject, it is not weighted by anything (or more precisely, the weight is 1 for all the files, so it is the same as a regular average)
My first step after importing raw files was the band-pass filter using the script below. I then resampled. I obtained a new folder with a new raw file titled 'Raw | band(0.5-30Hz) | resample(256Hz)'.
I maintain that I don't understand how the screen capture above could be a signal filtered between 0.5 and 30Hz with Brainstorm. All the signals, over the time period you defined here [-200ms, +1000ms], should appear more or less centered on zero.
Make sure this is coming from the correct file (that you didn't epoch from the original file instead of the filtered one), that there were was no error in the processing (check the execution reports) and that you didn't apply anything else after this filter+resample.
Try to reproduce these results with the interactive interface, instead of using a script.
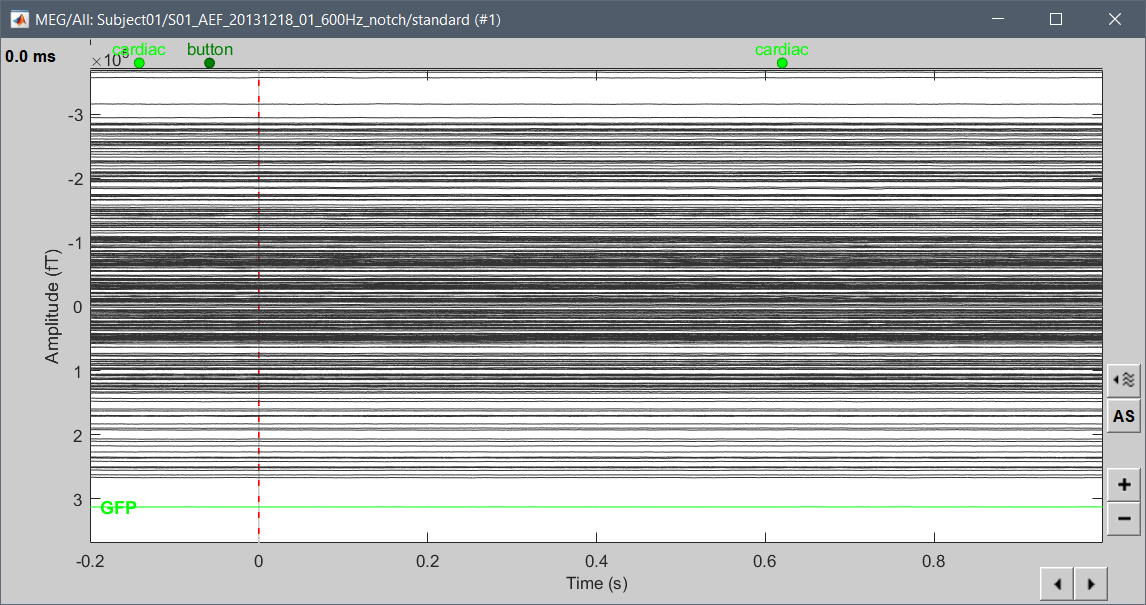
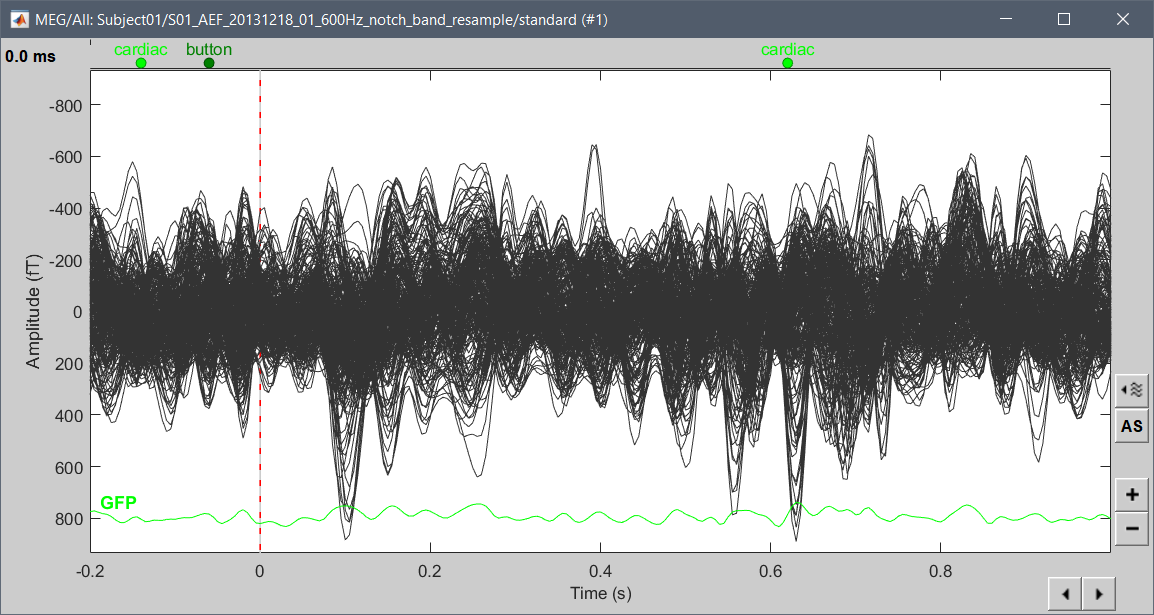
Here is the example of what the MEG signals of the introduction tutorials looks like before (raw signals) and after the filter you described + a resampling from 600Hz to 200Hz.
I had a look at this on one subject using a new protocol. For this subject I created three 'subject' folders. For the first, I imported the events directly from the raw file. For the second I applied a band pass filter 0.5-30Hz then imported. For the third, same band pass + resample 256Hz then imported. I averaged the imported epochs for all three. Looking at these averages the resample makes very little difference, but the band high-pass (0.5Hz) doesn't seem to have been effectively applied for the second or third files.
For the second and third folders when I apply the filters available on the interface filter tab (the one for visualization purposes), the low-pass (30Hz) makes very little difference to the averaged file but the highpass (0.5Hz) makes a difference similar to the first file and similar to what you illustrated in your previous post and to what I found with the DC offset correction. I did all this using the interface and not scripts as you suggested.
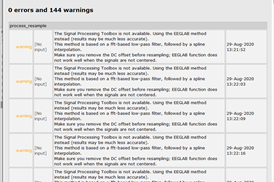
Also, after the resampling I get the below message. Is this something I need to fix?
Looking at these averages the resample makes very little difference
Visually it should not. Computationally, the signals are heavily altered.
but the band high-pass (0.5Hz) doesn't seem to have been effectively applied for the second or third files.
Have you found out why?
Make sure you didn't ignore some important warning messages when trying to apply the filters. A good practice, as instructed in the introduction tutorials, is to compute a power spectrum before and after filtering to make sure the effect is really matching the expectation: https://neuroimage.usc.edu/brainstorm/Tutorials/ArtifactsFilter
If you haven't read all the introduction tutorials, it's a good time to follow them from the beginning using the example dataset, and then to read the EEG/Epilepsy tutorial for additional details about EEG.
the low-pass (30Hz) makes very little difference
Indeed, it should not make much difference for ERPs. However, if you don't see any difference on continuous raw recordings, you might have a frequency filter that was already applied during the recording or the export of the signals. Try to get rid of this before processing the signals with Brainstorm.
For the second and third folders when I apply the filters available on the interface filter tab (the one for visualization purposes)
You understood that these filters are not applied to the files, right?
Also, after the resampling I get the below message. Is this something I need to fix?
Yes, this is something you need to fix: if you don't have the signal processing toolbox, don't try to resample your signals. Or, work with the compiled version of Brainstorm, which includes all the toolboxes but won't let you execute your own scripts (follow the instructions "Without Matlab" on the installation page: https://neuroimage.usc.edu/brainstorm/Installation). You could use it only for processes that require the signal processing toolbox.
I think the issue for the bandpass was the same as for the resample - the signal processing toolbox. I assume both the processes require this toolbox? I had it installed with MatLab but it wasn't being applied. I selected File > Edit preferences>“Use Signal Processing Toolbox” and this seems to have fixed it
I ran the bandpass filter again and got the results expected for a highpass 0.5Hz filter. After re-running the resample I got no error message.
I figured that if the bandpass filter had worked then the visual filter set to the same frequencies would not make any difference to the appearance of the averaged (before the visual filter set at 0.5Hz made a big difference on the file after running a bandpass filter at 0.5&30Hz).
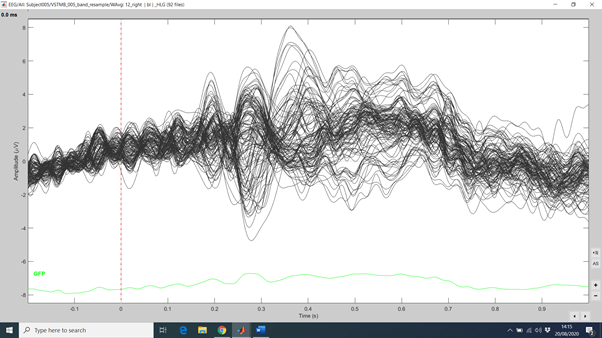
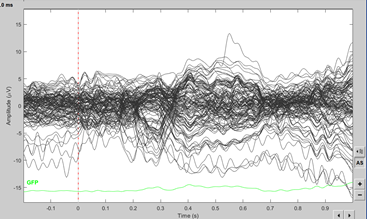
I re-ran the filter bandpass (0.5Hz and 30Hz) and resample (256Hz). I can see from the continuous files and compared to before that the high-pass filter was applied. I had a look at the PSD graph from before and after applying this process and I can see an alteration around 0.5 Hz for the after graph. I looked at some of the subject averaged files and for some of them I can see a difference when I set the visualization high-pass in the filter tab (set to 0.5Hz) (example images below).
Could you advise is this something I need to fix or is some difference to be expected? I assumed if the bandpass filter was effectively applied that using the filter tab set to the same frequencies wouldn't make any difference in the appearance of the image.
Average of singles trials for one subject after bandpass filter and resample
Same image as above but now with filter highpass set to 0.5Hz in filter tab