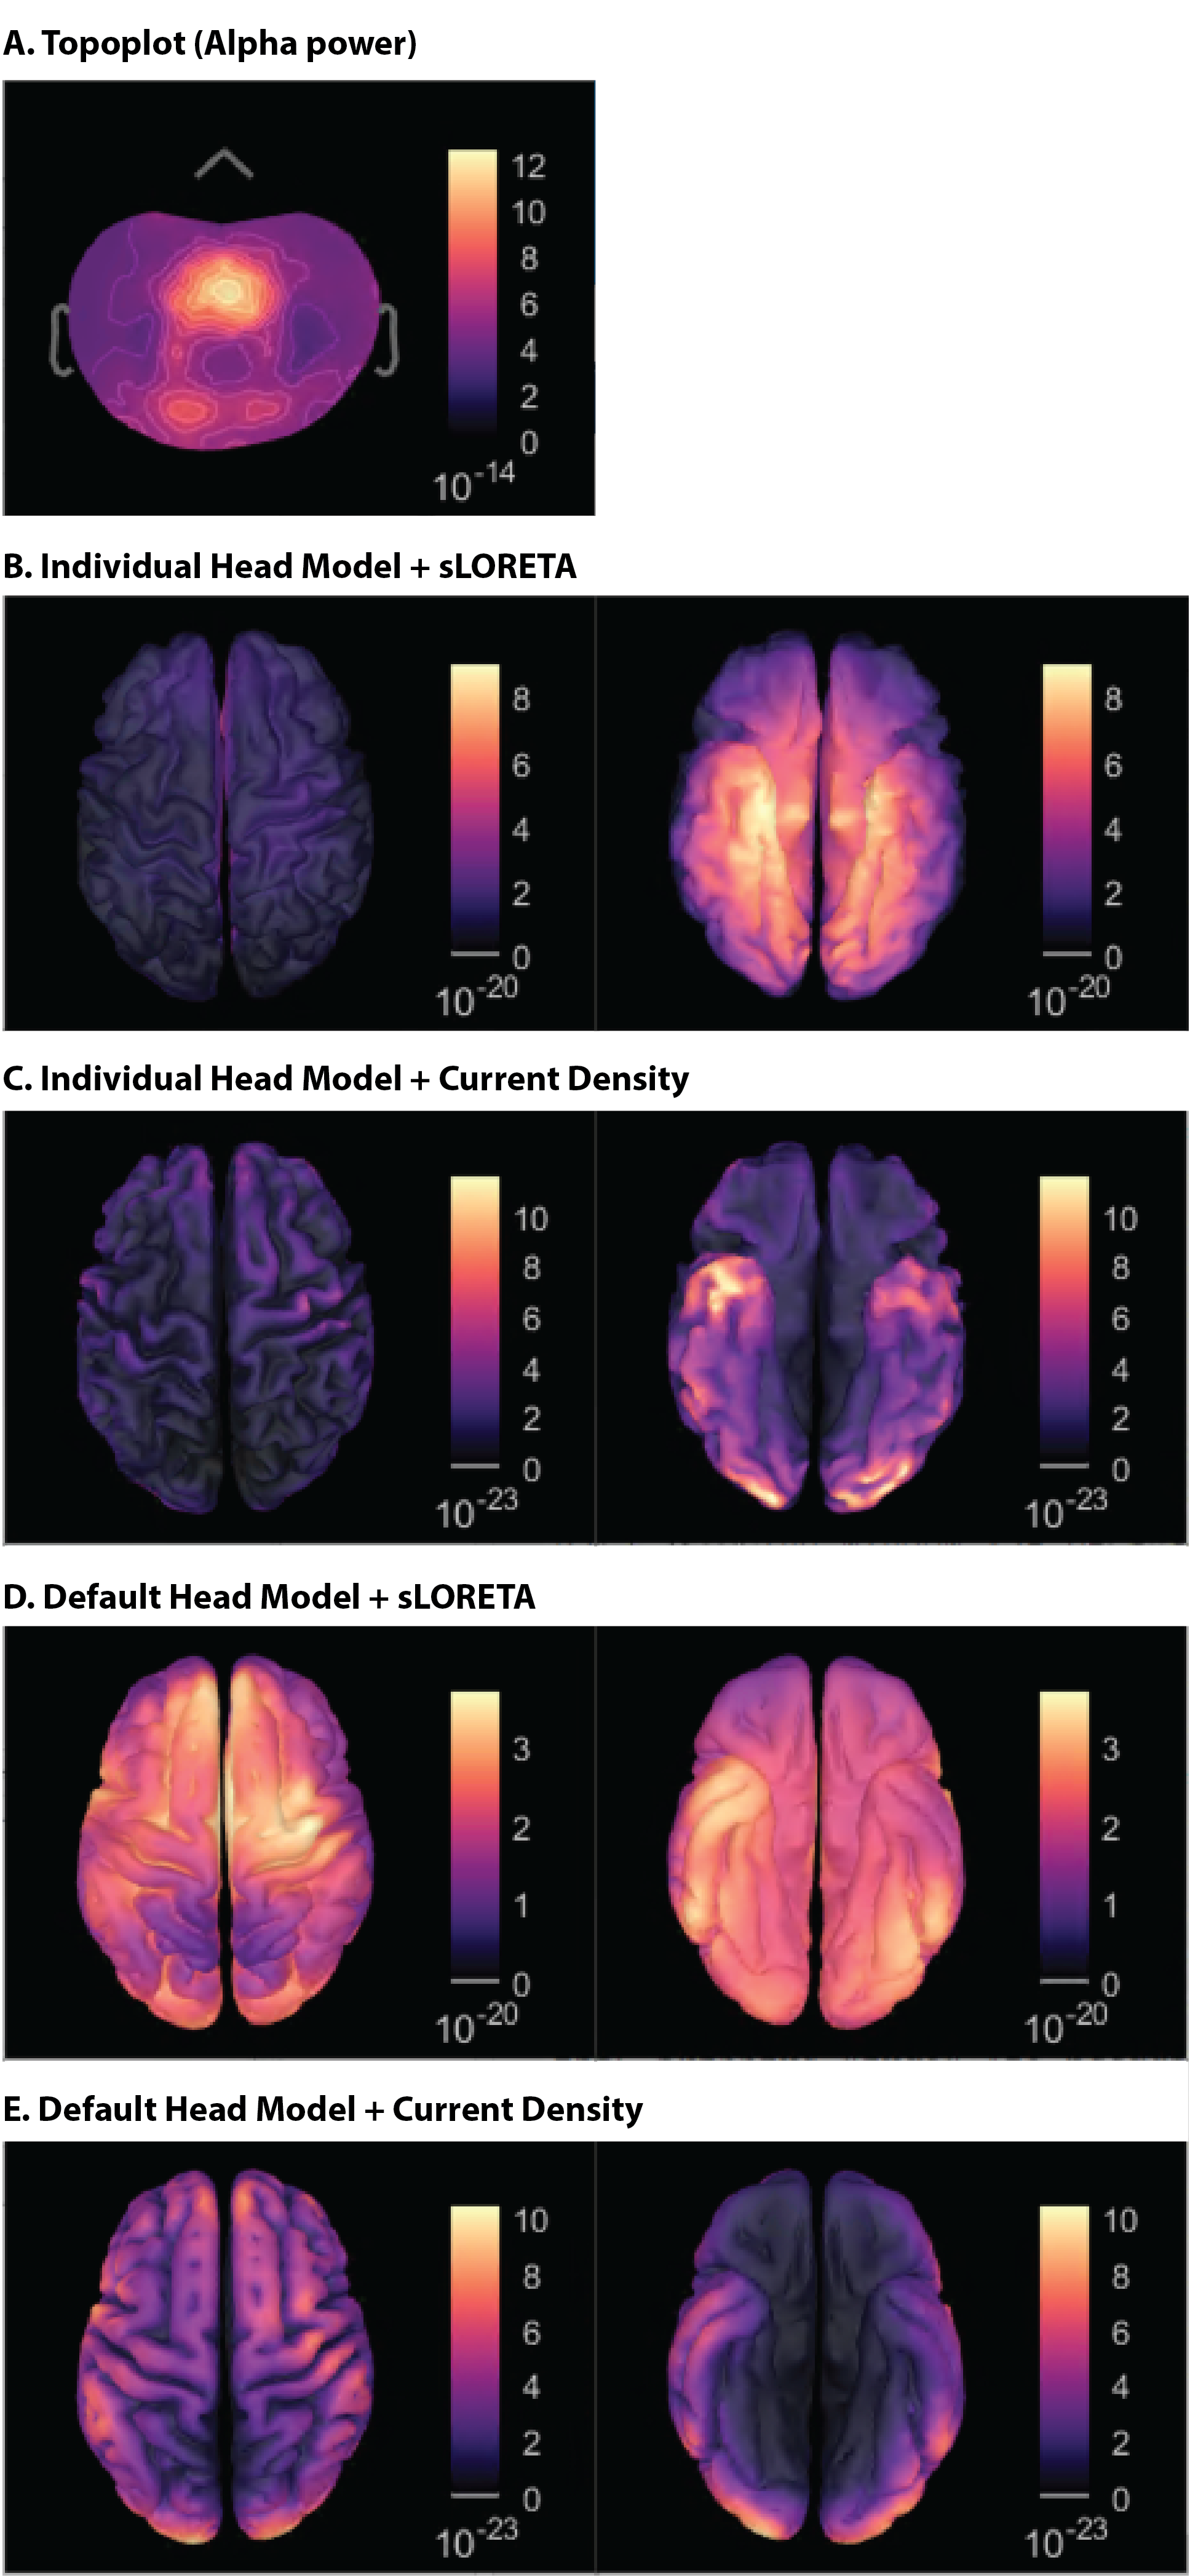
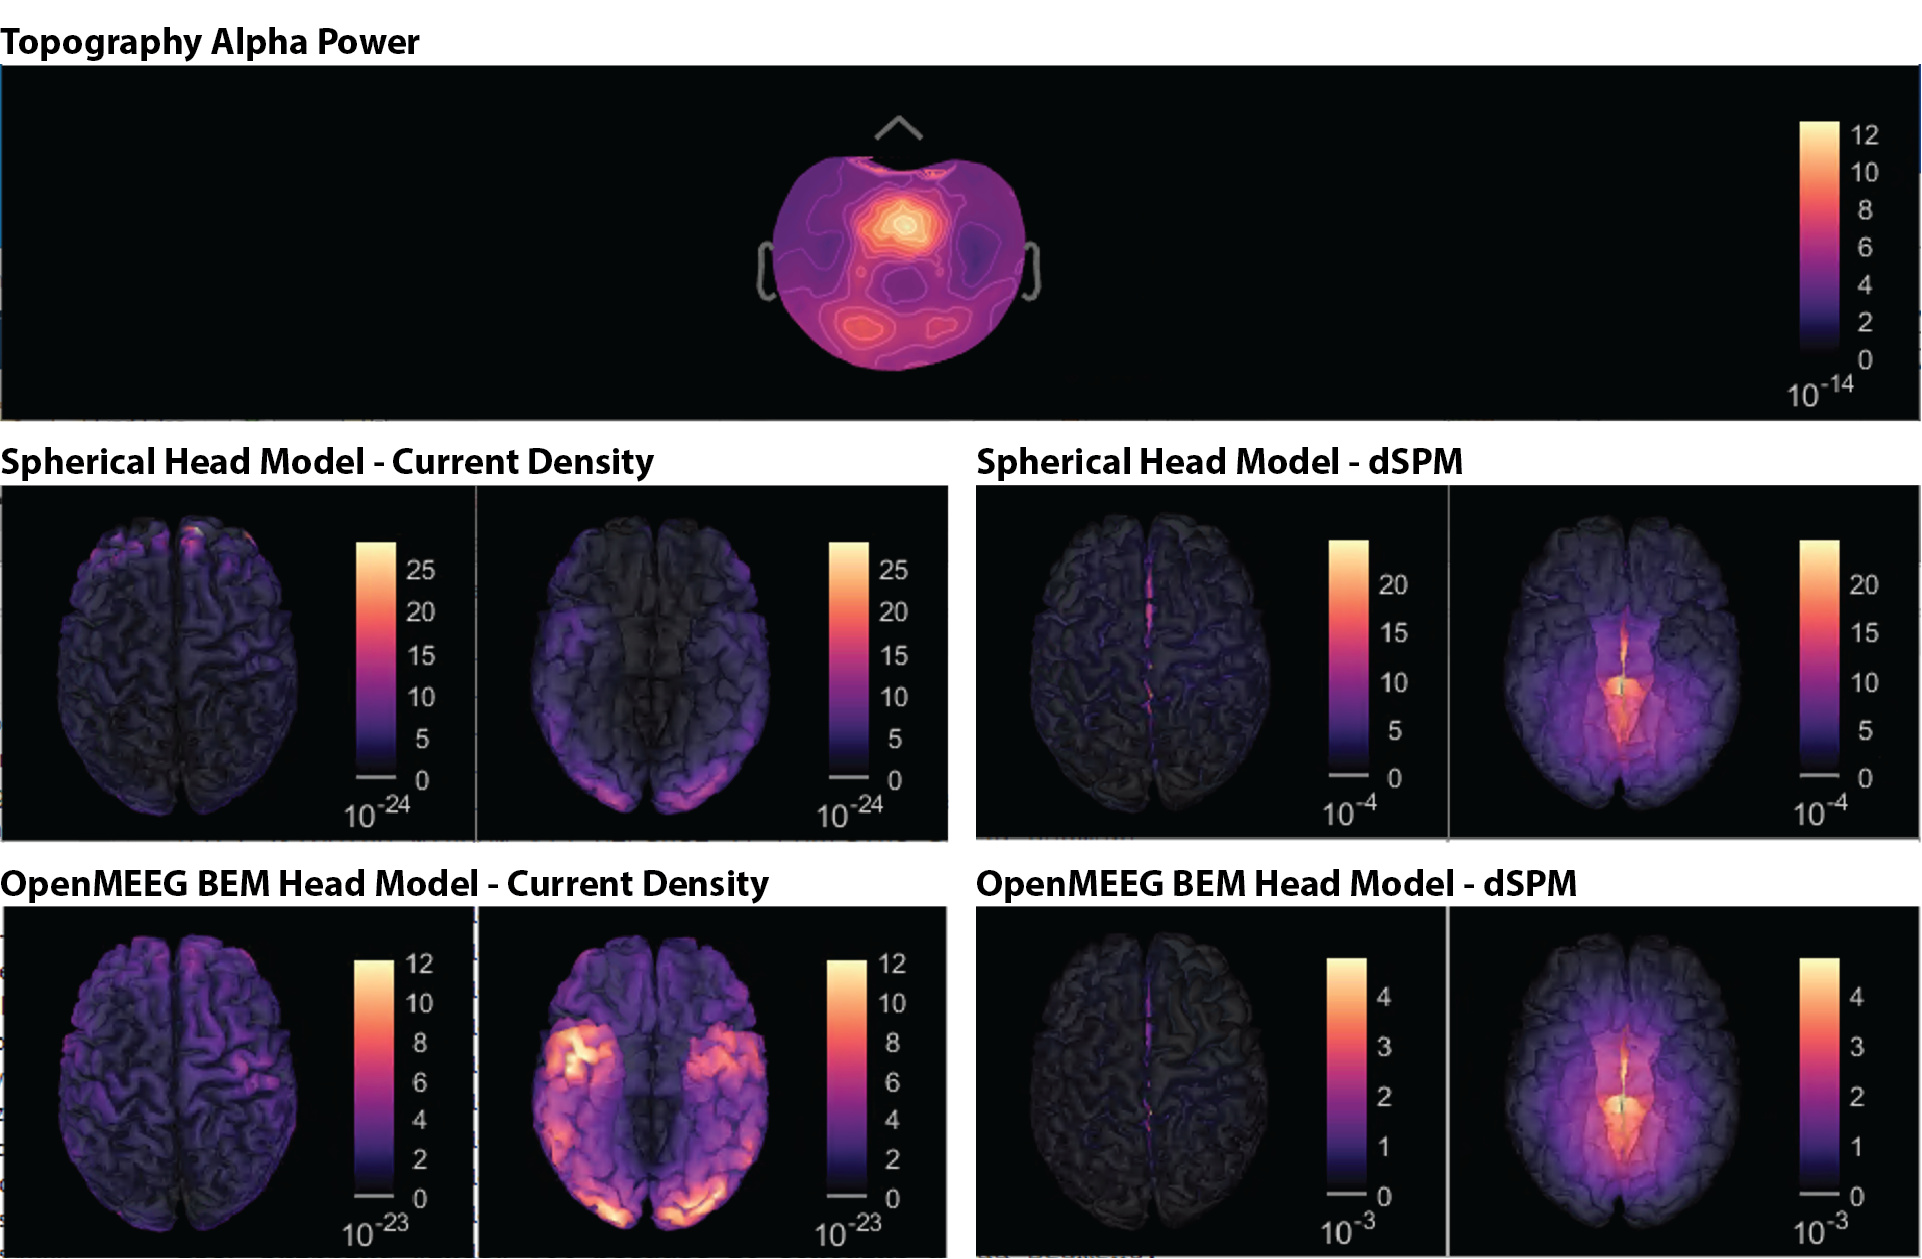
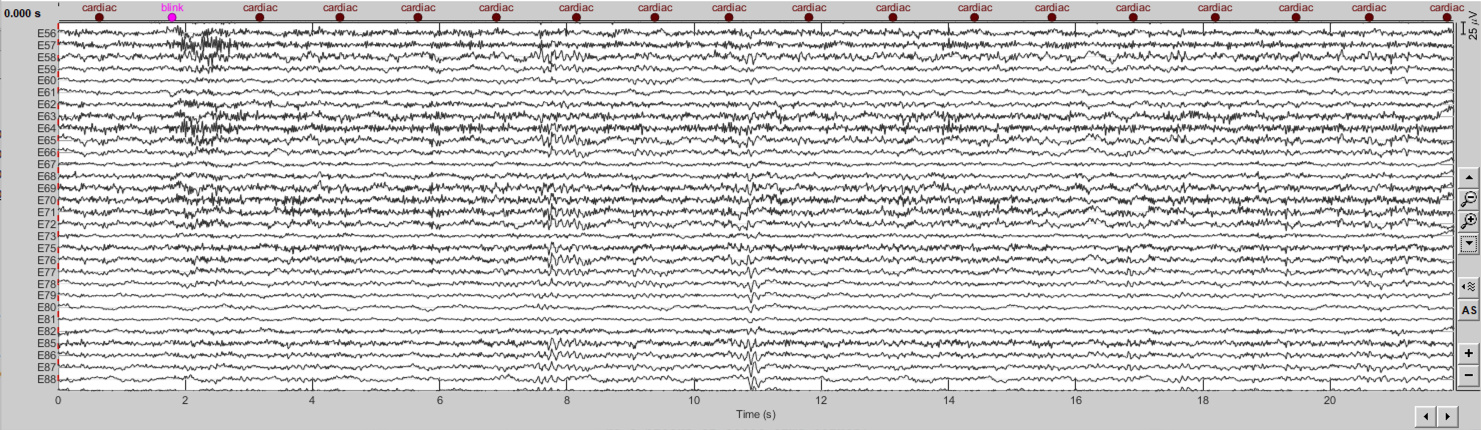
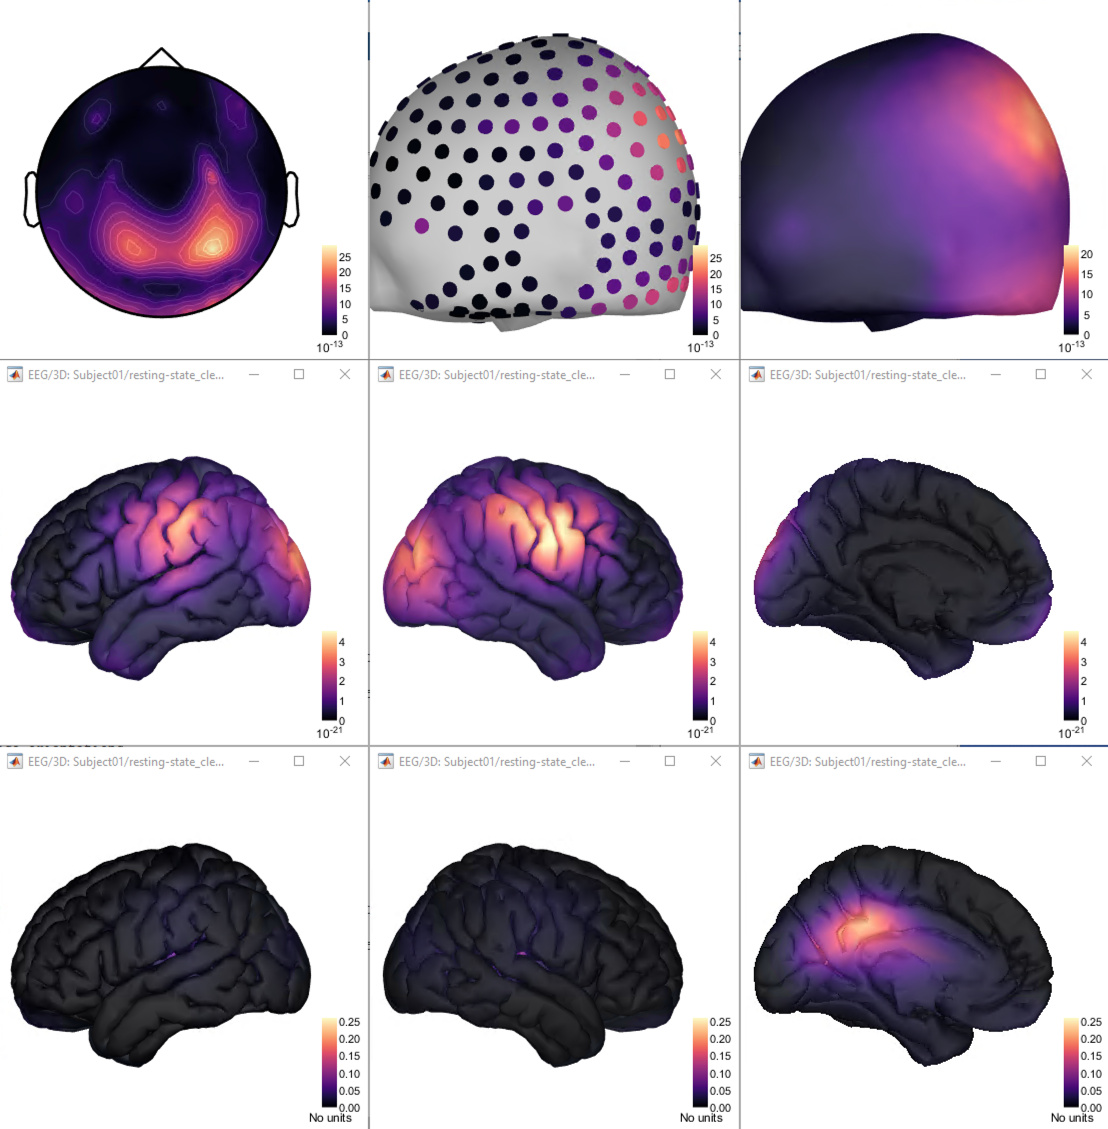
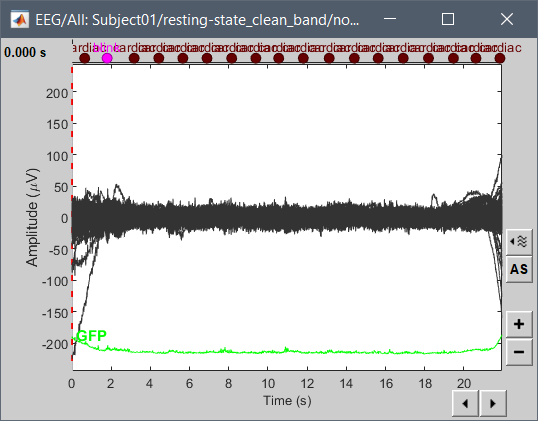
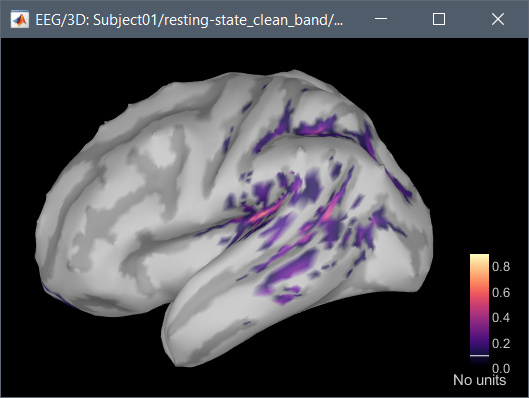
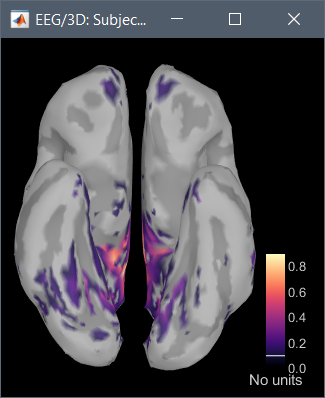
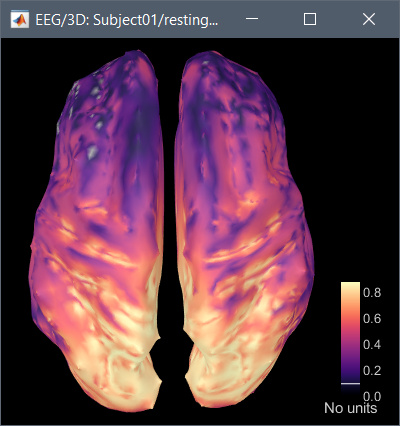
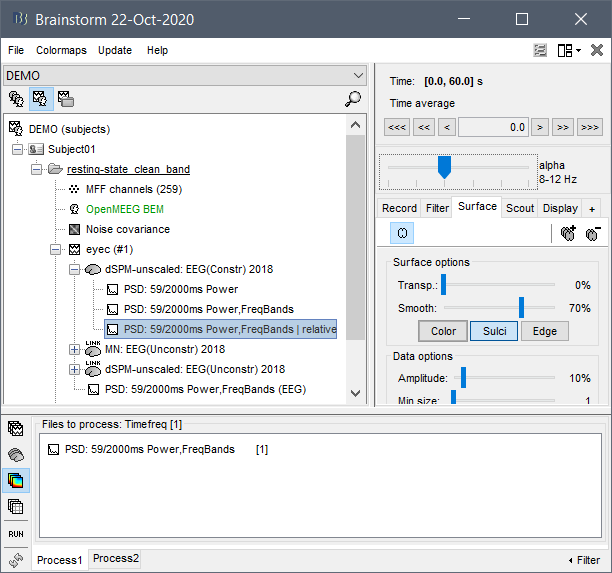
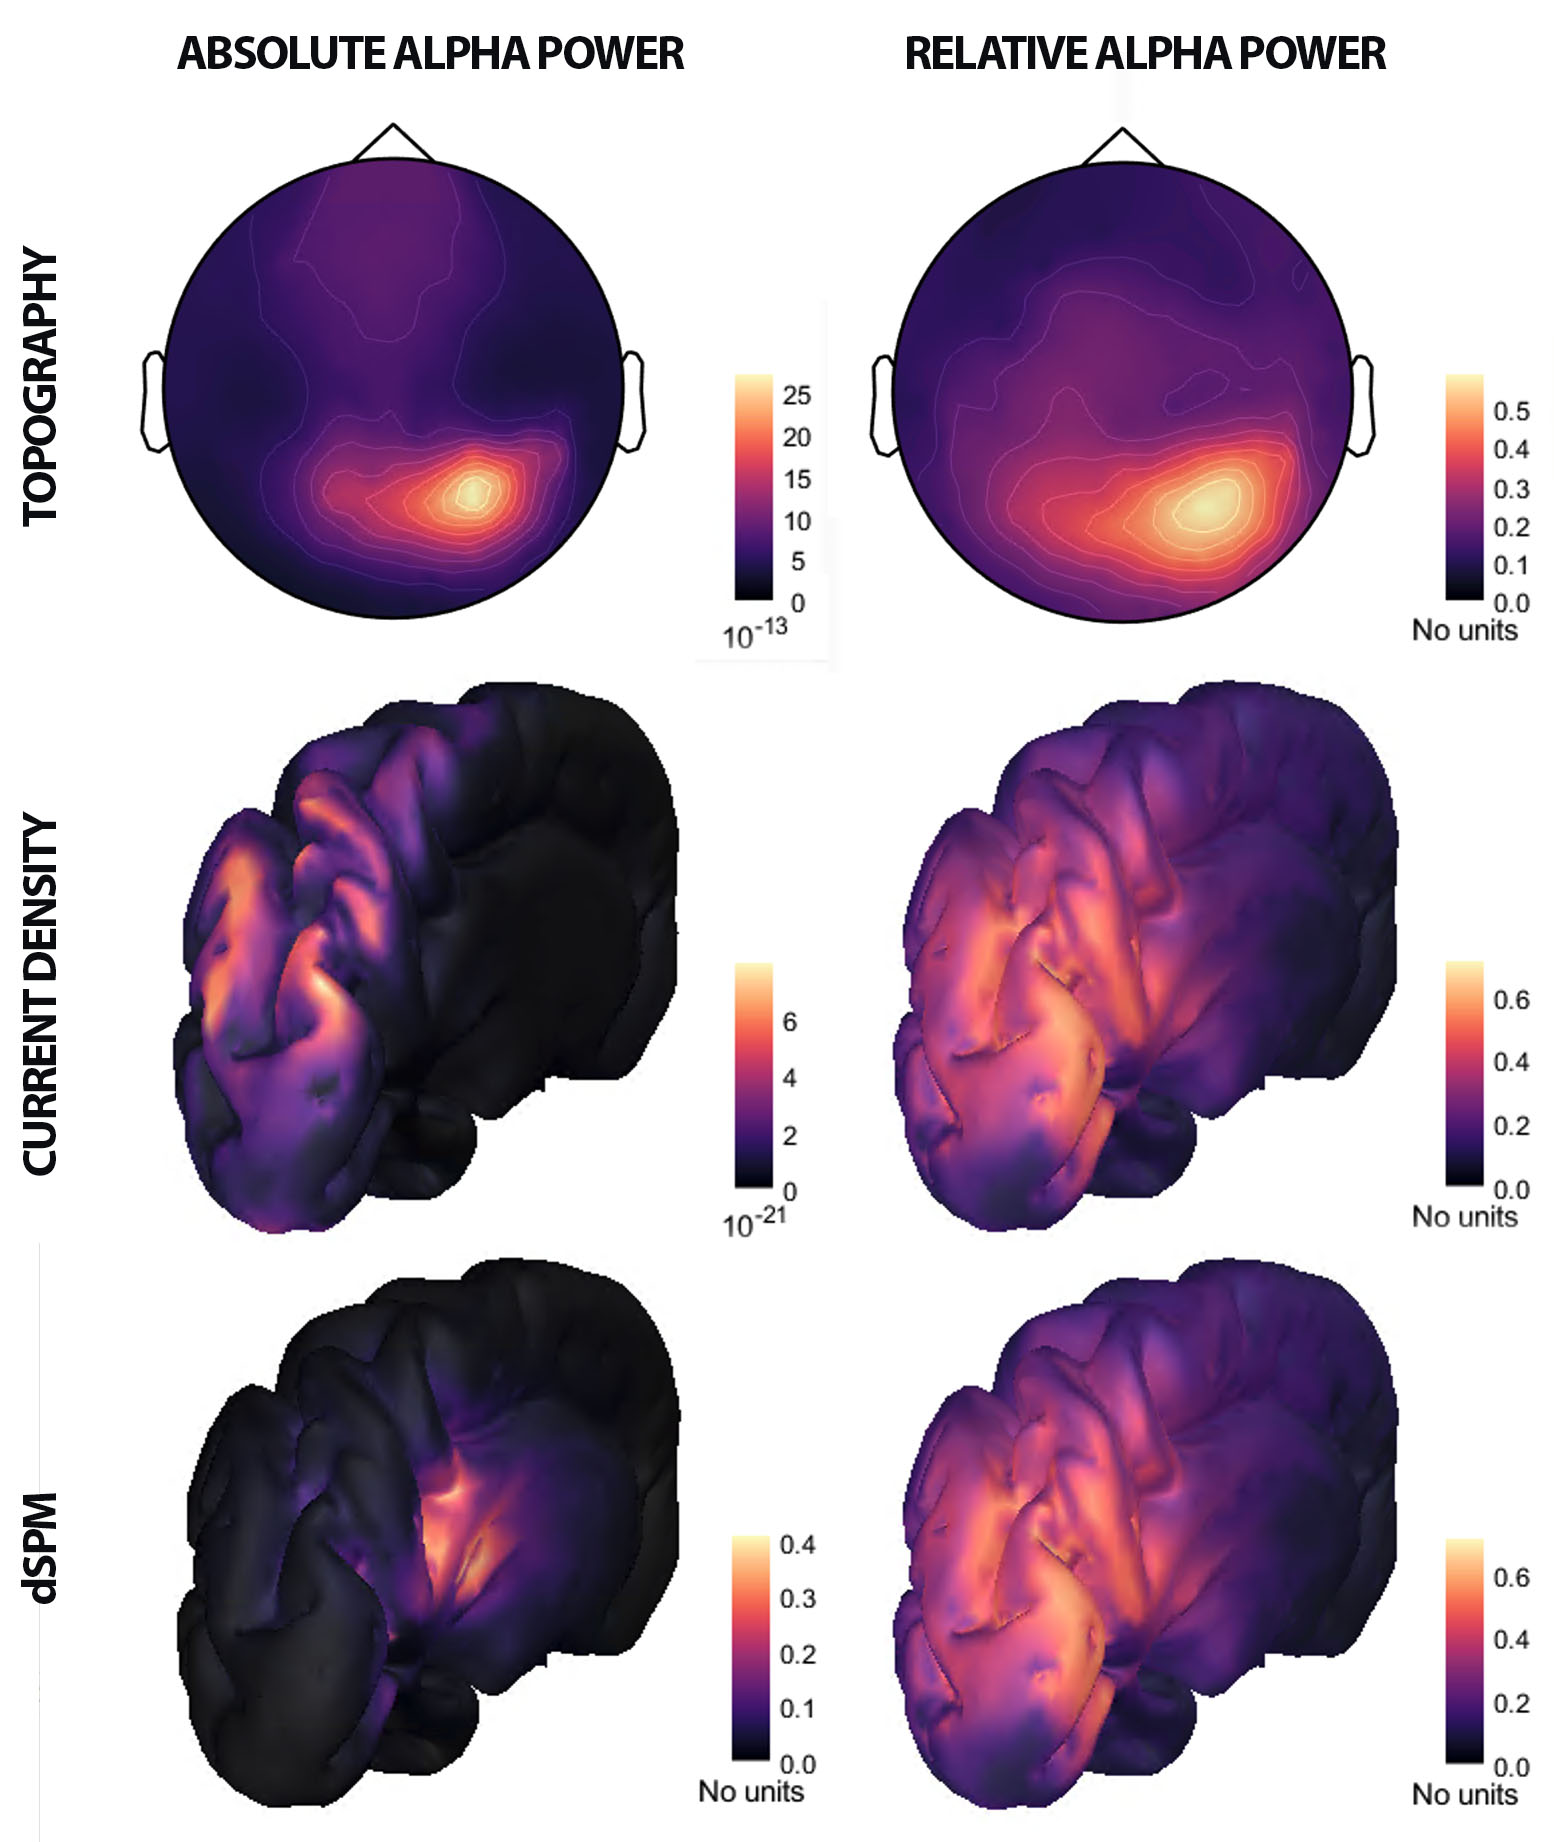
Hi, I have calculated the Power Spectrum in Frequency Bands in Source Space, according to the details below. But I don't trust the results, because the alpha power (8-12 Hz) maximum values are on the bottom of the cortex, but on top of the cortex they are very close to zero (see figure 1). Nonetheless, the power spectral maps in sensor space are very reasonable and look like there should be sources in a frontal/central region and occipital region (see figure 2). I don't know where to start to see where things may have gone wrong.
Thank you very much for your help!
Rick Wassing
University of Sydney
Figure 1
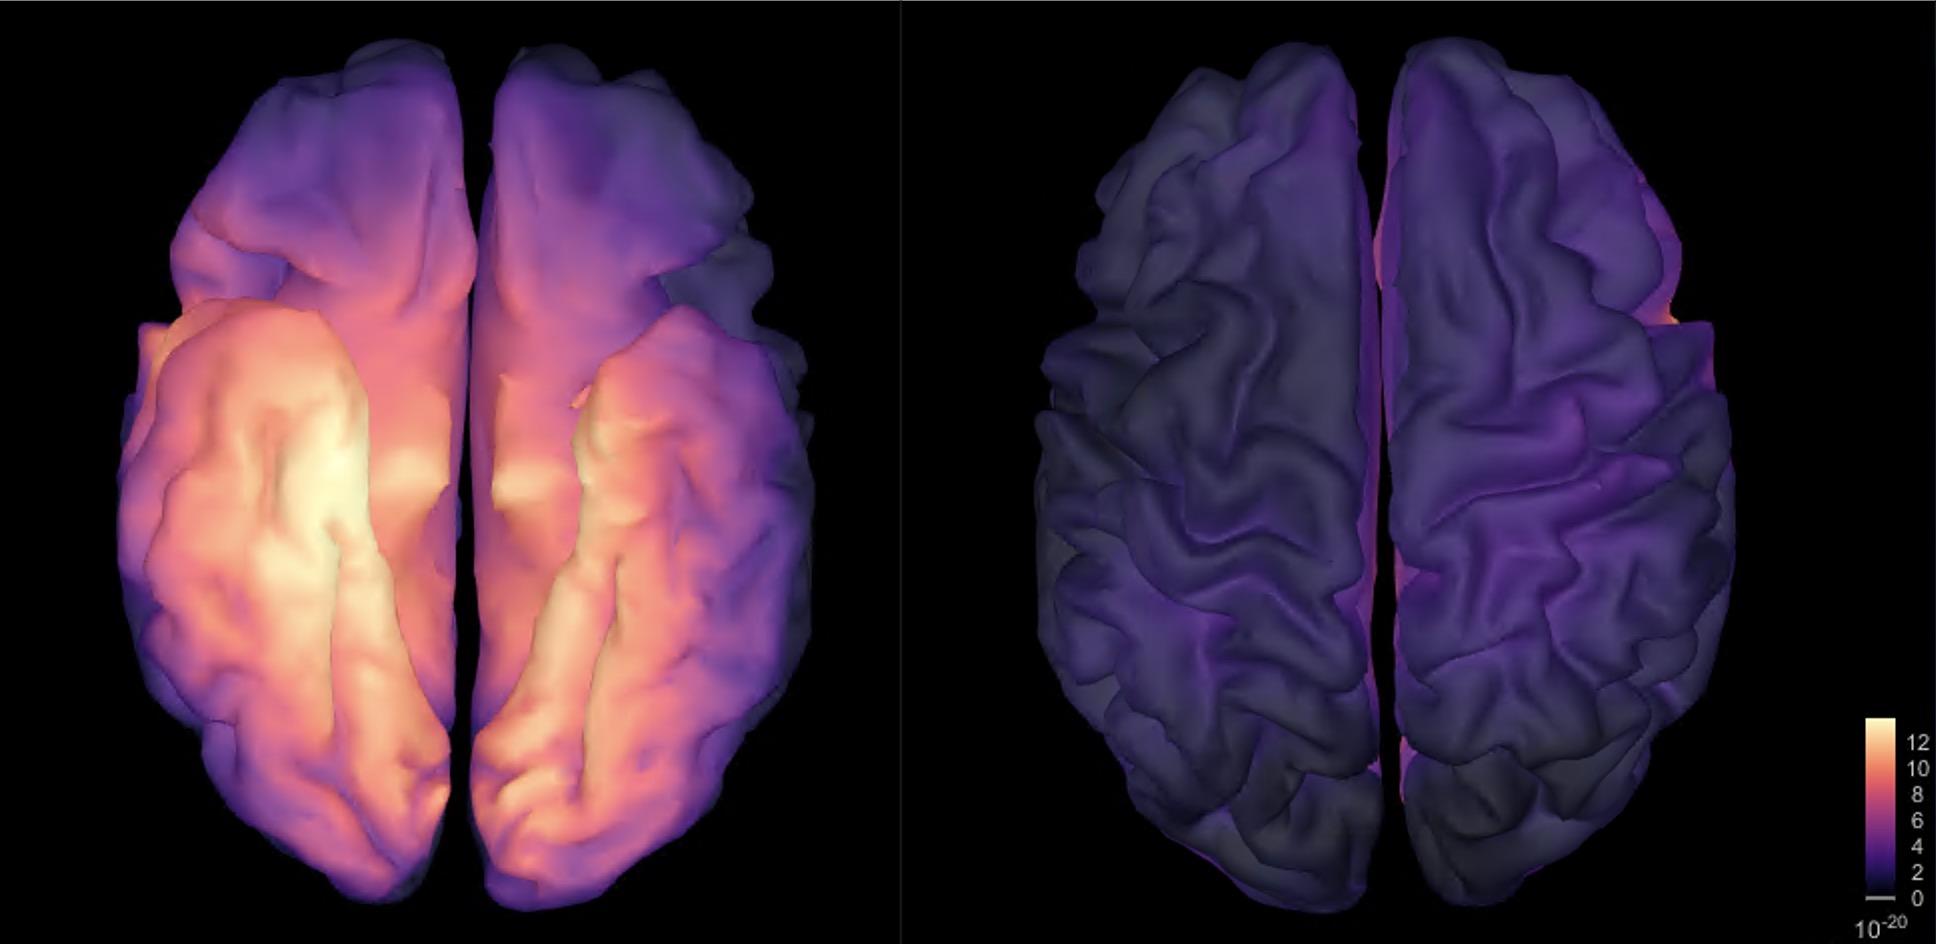
Figure 2
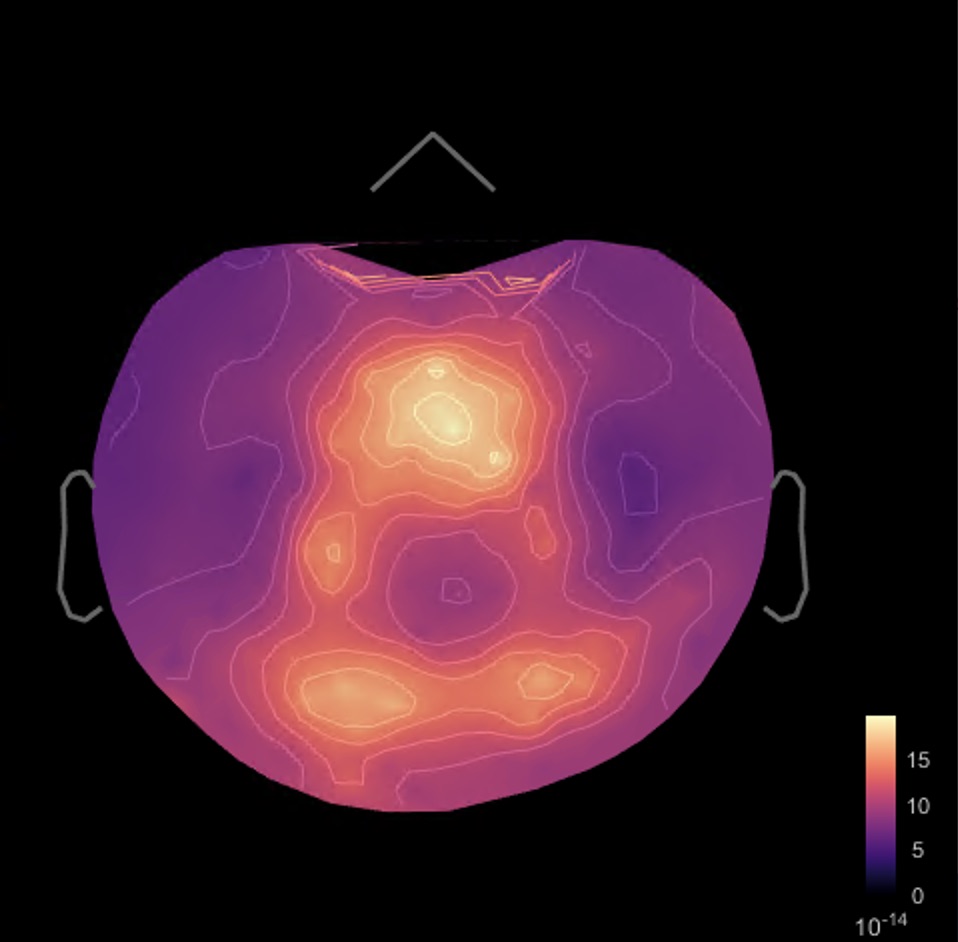
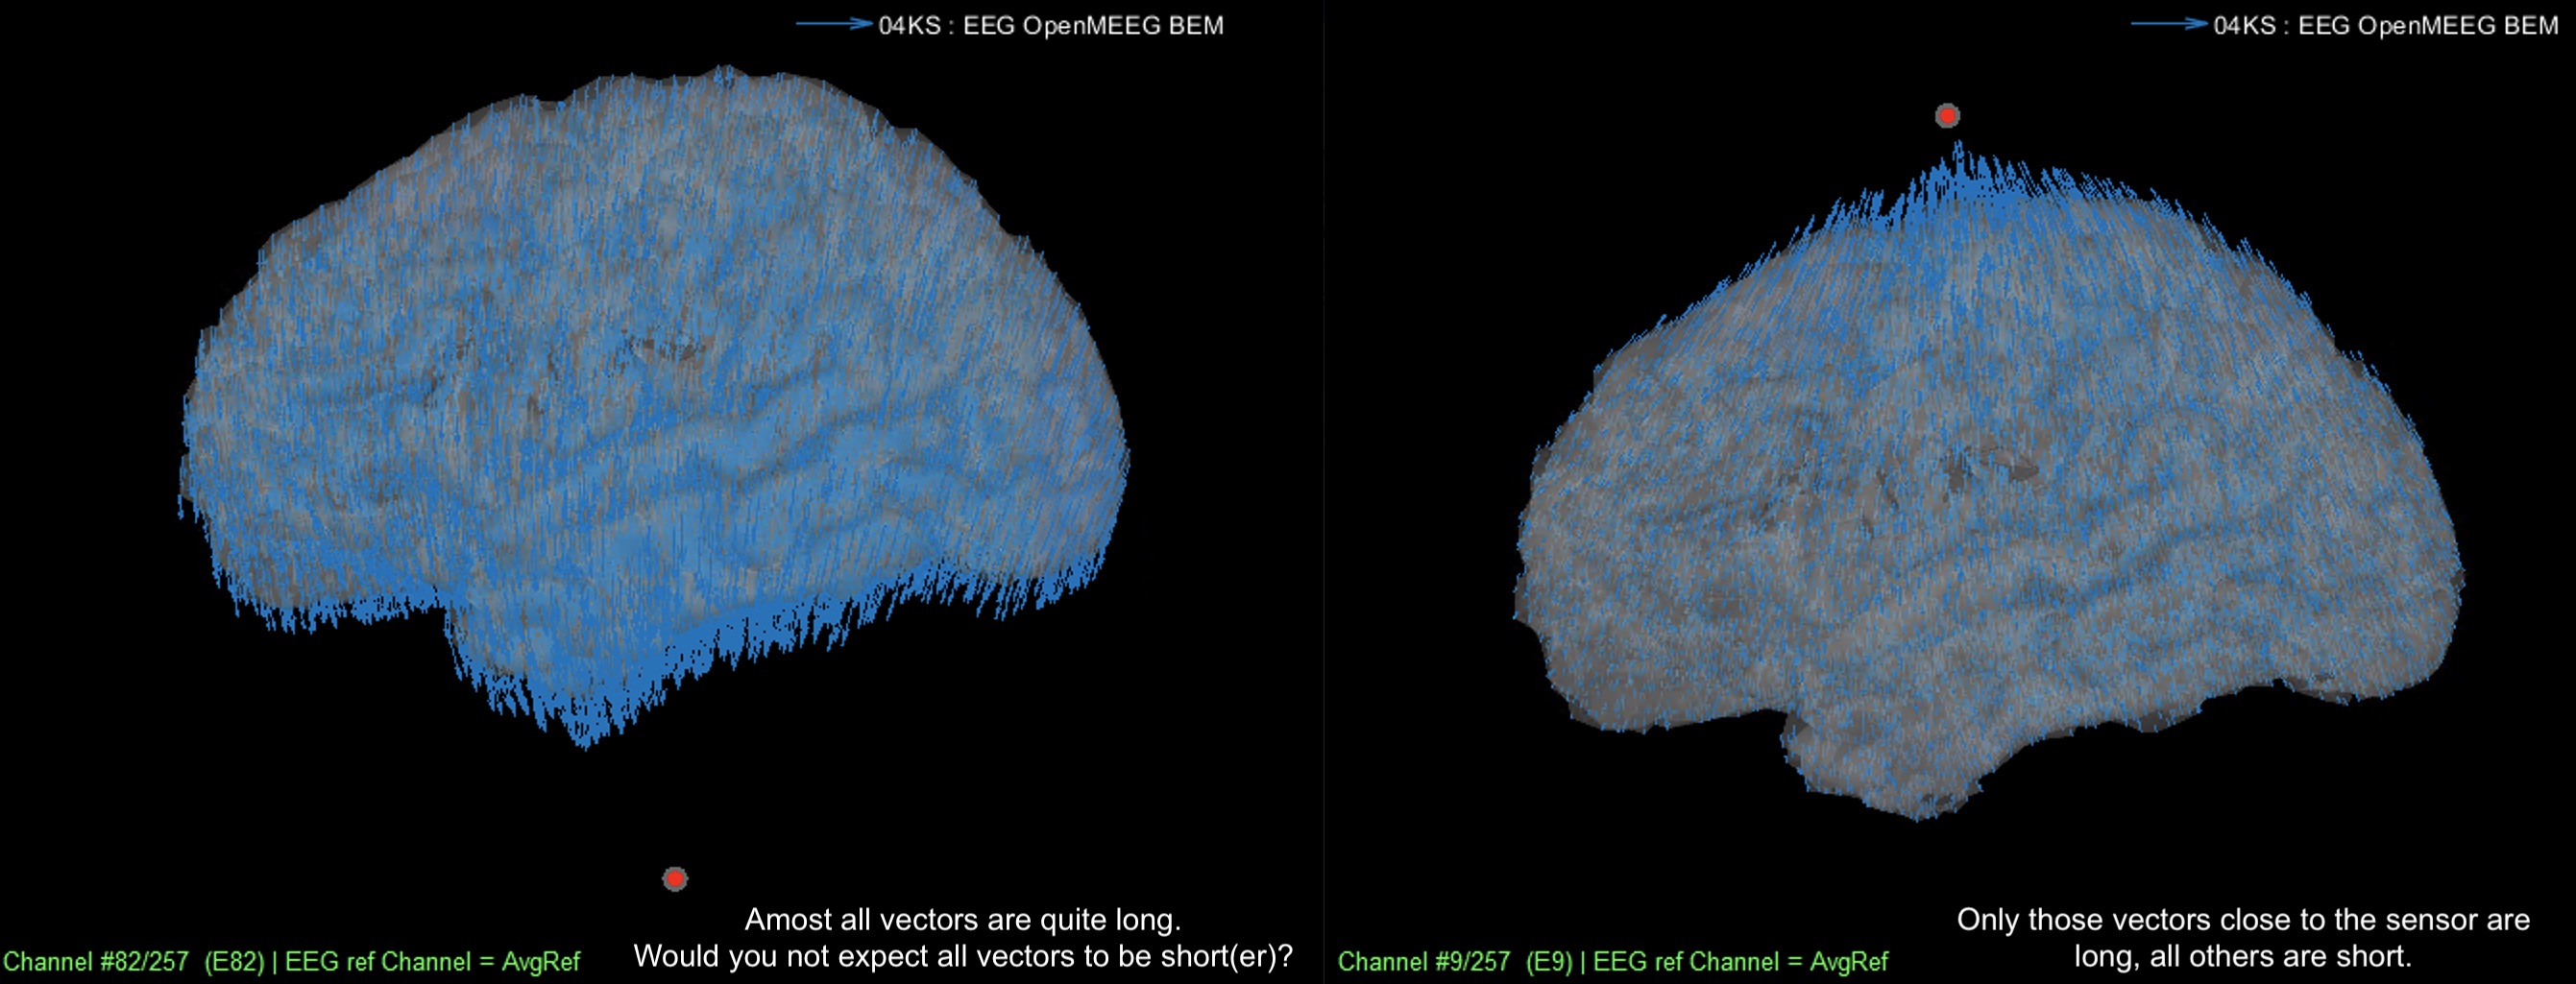
Figure 3
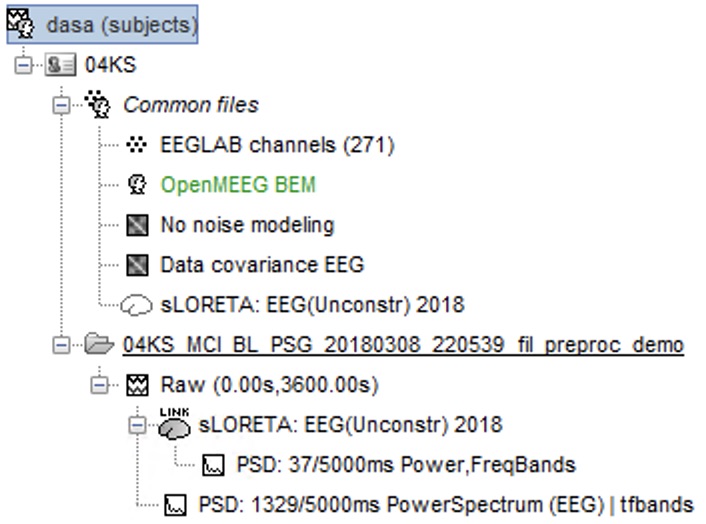
Pipeline
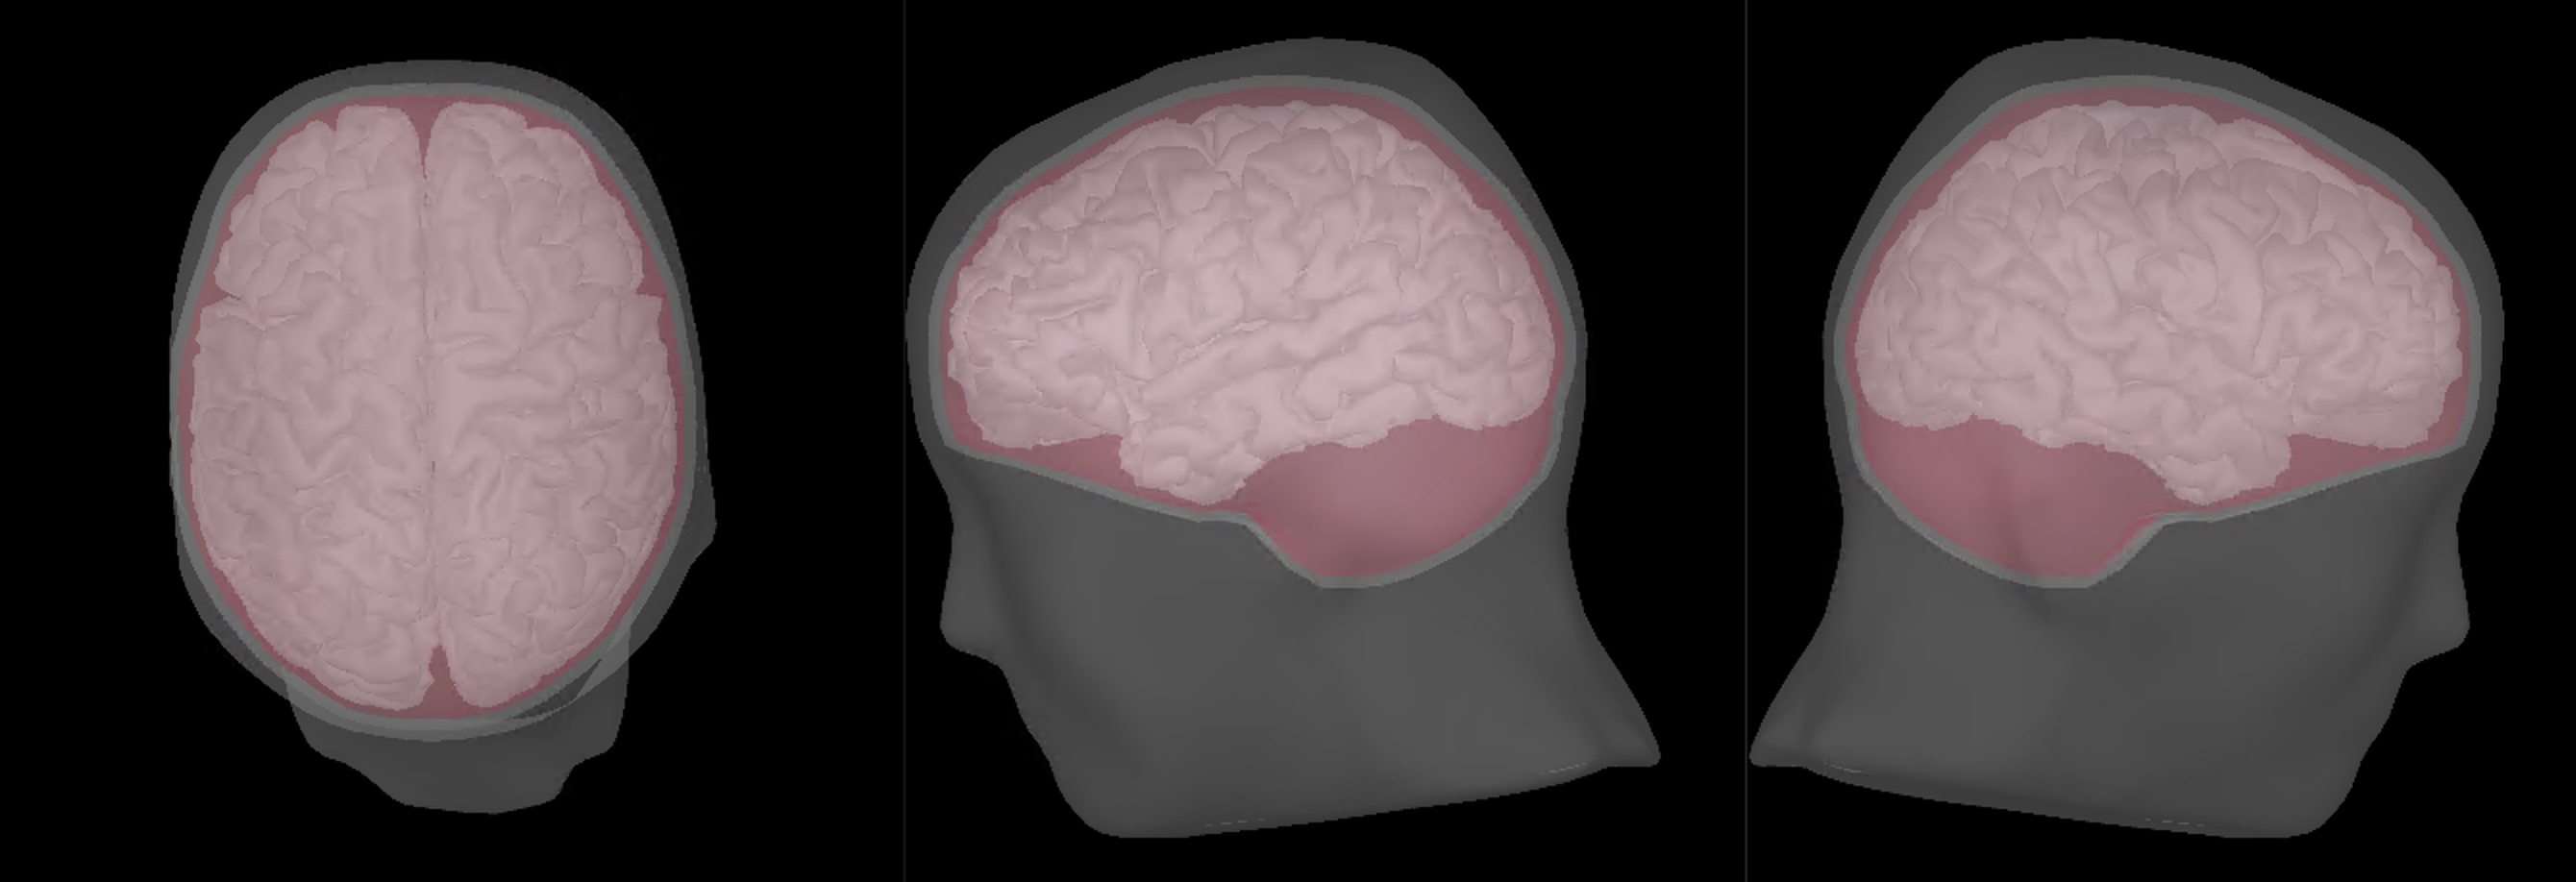
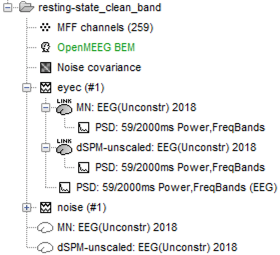
- Imported subject anatomy from FreeSurfer output (15000 vertices), checked the orientation of MRI was correct and marked fiducial points.
- Imported EEGLAB dataset of cleaned sleep-EEG data from stage NREM2 only (~1hr of recording) i.e. bad channels and bad epochs removed.
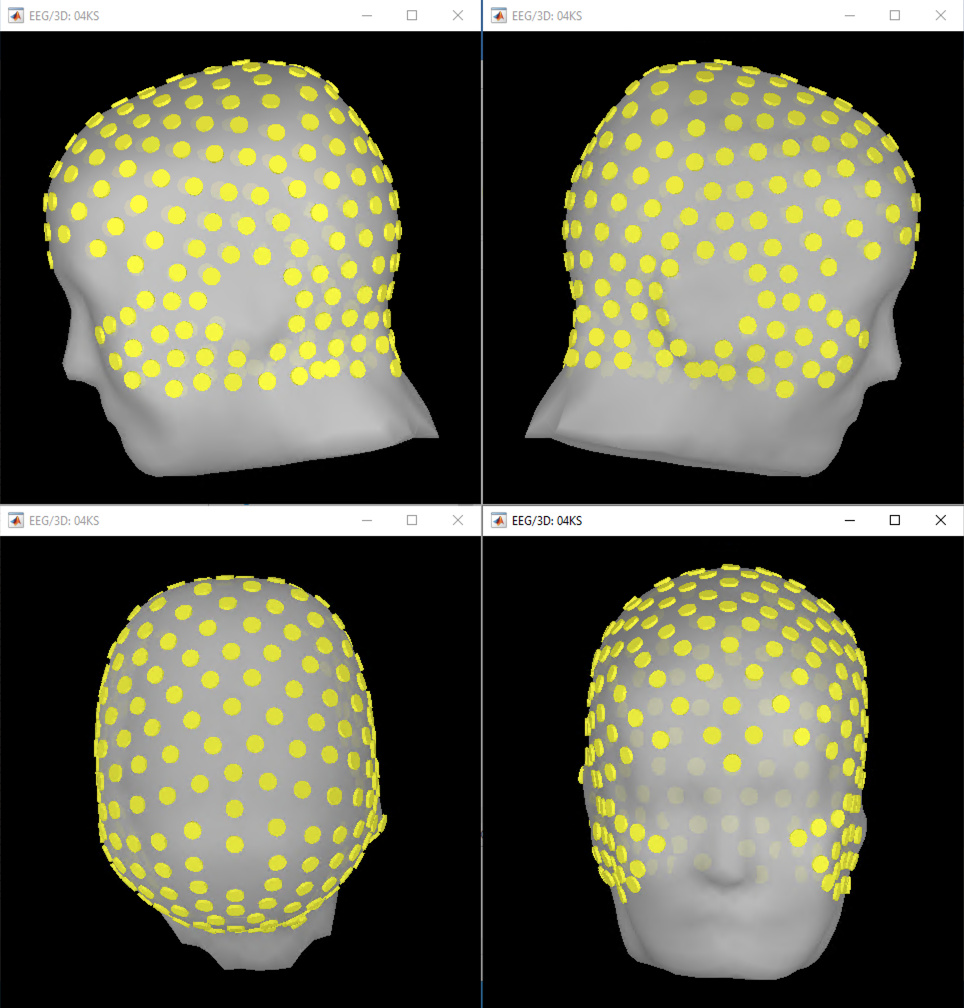
- Recorded channel locations (Geoscan device) loaded from EEGLAB structure were registered to the head mask using the MRI registration tool.
- Calculated OpenMEEG BEM Forward head model.
- No noise modeling (identity matrix) because this is a "resting-state" recording and no noise estimation can be performed.
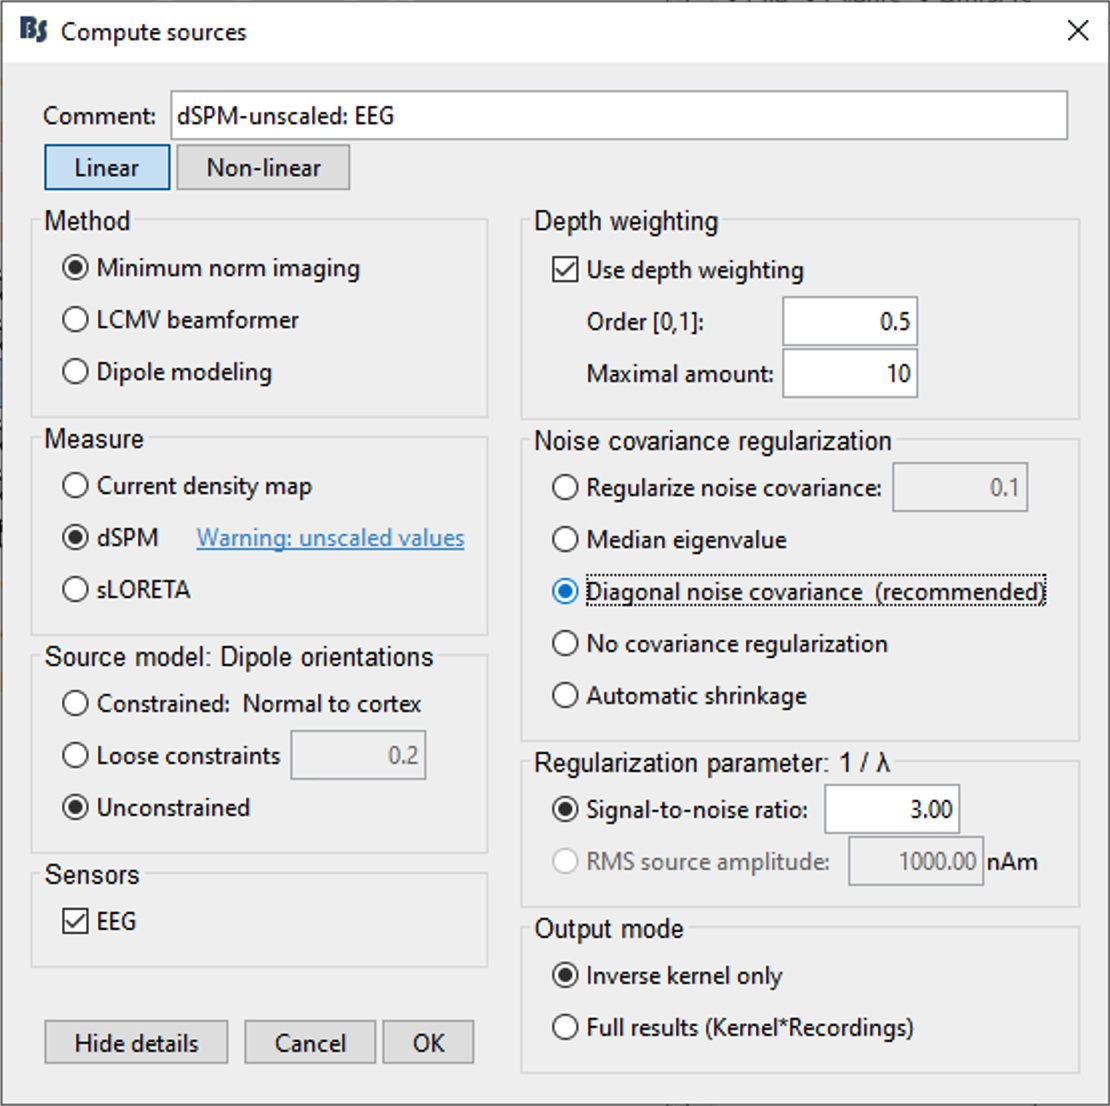
- Computed sources using minimum norm imaging, sLORETA (unconstrained)
- I then computed the power spectrum (Welch) on both the sensor-space and source-space data.