Hello,
I'm working on MEG data and currently processing statistical tests.
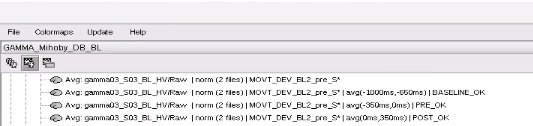
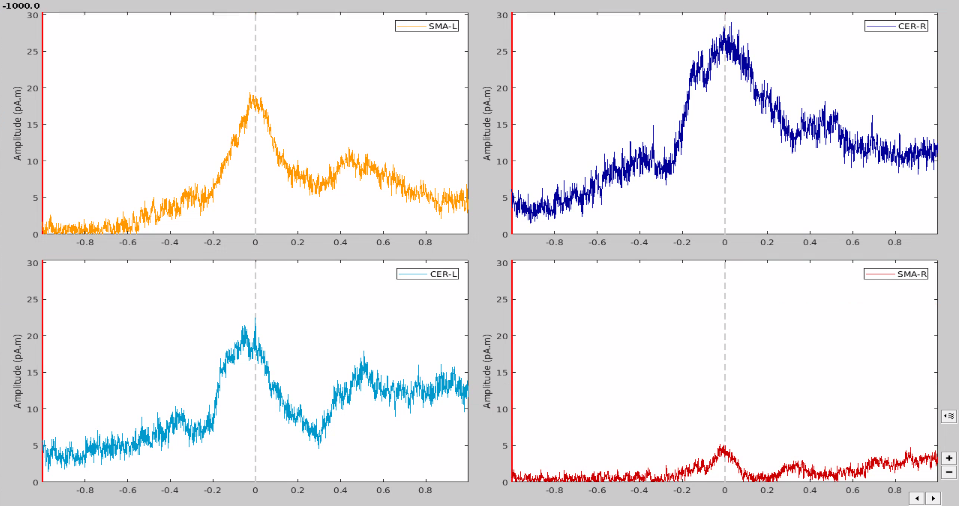
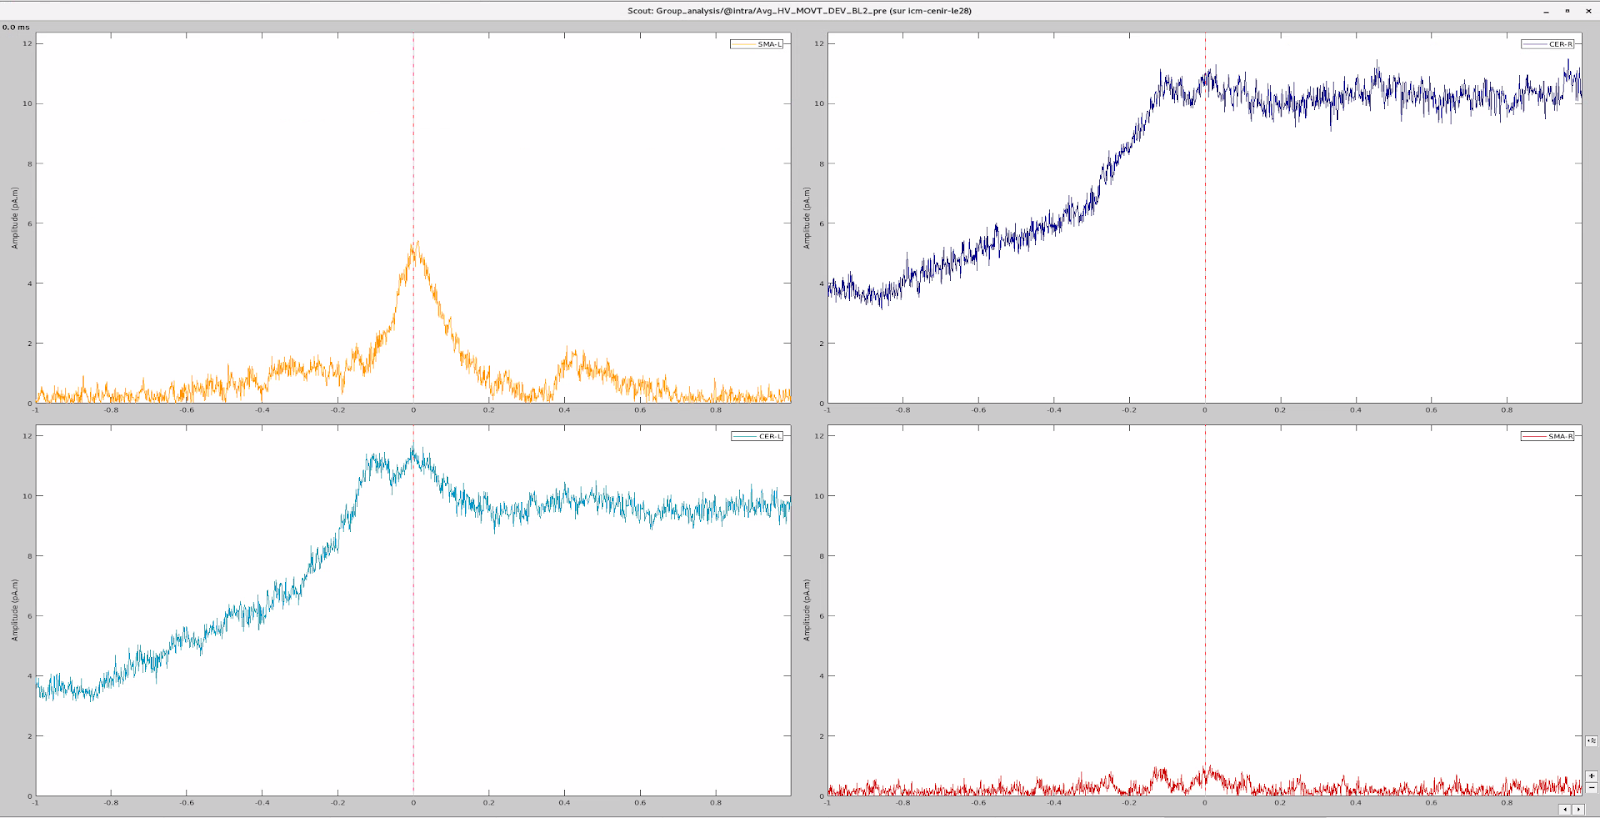
I have 4 scouts : SMA and Cerebellum, being both bilateralized. The period recorded is from -1000ms to 999ms for all scouts.
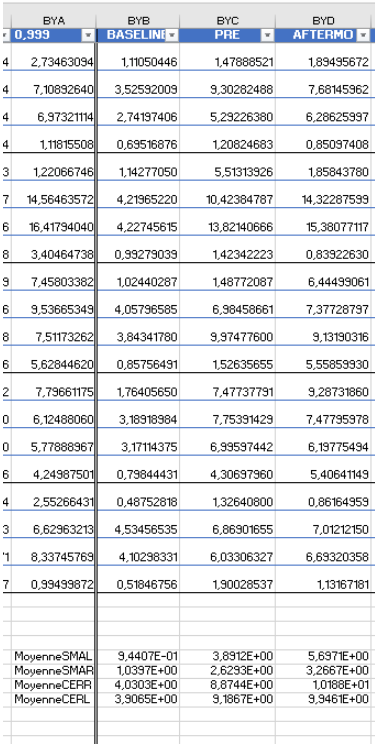
As Brainstorm can't perform a lot of statistical tests, I decided to extract the values from these 4 scouts for all my participants (2 groups of 16 participants), and stored them in an excel file (there was probably a much faster way to do it...) to then process it on Python.
At first glance, it seemed to me that the values extracted from both SMA and cerebellum were actually the ones being displayed in time series (in Brainstorm) for all the participants.
In the same way, looking at the average of the time series for one group of participants and the corresponding extracted values also seemed to be correct.
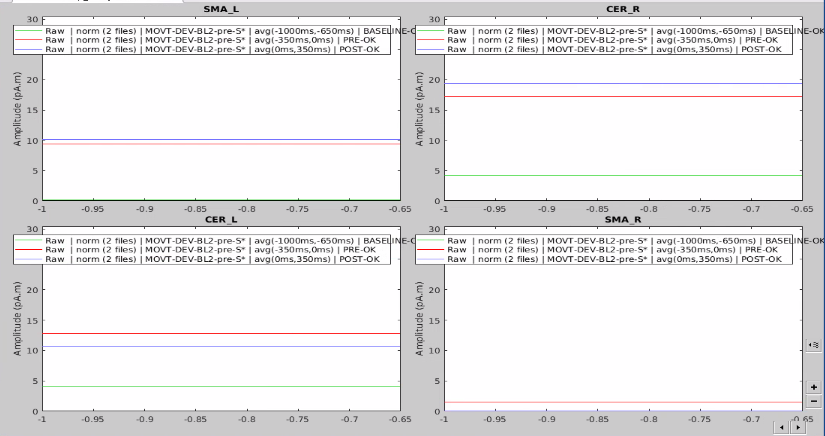
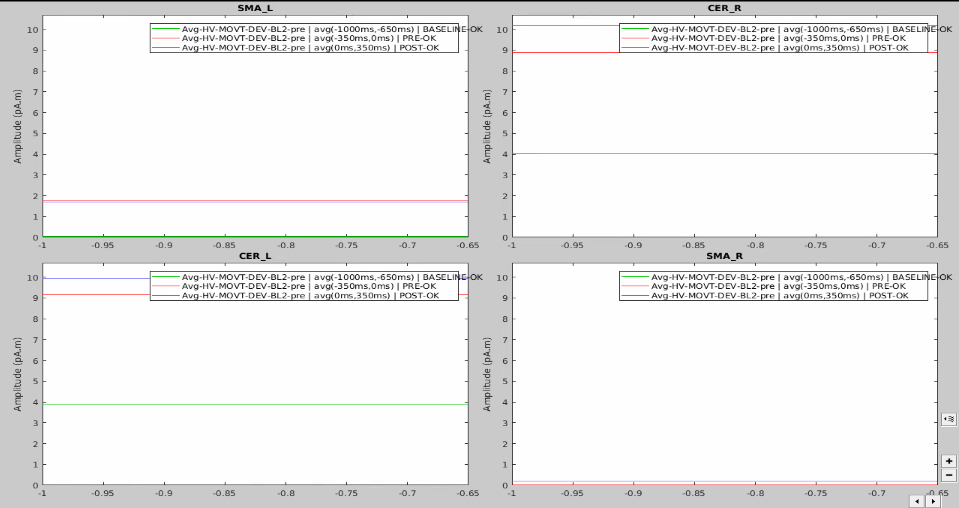
However, when it came to average by time period, e.g. from 0,000 to 0,35ms, the result of the averaging for sure didn't correspond to what was displayed as time series. For example, a simple average on this period in excel for the right SMA led to a value of 2.66 pAM, whereas looking at the graph time series, the amplitude was never superior to 1.
Surprisingly, the values for the cerebellum seemed to correspond perfectly.
I tried to extract the values changing various parameters, but my problem stays the same: the extracted values for the SMA seem not to correspond to the actual activity.
Hence I'd like to get some clarifications to why do I get this bizarre output for SMA and not the cerebellum (I assume something related to the source type?)? and how can I fix this?
Thanks in advance for your help,
Mihoby