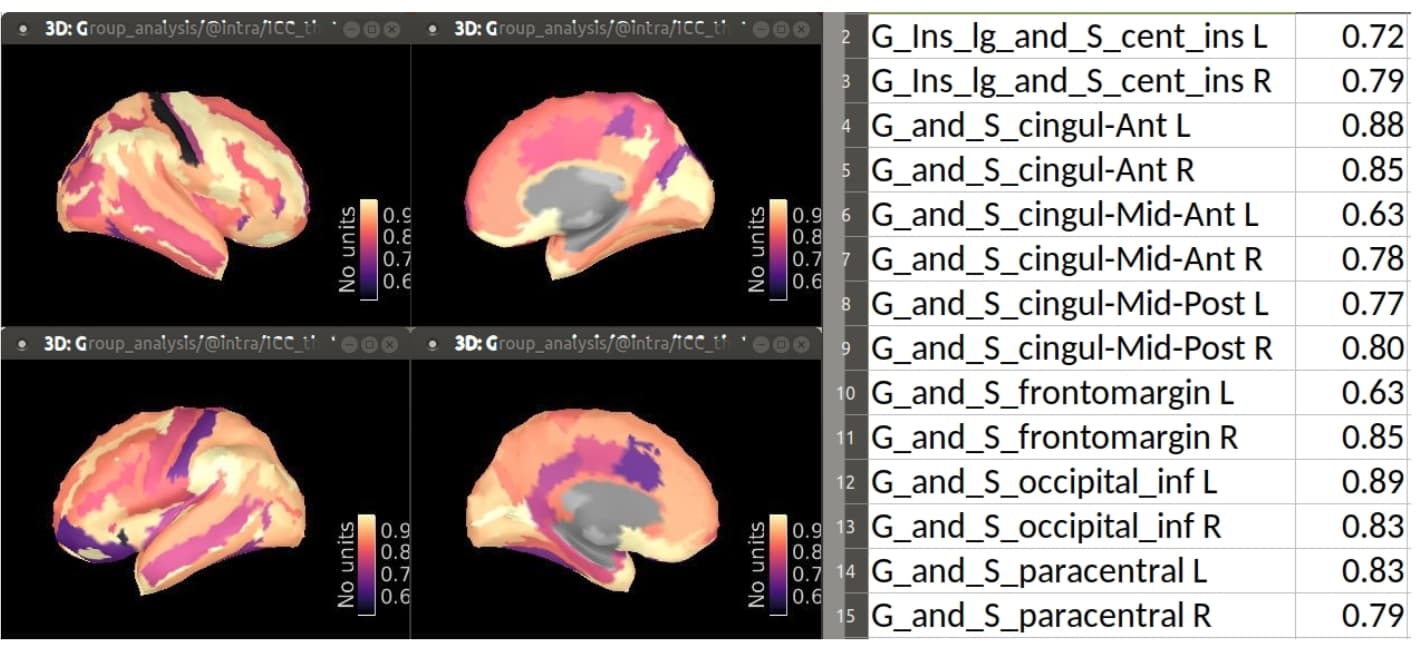
I have data that each brain subregion is associated with a specific percentage value.
Now I need to map these values onto the respective brain subregions of the 3D cortex display to create a heat map, where each subregion is represented by a single color.
In particular, I am seeking methods to map the values to subcortical nuclei (e.g., thalamus and its subregions) and create the heat map.
However, I have not yet discovered how to accomplish this in Brainstorm.
I have also uploaded the data sample here. sample.mat (38.5 KB)
I need your help.
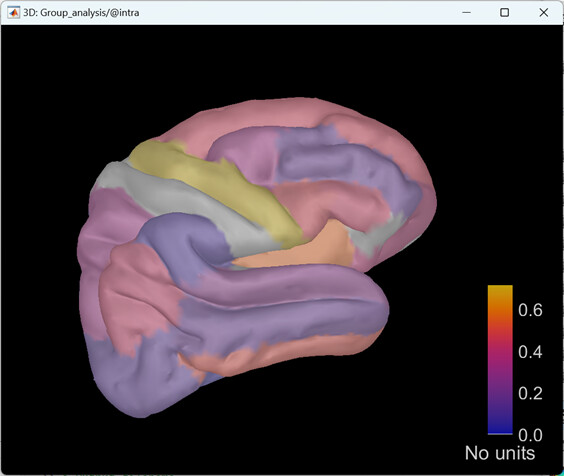
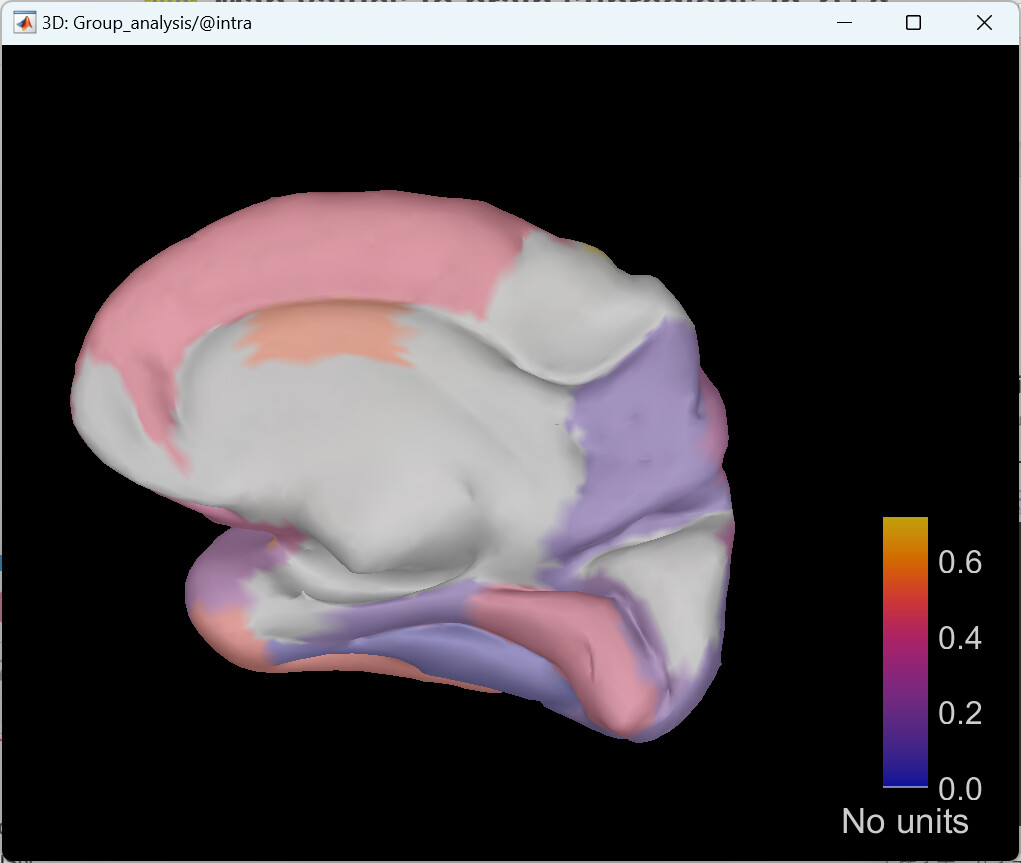
Hi @wangchenyu, for the moment there is not an option in the GUI to accomplish this, in fact, this feature (3D visualization of scout-space data) is on our roadmap for future features.
However, it is possible to generate this figure with Brainstom, by scripting. The main idea is to create a full source map, and assign the same value to all the vertices in one given scout. To do so the scouts must be the same as in atlas in Brainstorm.