Brain-fingerprinting
Authors: Jason da Silva Castanheira, Raymundo Cassani
This tutorial introduces the concept of neurophysiological brain-fingerprinting and its implementation in Brainstorm. To follow this tutorial, please first complete the OMEGA tutorial as we will derive the brain-fingerprints of its five participants.
Contents
Introduction
Brain-fingerprinting is a method to assess inter-individual differences in brain activity. It was first proposed by Finn and colleagues in 2015. This tutorial will derive spectral brain-fingerprints using neural power spectra at computed within each parcel of the Destrieux atlas. Once the individuals' brain-fingerprints have been obtained, differentiation accuracy and differentiability are computed for the cohort. Finally, we analyze relative contribution of each of the cortical parcels (i.e., brain regions) and frequency bins to participant differentiation
This demonstration uses the pre-processed data from five participants obtained from the outputs of the OMEGA tutorial. Please run the entire tutorial before using the tutorial_brain_fingerprint.m script (shown at the end of this page).
Preparing the data for brain-fingerprinting
The brain-fingerprint of an individual can be derived from functional connectomes or neural power spectrum, as detailed in da Silva Castanheira et al., 2021. Note that this is not an exhaustive list of all possible neurophysiological features that can be used to define brain-fingerprints.
From the estimated surface source maps, we compute the power spectrum density (i.e., PSD) using the Welch method at every vertex of the cortical surface, and average the resulting spectra within each region defined by the Destrieux atlas (see Scout page for more details). Note, this is done to downsample the spatial features of the brain-fingerprint. If we did not downsample the PSD to a cortical atlas, the resulting feature space would be too large to work with (e.g., 15,000 vertices × 300 frequency bins). The choice of atlas and neurophysiological features (e.g., functional connectomes vs power spectra) to define the brain-fingerprint is dependent on the user's specific hypotheses. See the section of the script entitled Compute PSD for all ROIs of an atlas
Brain-fingerprinting requires at least two data segments for every individual. This can be two separate recordings (i.e., between-session fingerprinting), or two segments within the same recording session (i.e., within-session fingerprinting). For this demonstration, we will split the MEG recordings of the OMEGA tutorial into two parts (data segments). As such, for each participant, there will be two brain-fingerprints (b-fp1 and b-fp2), each consisting of a vector of nParcellations×nFrequencies elements. See the image below for a summary of the pipeline:

The brain-fingerprinting method
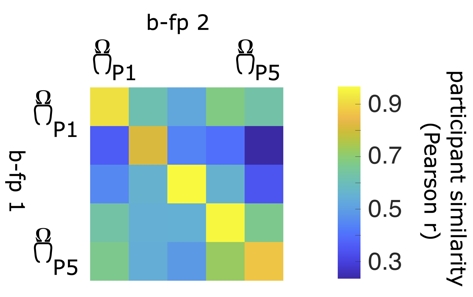
The brain-fingerprinting method is based on the correlational similarity of participants across data segments (see image above). For each participant in a given cohort, we compute the Pearson correlation coefficient between the brain-fingerprint of the first segment and second segment of all participants in the cohort, including the probe participant. This yields a participant similarity matrix, where off-diagonal elements represent the similarity of a participant to all other participants and diagonal elements represent the similarity of a participant's brain-fingerprint across data segments (i.e., similarity to their own brain-fingerprint). See the image below for an example participant similarity matrix.
Participant differentiation consists of a lookup procedure along the rows (or columns) of the participant similarity matrix. A participant is said to be correctly differentiated if a participant's brain-fingerprint is more similar to themselves (self-similarity, also referred to as Iself) than all other participants in the cohort (other-similarity, also referred to as Iothers). In other words, if the brain-fingerprint of participant i is most similar to their brain-fingerprint taken at the second time point, this participant is said to be correctly differentiated.
Differentiation accuracy
Differentiation accuracy represents the percent ratio of the number of participants correctly differentiated across the cohort (i.e., differentiation accuracy). Brain-fingerprinting is typically repeated for all possible pairs of data segments. In the case of this tutorial, there are only two data segments, the first and second half of the recording. We therefore obtain two differentiation accuracies along the rows and columns of the participant similarity matrix respectively. In the case where three data segments are available, we can compute six differentiation accuracies: the accuracy for the columns and rows of data segment 1 vs segment 2, and for each possible pair of recordings (i.e., data segment 2 vs 3 and data segment 1 vs 3).
Differentiability
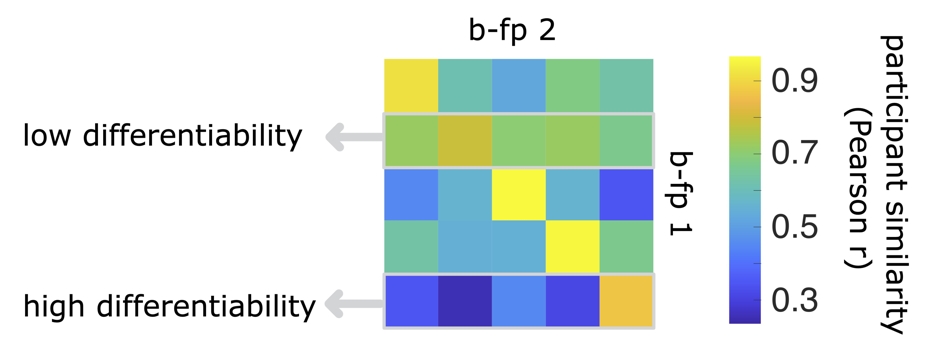
Differentiability is a measure which describes how easily a given participant is to differentiate from a cohort of individuals. This measure consists of scaling (z-scoring) the self-similarity of brain-fingerprints against the other-similarity (off-diagonal elements). A participant with a high differentiability score will have a higher self-similarity relative to their similarity to others in the cohort (other-similarity) and therefore are easily differentiated (see the last row in the example participant similarity matrix below). In contrast, a participant whose brain-fingerprint is most similar to others in the cohort will be more challenging to differentiate (see the second row of the participant similarity matrix below). 
Note that other measures to quantify the relative easy of differentiating a participant exist: Idiff represents the difference between Iself and Iothers. See Amico & Goñi 2018 and Sareen at el., 2021.
The participant similarity matrix is generally symmetric (although it does not necessarily have to be). This implies that the differentiability across rows and columns are generally strongly correlated, as such, the participant differentiability can be computed as the mean of these two per participant
Quantifying the most salient features of the brain-fingerprint
Beyond differentiation accuracy and differentiability, we can quantify the relative contribution of cortical parcels (i.e., brain regions) and frequency bins to participant differentiation.
To do so, we calculated intraclass correlations (ICC). ICC quantifies the ratio of within-participant variance and between-participant variance, with participants as their own raters across data segments (see Amico et al., 2018 & da Silva Castanheira et al., 2021 for details). Features that contribute the most to participant differentiation should be highly consistent within individuals, but show great inter-individual variance. Larger values of ICC indicate that a neurophysiological feature (e.g., region of interest or frequency band) contributes more to participant differentiation than smaller values.
See the subsection entitled IntraClass Correlations (ICC) under the section SIMILARITY AND DIFFERENTIABILITY in the script.
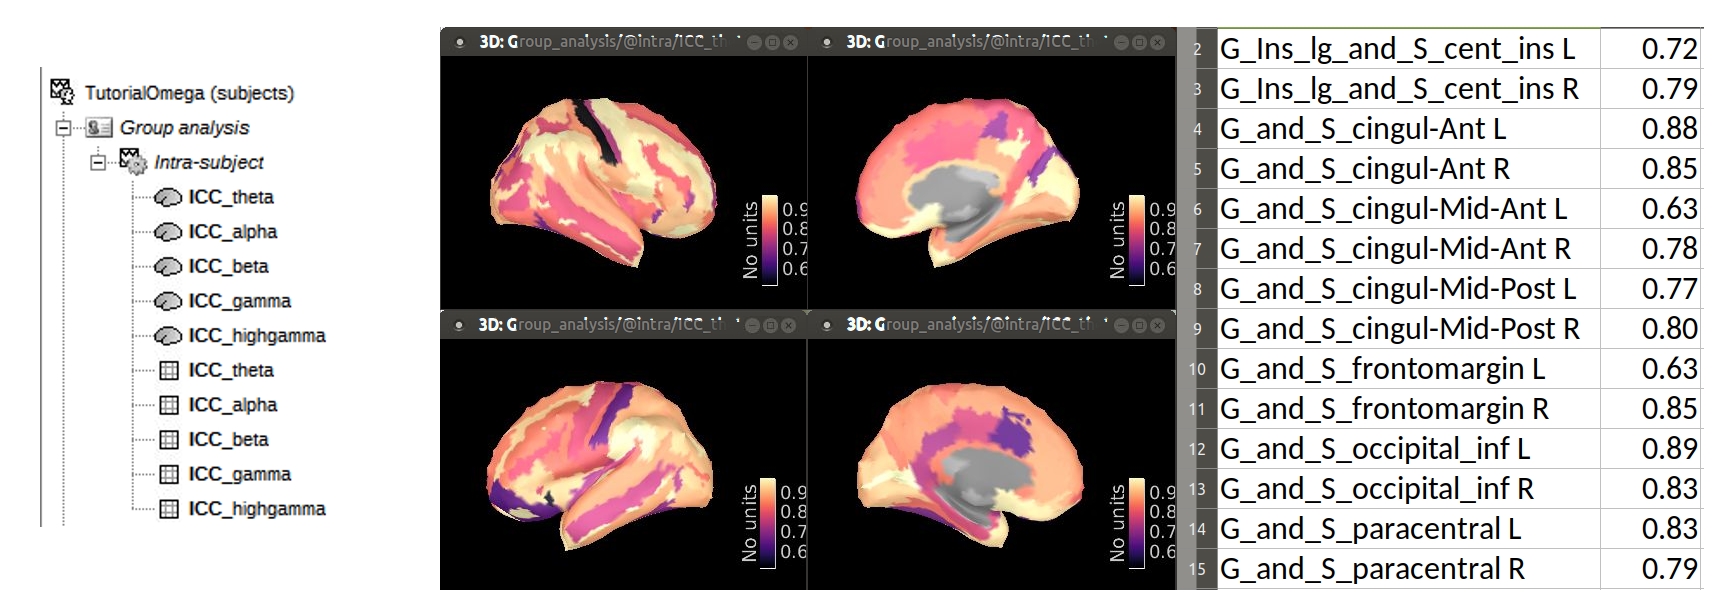
In this tutorial we plot the average ICC value per cortical parcel within each frequency band of interest as defined in the script. See image below:
% Bands for ICC cortex plot
BandNames = {'theta', 'alpha', 'beta', 'gamma', 'highgamma'};
BandLowerFreqs = [ 4,  8, 13, 30,  50]; % Hz, inclusive
BandUpperFreqs = [ 8, 13, 30, 50, 150]; % Hz, exclusive
In the Brainstorm database, the ICC values are saved: as (i) Matrix files (which can be exported to tabular files) and, as (ii) cortical maps (which allow to visualize their spatial distribution). Both set of files are found in the Group analysis folder. The image below presents the database (left), and ICC values for theta band, as cortical maps (center), and as matrix (right).

Applications of the brain-fingerprint
Beyond biometric differentiation, brain-fingerprints advance the neurobiological origins of individual traits and inform clinical. Below we summarize some of the most recent applications of brain-fingerprints.
Decoding individual traits: Previous work demonstrates that beyond biometric identification, brain-fingerprints can predict individual differences in intelligence test performance (e.g., Finn et al., 2015; Amico et al., 2018) and demographics (da Silva Castanheira et al., 2021).
Clinical application: Recent work has explored the clinical utility of bran-fingerprints. This work has shown across multiple neurological diseases that the brain-fingerprints of patients show increased variability (lower self-similairty/ Iself ) in brain-fingerprints of clinical populations (e.g., Kaufmann et al., 2017, 2018; Sorrentino et al., 2021; Troisi Lopez et al., 2023; da Silva Castanheira et al., 2024). A potential explanation for the de-individualization of brain activity in observed in Parkinson’s disease may be an inherent instability in the arrhythmic brain activity of patients over short periods. In contrast, rhythmic brain activity appears particularly characteristic of patients with PD (da Silva Castanheira et al., 2024). Future work is exploring the application of brain-fingerprints to the design of personalized medicine.
Additional documentation
Please cite previous work on brain-fingerprinting:
da Silva Castanheira, J., Orozco Perez, H.D., Misic, B. et al. Brief segments of neurophysiological activity enable individual differentiation. Nat Commun 12, 5713 (2021). https://doi.org/10.1038/s41467-021-25895-8
Finn, E., Shen, X., Scheinost, D. et al. Functional connectome fingerprinting: identifying individuals using patterns of brain connectivity. Nat Neurosci 18, 1664–1671 (2015). https://doi.org/10.1038/nn.4135
Further reading:
Amico, E., Goñi, J. The quest for identifiability in human functional connectomes. Sci Rep (2018). https://doi.org/10.1038/s41598-018-25089-1
Sareen, E., Zahar, S., Ville, D. V. D., Gupta, A., Griffa, A., & Amico, E. Exploring MEG brain fingerprints: Evaluation, pitfalls, and interpretations. NeuroImage (2021). https://doi.org/10.1016/j.neuroimage.2021.118331
Sorrentino, P., Rucco, R., Lardone, A., Liparoti, M., Troisi Lopez, E., Cavaliere, C., Soricelli, A., Jirsa, V., Sorrentino, G., & Amico, E. Clinical connectome fingerprints of cognitive decline. NeuroImage, (2021). https://doi.org/10.1016/j.neuroimage.2021.118253
Troisi Lopez, E., Minino, R., Liparoti, M., Polverino, A., Romano, A., De Micco, R., Lucidi, F., Tessitore, A., Amico, E., Sorrentino, G., Jirsa, V., & Sorrentino, P. Fading of brain network fingerprint in Parkinson’s disease predicts motor clinical impairment. Human Brain Mapping, (2023). https://doi.org/10.1002/hbm.26156
Kaufmann, T., Alnæs, D., Brandt, C. L., Bettella, F., Djurovic, S., Andreassen, O. A., & Westlye, L. T. Stability of the Brain Functional Connectome Fingerprint in Individuals With Schizophrenia. JAMA Psychiatry, (2018). https://doi.org/10.1001/jamapsychiatry.2018.0844
Kaufmann, T., Alnæs, D., Doan, N. T., Brandt, C. L., Andreassen, O. A., & Westlye, L. T. Delayed stabilization and individualization in connectome development are related to psychiatric disorders. Nat Neurosci, (2017). https://doi.org/10.1038/nn.4511
da Silva Castanheira, J., Wiesman, A. I., Hansen, J. Y., Misic, B., Baillet, S., Network Quebec Parkinson, & PREVENT-AD Research Group. (2023). Neurophysiological brain-fingerprints of motor and cognitive decline in Parkinson’s disease. medRxiv.
Tutorials
Tutorial: Source estimation
Tutorial: Scouts
Tutorial: Power spectrum
Tutorial: Scripting
Scripting
The following script from the Brainstorm distribution reproduces the analysis presented in this tutorial page: brainstorm3/toolbox/script/tutorial_brain_fingerprint.m

