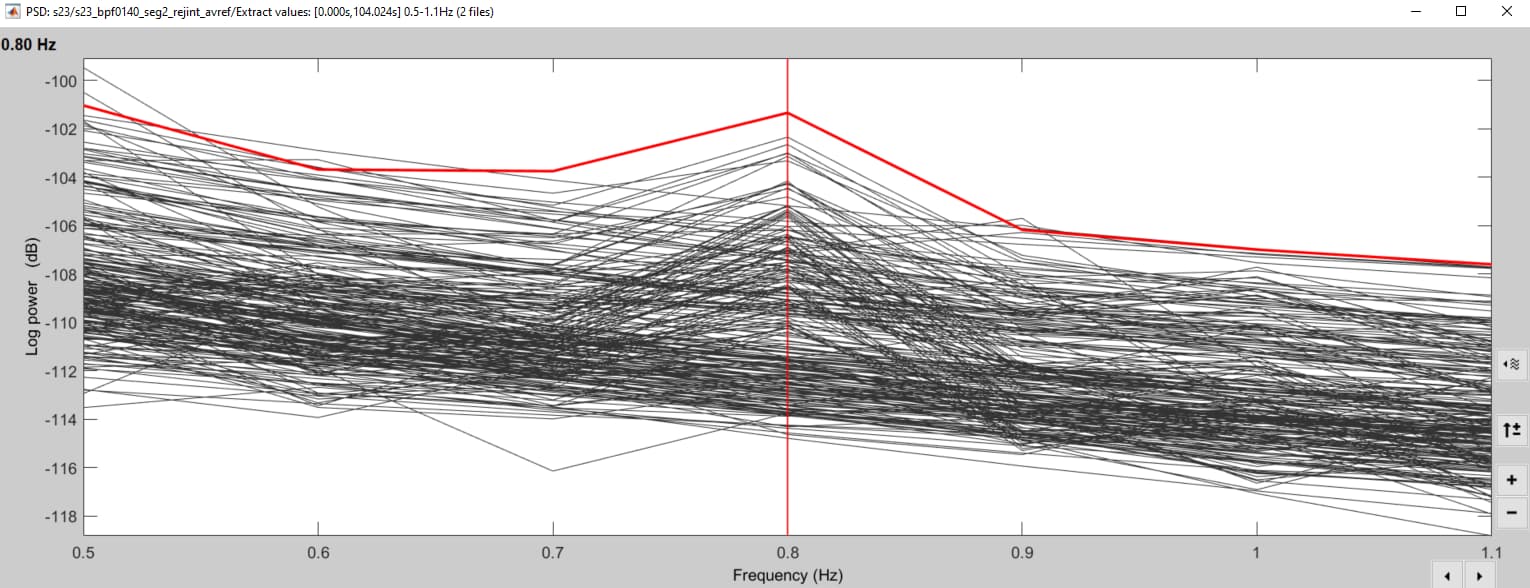
I have computed 2 PSD files for the same time series. The first file contains the power and the second file contains the "1/f" background fit power. Then, to merge them, I dragged both files and run process - Extract - Concatenate Signals. This works very well but
I cannot have the "view sensors" option anymore.
If I select one sensor, I'd like to see both getting selected (i.e., power and the fit for the selected sensor). Whereas, it just selects only one!
Thank you very much, Raymundo for your prompt response! First of all, it is relieving to know that there is no correspondence between the PSD traces and the sensors. And secondly, it is great to already have a function that I can use.
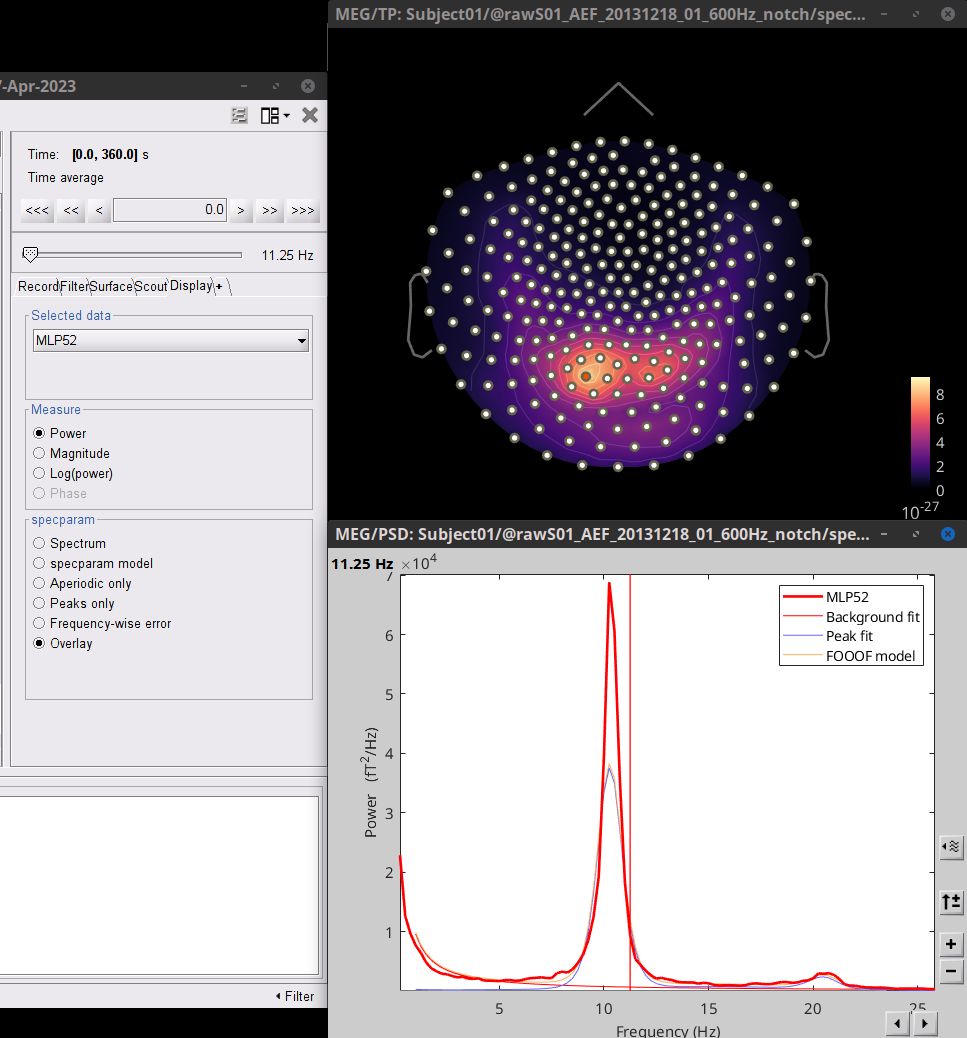
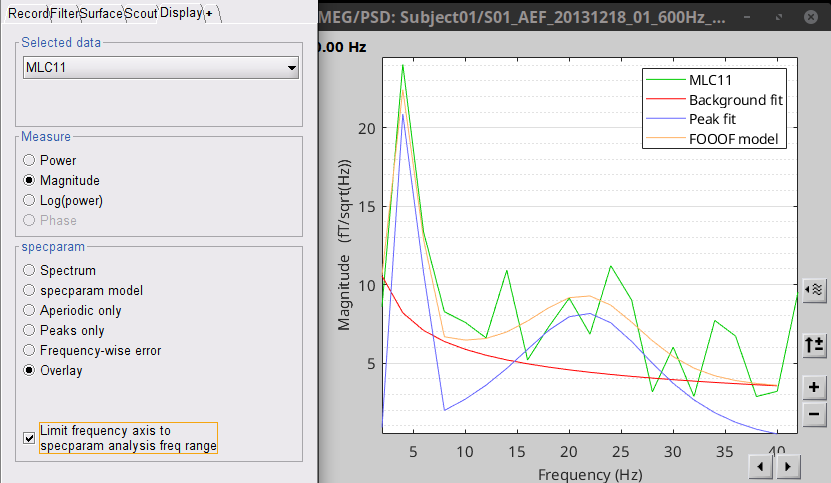
Only drawback I have found is that - for the display, it considers all the frequency range of the original PSD file, whereas it correctly computes the background fit only for the "Frequency range of analysis". So, I have to run the "Extract" process using the output spectrum file to display the range I am interested in. I wonder if it would make sense to display only the analyzed frequency range (which the user is interested to see).
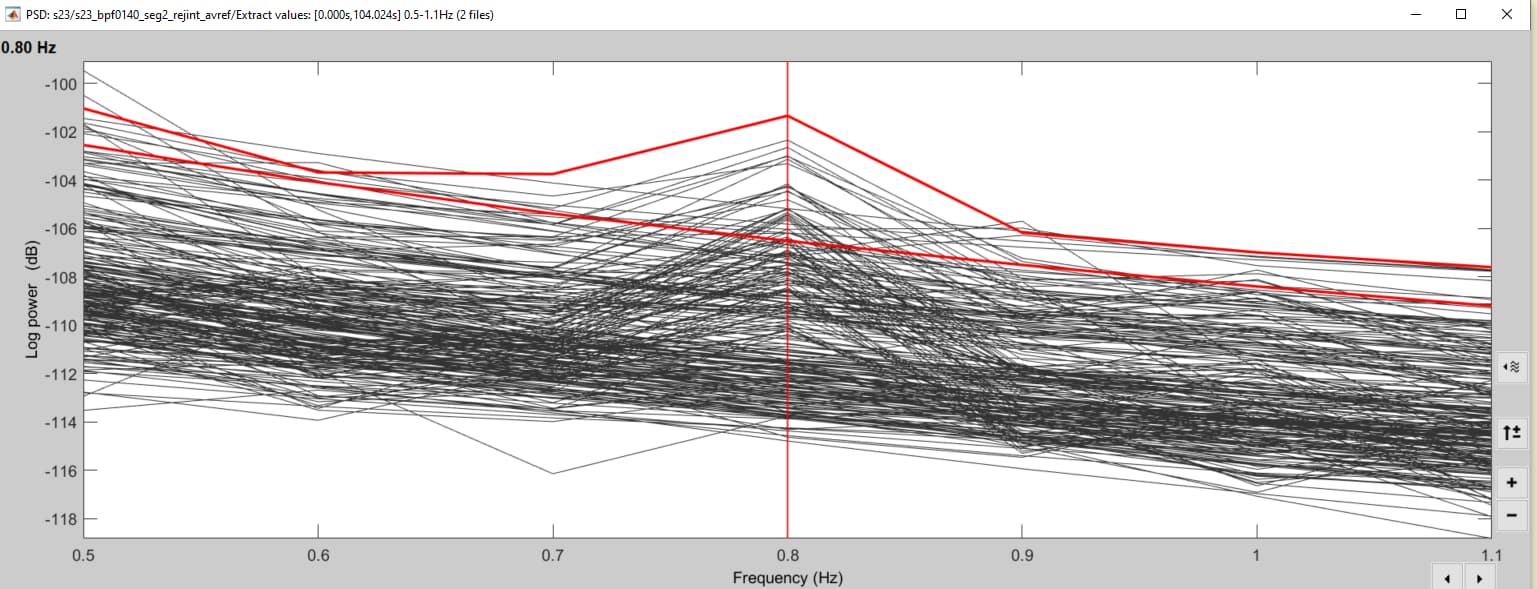
Just want to clarify. One you compute the PSD there is correspondence between the sensors and the PSD traces. When the two PSD files are signal concatenated, that correspondence is broken, as the number of PSD traces is twice the number of sensors.
There are at two ways to zoom-in in the frequency axis:
By using the mouse scroll on the figure, the figure will zoom-in around the current freq marker (vertical red line)
In the Matlab Command Window: xlim([lowFreq, highFreq]);
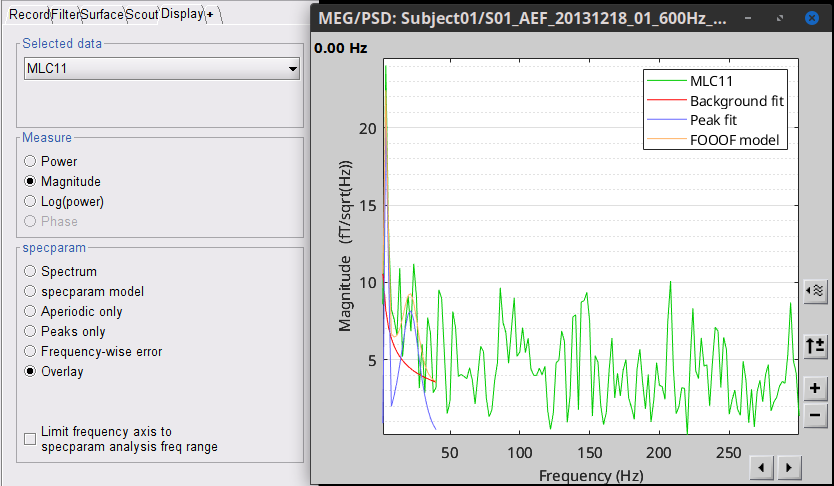
@Luc, what do you think of an option like the suggested?
We could add a checkbox in the Display tab: Limit freq axis to freq range of analysis in specparam