Hello everyone,
I am elaborating a MMN task acquired with MEG (ELEKTA). I followed the “auditory” (old) tutorial and now I have the average difference (deviant average - standard average). I have only one run per subject, not two like in the tutorial. I also don’t have the “noise” (empty room recording) file.
What I don’t know is how to obtain a graph with only one line ( probably the average of all the channels/sensors for each subject). What I can see is exactly the pic of the tutorial (this one: https://neuroimage.usc.edu/brainstorm/Tutorials/Auditory?action=AttachFile&do=get&target=average_sensor_diff2.gif), and I would like to have the same graph with only one line. Any ideas?
Thanks a lot
Gabriele
Hi Gabriele,
You can create a cluster of sensors and display its average activity for one or multiple files. This is explained in the introduction tutorials:
https://neuroimage.usc.edu/brainstorm/Tutorials/ChannelClusters
I really don’t recommend you average the values of all the sensors. In MEG, it would give something close to zero, which is absolutely not representative of the activity. If you’re looking for response peaks, use rather the average power (sum of squared values), this is what is represented in green at the bottom of your figure (GFP=Global field power).
Cheers,
Francois
1 Like
Thank you, I’m going to try this procedure and I’ll let you know in case of troubles.
Thanks again,
Gabriele
Dear Francois,
Thanks for your precious help. It worked!
Now, I would like to know if you are aware of the existence of something like an atlas with all the channel clusters for specific sub-regions. With the classic clusters I have, for example, the right temporal area but what about a method for clustering its sub-regions?
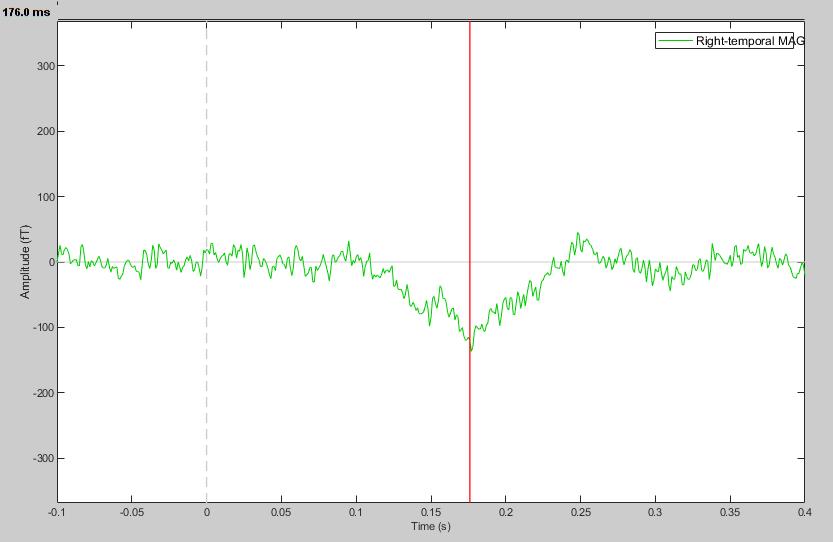
Moreover, I know it is a little bit off topic but, can you help me to obtain a good baseline correction for my analysis? I read all the tutorials and topics here but still it is not clear, probably because I am not an expert. The result I have in this moment is:
My goal is to obtain a flat line (without all those peaks) with a "smooth" negative peak at about 175ms. Can you help me please?
Thanks again
Gabriele
Now, I would like to know if you are aware of the existence of something like an atlas with all the channel clusters for specific sub-regions. With the classic clusters I have, for example, the right temporal area but what about a method for clustering its sub-regions?
If you are interested in finer anatomical localization, I'd recommend you do your analysis in source space and create anatomical ROIs. Read the following online tutorials for help.
In MEG, the sensors are not attached to the head therefore they move with respect to the head, and because of different head sizes not all the subjects show the same patterns of activity at the sensor level. The activity observed at one sensor is unlikely to be replicable across subjects. It is not like EEG, where a given 10-20 electrode always shows the same effects for most subjects.
Another difficulty is that, unlike EEG, the peak of activity is not recorded just above the brain source but on the side, with a direction that depends on the orientation of the source. This makes the sensor topographies difficult to interpret.
If you are not familiar with MEG data physics and analysis, I'd recommend you have a look at the suggested publications in the "background readings" of the tutorial page:
https://neuroimage.usc.edu/brainstorm/Tutorials#Background_readings
My goal is to obtain a flat line (without all those peaks) with a “smooth” negative peak at about 175ms. Can you help me please?
If you want it more flat that this, you can try filtering it. But you'd need to filter before epoching because your epoch is too short. You can refer to the filtering tutorial:
https://neuroimage.usc.edu/brainstorm/Tutorials/ArtifactsFilter#What_filters_to_apply.3F