Hello,
I have some questions concerning source modelling and deep sources.
I have epilepsy patients who have been implanted deep brain stimulation (DBS) electrodes in the anterior nucleus of the thalamus (ANT).
I have found some ERP like responses related to high frequency stimulus. At first, I measured baseline period of 5 minutes when the stimulator had been off one hour. From this file, I calculated the covariance matrix after signal preprocessing (artefact cleaning and band pass filtering). After this, I did preprocessing, epoching and averaging to data. I found some ERP responses and I calculated the sources using dSPM (with BEM model, source space cortex constrained). What I found, was that most of the activity was in deep in the midline of the brain, like posterior cingulate area. However, there was some “ghost“ activations in the area of corpus callosum. After this, I made the mixed BEM model where I included some deep structures like brainstem, thalamus, and amygdala (yes, I understand that it is very difficult to show reliably that these areas are activated) and I got rid of corpus callosum activations. One reference article says that these kind of responses were found from hippocampus with depth electrodes when DBS stimulator was in use.
Question 1) @Sylvain: Should I include all the subcortical structures or should I include only those that might get activated most probably? I only had 64 active EEG electrodes and I have no idea how inaccurate localization is in these deep structures as compared to more superficial ones.
Question 2) @Sylvain: Do you think that including some subcortical structure(s) is better option than using whole brain as source model if there is at least small hint of subcortical activations?
Question 3) I have a baseline measurement in separate file. Can I use this to calculate Z-score transformation for MNE? Is this in fact identically same as calculating dSPM? In Z-score transformation, the only ínput option shows the time span in current file and I cannot select input from another file. So what I would like to do, is to compare dSPM and MNE with Z-score normalization in deep sources by using the same baseline definition.
Question 4) How can I compare activation maps between subjects? If I select group analysis, how should I proceed with the mixed model. For example if I want to use Desian-Kiliany atlas as scouts and some structures from aseg atlas for comparison purposes?
Question 5) I have one collaborator who is doing some FEM modelling and solving inverse problems. We would like to compare BEM and FEM results. Is there some place where I can see all the parameters that are used during source reconstruction in Brainstorm? For example, he would like to know what is the time window used for calculations etc? I’m using precompiled version.
Sorry that my message was so long and included several topics. Please be free to divide this message to separate topics if needed.
Thank you for the Cambridge course! It was very nice!
Hello
Question 1) @Sylvain: Should I include all the subcortical structures or should I include only those that might get activated most probably? I only had 64 active EEG electrodes and I have no idea how inaccurate localization is in these deep structures as compared to more superficial ones.
Question 2) @Sylvain: Do you think that including some subcortical structure(s) is better option than using whole brain as source model if there is at least small hint of subcortical activations?
With 64 EEG electrodes, you can't expect a high spatial resolution in your source analysis. Trying to model individually of the various deep structures may improve your results but not much, while they can introduce a lot confusion in the interpretation of the results. These "mixed head model" results are difficult to visualize and process.
I'd recommend you start by getting results you can explain with a more generic model, and then, only if you need to, refine the location of the sources with this "mixed head model" approach. Use a "volume head model" with a regular grid of sources, which won't impose any constraint of location or orientation on the dipoles in your model:
https://neuroimage.usc.edu/brainstorm/Tutorials/TutVolSource
If you really want to use these deep structures, use them all, not only the ones were you want to observe activity, otherwise you introduce a strong bias in your analysis
The fact that you get all your activity at the center of the head might be an issue related with the dSPM computation and/or your noise covariance matrix. Try to compare the results obtained with the option "current density maps", normalized with a Z-score, as in the introduction tutorials:
https://neuroimage.usc.edu/brainstorm/Tutorials/SourceEstimation#Z-score
Question 3) I have a baseline measurement in separate file. Can I use this to calculate Z-score transformation for MNE? Is this in fact identically same as calculating dSPM? In Z-score transformation, the only ínput option shows the time span in current file and I cannot select input from another file. So what I would like to do, is to compare dSPM and MNE with Z-score normalization in deep sources by using the same baseline definition.
If the two files (baseline and the recordings of interest) are in two separate files: compute separately the sources for the baseline, the sources for the data of interest, and use the Process2 tab to standardize one with the other (FilesA=baseline source file, FilesB=source file, process "Standardize > Baseline normalization").
Question 4) How can I compare activation maps between subjects? If I select group analysis, how should I proceed with the mixed model. For example if I want to use Desian-Kiliany atlas as scouts and some structures from aseg atlas for comparison purposes?
- Option 1: Use scouts (process "Extract > Scouts time series) for each subject and compare the time series you obtain for the various regions of interest.
- Option 2: Estimate the sources for a common source grid, projected to the individual subject spaces with the MNI transformation computed with SPM:
https://neuroimage.usc.edu/brainstorm/Tutorials/CoregisterSubjects#Volume_source_models
Question 5) I have one collaborator who is doing some FEM modelling and solving inverse problems. We would like to compare BEM and FEM results. Is there some place where I can see all the parameters that are used during source reconstruction in Brainstorm? For example, he would like to know what is the time window used for calculations etc?
For the estimation of the minimum norm source maps, you define all the time windows yourself.
Time and actual EEG recordings are not used in the actual computation of the forward model, no matter which one (single sphere, BEM, FEM...). Only the anatomical information and the position of the electrodes is needed.
Please list the exact list of details you would like to know more about and I will try to get this information for you.
François
Thank you Francois! Your answers were most helpful. I will follow your recommendations.
I would like to ask few more questions related to your answers.
Question 2)
Francois: "If you really want to use these deep structures, use them all, not only the ones were you want to observe activity, otherwise you introduce a strong bias in your analysis"
So just to be sure. If fore some reason I end up using mixed model, I should use also cerebellum to prevent bias (when selecting all subcortical sources)?
Francois: "The fact that you get all your activity at the center of the head might be an issue related with the dSPM computation and/or your noise covariance matrix."
There might be one huge mistake in my baseline. I marked some bad segments in the raw file of the baseline (in addition of cleaning up artifacts with ICA). Do I have to import the whole file to database before these bad segments are rejected, when the noise covariance matrix is calculated? This is the case when epoching, right?
Question 5)
I will contact my collaborator and ask exact list of details. This might take some time, but I post the list as soon as I get it.
Thank you in advance!
So just to be sure. If fore some reason I end up using mixed model, I should use also cerebellum to prevent bias (when selecting all subcortical sources)?
How extended you want you source space to be, and whether you want to include the cerebellum or not, this is up to you and depending partly on the hypothesis behind your experiment.
Just make sure you don't restrict it too much. For example, if you use only the hippocampus as your source space, then the minimum norm algorithm will find a way to explain all your recordings using only the hippocampus, and you'll find significant activity in the hippocampus no matter what recordings you have in input.
There might be one huge mistake in my baseline. I marked some bad segments in the raw file of the baseline (in addition of cleaning up artifacts with ICA). Do I have to import the whole file to database before these bad segments are rejected, when the noise covariance matrix is calculated? This is the case when epoching, right?
You can compute the noise covariance directly from the continuous file, no need to actually copy your baseline recordings to the database (menu "Import in database"). Right-click on the "Link to raw file" > Noise covariance > Compute from recordings. The bad segments should be excluded from the computation.
Hi Francois,
Thank you for comments.
I still have a problem with Z-score normalization. My original sampling rate is 20kHz. I resampled the baseline file and the file of interest to 2kHz. I have 15002 vertices in the cortex (the default). The baseline file is 326s long and one epoch is 5s long. I calculated sources for baseline and for epochs and tried to standardize with Z-transform as you and tutorial explained.
I end up with error message which says:
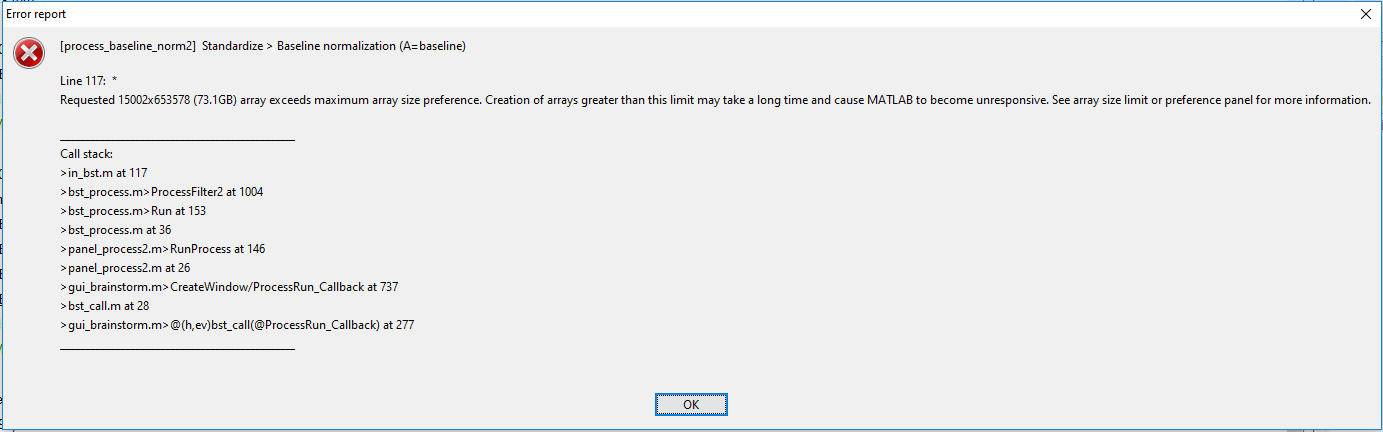
So it seems that the arrays size is too big 15002x653578 (73GB). I think the later number in the array is the length of the baseline file (653578/2000Hz=326s)
Is the only solution to downsample more or reduce the number of vertices in the cortex? Or is this 300 second baseline just too long? If I select the shorter time window in the process window, it does not help at all, because it seems that the software reads the whole file. Or is there something simple thing that I don't understand?
I have 64GB memory in my computer, so it might even survive from that array. However, I haven't found place in a precompiled version, where I can adjust the array size limit as the error message says. Should I start working with Matlab version?
Additional question to Question 5)
Francois:"For the estimation of the minimum norm source maps, you define all the time windows yourself."
So, if my sampling rate is 2000Hz, then time between two sampling points is 1/2000Hz=0,5ms. Is this the time window, that Brainstorm uses, when it shows the activation on the cortex? Because some softwares extend this time window some samples backward and forward to average a little more.
Thank you again for your patience!
Is the only solution to downsample more or reduce the number of vertices in the cortex? Or is this 300 second baseline just too long? If I select the shorter time window in the process window, it does not help at all, because it seems that the software reads the whole file. Or is there something simple thing that I don't understand?
This baseline is just too long for working with a full resolution of 15000 vertices.
A few tens of seconds will already produce a stable estimate of the mean and standard deviation over time for your Z-score normalization. If you really want to use long baseline, you may need to reduce the number of sources you are using.
You don't get this issue at the moment of the estimation of the sources for the full baseline, because Brainstorm optimizes the storage of the source results: it saves in only the inverse operator (ImagingKernel) and then multiplies it on the fly with the recordings only for the time points that are displayed. This works for displaying the file, but not computing any non-linear measure from it (like the evaluation of the standard deviation): when you run your normalization, it needs to rebuild the full matrix 15002x653578 and crashes.
https://neuroimage.usc.edu/brainstorm/Tutorials/SourceEstimation#Computing_sources_for_single_trials
https://neuroimage.usc.edu/brainstorm/Tutorials/SourceEstimation#On_the_hard_drive
I have 64GB memory in my computer, so it might even survive from that array. However, I haven't found place in a precompiled version, where I can adjust the array size limit as the error message says. Should I start working with Matlab version?
Whatever you try to do, with or without Matlab, it won't work. When computing most operations on a matrix, Matlab needs to create at least 2 copies of it, source and destination, you'd need 150Gb of RAM. And there is no way to increase manually the size of the maximum matrix that Matlab can handle. This is just too big.
So, if my sampling rate is 2000Hz, then time between two sampling points is 1/2000Hz=0,5ms. Is this the time window, that Brainstorm uses, when it shows the activation on the cortex? Because some softwares extend this time window some samples backward and forward to average a little more.
Yes, you get acces to your source values at each and every time sample.
If you want to compute an average of a small time window, use the process "Average > Average time".
Another approach is to apply a low-pass filter, this would have an effect similar to applying a moving average. Note that if you are using the Filter tab and displaying a Z-scored file, you'd need to check the box "Filter full source files" and it might take a little while to open your files.
Thank you Francois and sorry for the delayed response.
Yes, I understand this now. I saw the source mapping results on the display and thought that everything was ok. I will select the shorter baseline period and this problem will be solved.
Thanks again!
Hi Francois,
Could you help me few more steps forward?
I use 40s long baseline for Z-score normalization. Now when I have done comparison to dSPM, I have calculated noise covariance matrix from longer (300s) period of time. The baseline file is of course the same and the 40s period is part of the 300s period. The baseline is resting state eyes closed.
Question 1) Can you estimate, how big error is made if I use 300s for dSPM and 40s for z-transform normalization and then make comparison of the results? Or should I use 40s also for the noise covariance? In tutorial it was said that the duration of the data used for the calculation of the noise covariance matrix should be as long as possible.
Question 2) Is it possible to make atlas where I have some structures from deep structures like thalamus and amygdala and then some structures from Desian-Kiliany atlas? I tried to export amygdala using "save selected scout to file" icon on the scout tab and then changing to my own atlas and using "Add scouts to atlas" in the atlas menu, but this does not work. It brings the name (Amygdala) to the atlas but I'm not able to display the scouts time series. It gives error: Scout "Amygdala R" is not included in the source model. If you use this region as a volume, create a volume scout instead (menu Atlas > New atlas > Volume scouts)
Question 1) Can you estimate, how big error is made if I use 300s for dSPM and 40s for z-transform normalization and then make comparison of the results?
This depends on your recordings, your hypothesis... this is something you should test on your data, I'm sorry I cannot give you generic recommendations.
Or should I use 40s also for the noise covariance? In tutorial it was said that the duration of the data used for the calculation of the noise covariance matrix should be as long as possible.
The more data you use, the more stable the estimation of this noise covariance matrix. But be carefull with the quality of your baseline. For example, if your participant is moving during these 300s, and you're studying movement preparation in your experiment, then your source analysis will be degraded.
Is it possible to make atlas where I have some structures from deep structures like thalamus and amygdala and then some structures from Desian-Kiliany atlas?
Not in the same atlas. One atlas includes either only surface atlas or voume atlases.
And in general, it is not something I would recommend. It is very difficult to compare directly the two types of data representation (surface with an orientation constraint and volume with unconstrained dipole orientations). It is much easier, and problably not much less accurate, to work either in surface or in volume completely...
Hi Francois,
Thank you for your advice! I really have to think once more how I'm going to present the results. I have deep brain stimulated epilepsy patient with electrodes in the anterior nucleus of thalamus. It seems that I get ERP activation in the cingulum area and also to some deeper brain areas that agree quite nicely with anatomy of the cingulum bundle. However, this happens only if I use orientation constrained model. Anyway, thank you once more. Your comments were very valuable.
Be careful with not over-interpreting source results. Anything you see only using one specific source model is suspicious. For deep structures, compare what you obtain with fully unconstrained models (volume source models: https://neuroimage.usc.edu/brainstorm/Tutorials/TutVolSource).
You should also always find a way to test the significance of the results you obtain (comparison with a baseline or between conditions). Here you could maybe compare between the brain responses to stimulations at different sites?
Hi Francois!
Thank you for your comments. I'm very sorry that I continue this discussion so late because of my parental leave and summer vacation.
Your suggestion of comparing two different stimulation sites was also very great. At first I thought that it would be impossible, because we used only one stimulation contact of the electrode, but because we were doing bilateral stimulation, we could of course compare left against the right. However, in addition we would be really interested to see what brain areas get active related to this bilateral stimulation.
Last time we vere talking about the differences in the dSPM and Z-score normalized results as well as unconstrained vs. constrained maps. Could you help me once again? I took few screen captures that it would be easier to explain.
Fig 1. Upper left: 64 channel EEG. Upper right: Z-score normalized MNE (constrained sources). Lower left: dSPM (constrained sources). Lower right: dSPM (mixed model) with deep sources. All amplitudes were thresholded to 50%.
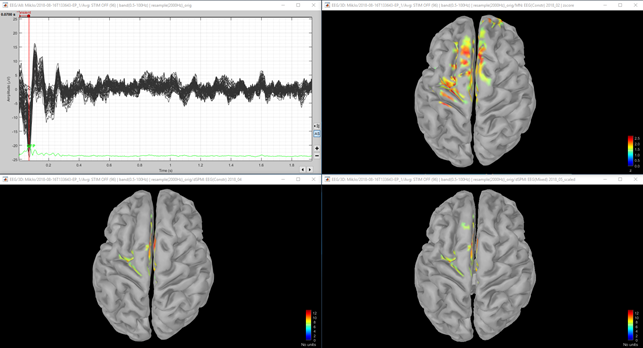
Fig 2. Same as figure 1, except that in the second row, the dSPM threshold was set to 30%. This was done since dSPM maximum local value was 12 and MNE Z-score local maximum value was 2.5.
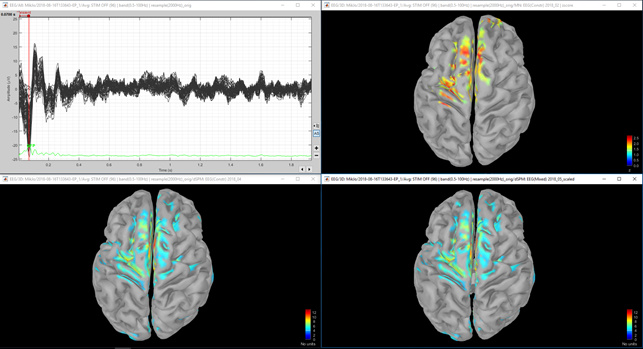
Figure 3. Same as figure 1, but medial border of the left hemisphere.
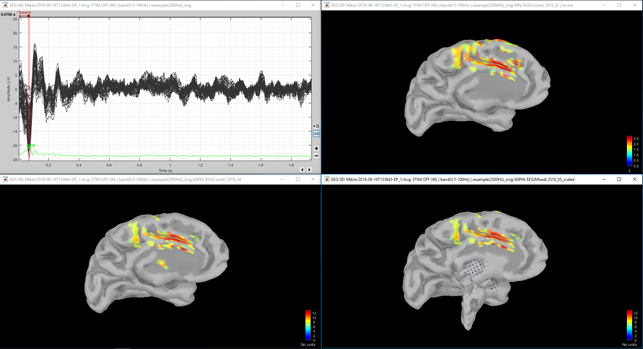
Figure 4. Same as figure 1, but lower right shows dSPM with unconstrained sources.
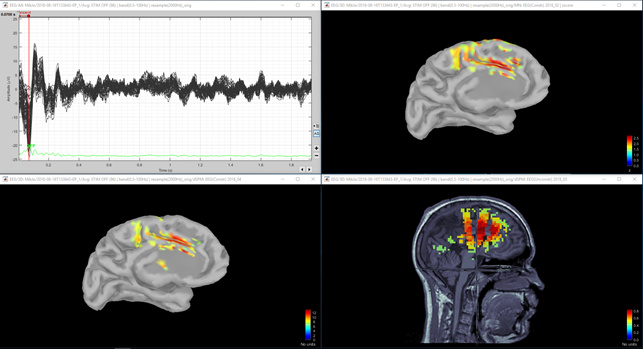
Figure 5 Unconstrained dSPM (positive peak).
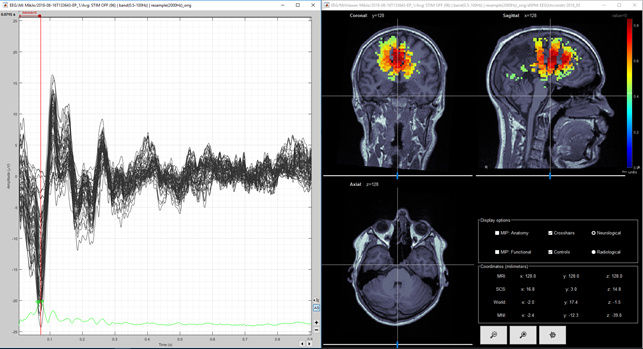
Figure 6 Unconstrained dSPM (negative peak).
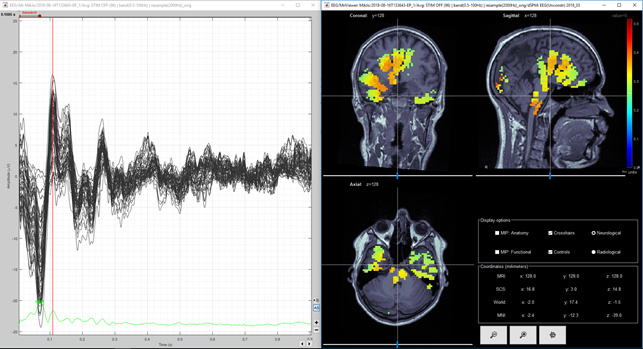
Figure 7. Unconstrained MNE Z-score (volume) first positive deflection
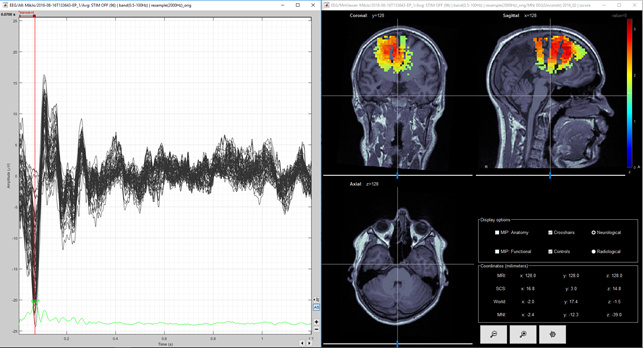
Figure 8. Unconstrained MNE Z-score (volume) first negative deflection
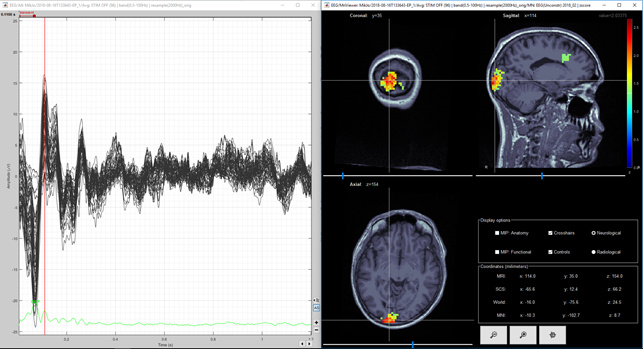
Figure 9. Same as figure 8, but amplitude threshold lowered from 50% to 30%
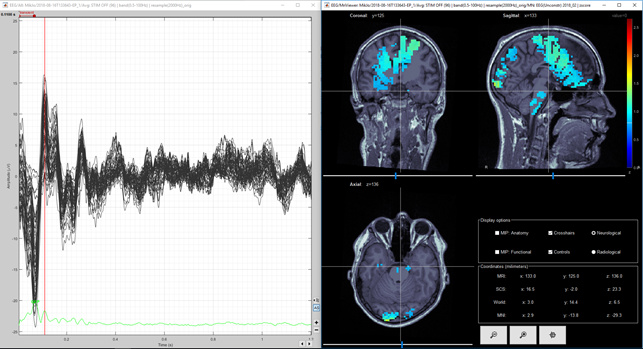
Question 1) It would be nice if situation would be like in figures 2 and 3. However, in figure 1 there is very little activity in dSPM in the top of the head. On the other hand the maximum of the MNE Z-score is 2.5 and the maximum of the dSPM "Z-score" is 12. Is there some relation between these different units? I thought that both of these are sort of statistical units? Is there some way to compare these values, I mean between dSPM "Z-score" and real MNE Z-score?
Question 2) Based on figures 1, 2 and 3. Would you say that these methods produce same kind or different kind of results? I mean, that do you think, that the results agree so well, that I could convince you that the both methods are working?
Question 3) I calculated the unconstrained result as you suggested and they are shown in Figure 4, 5 and 6 for dSPM and Figures 7, 8 and 9 for MNE Z-scored. Do you think that figures 4 and 5 agree enough well with figures 2 and 3? I think images 5 and 7 are same kind of, but then again images 6 and 8 (from second peak) are different. Lowering the threshold is not totally helping in figure 9. So, is it possible, that models agree at spesific time point and at another time point they give so different results? Or is this difference between Figure 6 and 9 acceptable?
Thank you in advance and sorry for the so many number of images.
Question 2) Based on figures 1, 2 and 3. Would you say that these methods produce same kind or different kind of results? I mean, that do you think, that the results agree so well, that I could convince you that the both methods are working?
I would say this all looks very similar. The manual arbitrary threshold (the "Amplitude" slider) makes it look more variable, and you may obtain slightly different sources locations with the different types of normalization, but I guess that after doing some proper statistical analysis you would obtain very similar results with any of these methods.
Question 1) It would be nice if situation would be like in figures 2 and 3. However, in figure 1 there is very little activity in dSPM in the top of the head. On the other hand the maximum of the MNE Z-score is 2.5 and the maximum of the dSPM "Z-score" is 12. Is there some relation between these different units? I thought that both of these are sort of statistical units? Is there some way to compare these values, I mean between dSPM "Z-score" and real MNE Z-score?
The dSPM computation was modified recently, maybe half-way in your analysis... the changes are documented here:
https://neuroimage.usc.edu/brainstorm/News
https://neuroimage.usc.edu/brainstorm/Tutorials/SourceEstimation#Averaging_normalized_values
Make sure you use the same version for all your subjects in this study, and do not focus too much on the actual value you obtain with the dSPM. What really matters is the significance of the difference you obtain between conditions.
Question 3) I calculated the unconstrained result as you suggested and they are shown in Figure 4, 5 and 6 for dSPM and Figures 7, 8 and 9 for MNE Z-scored. Do you think that figures 4 and 5 agree enough well with figures 2 and 3? I think images 5 and 7 are same kind of, but then again images 6 and 8 (from second peak) are different. Lowering the threshold is not totally helping in figure 9. So, is it possible, that models agree at spesific time point and at another time point they give so different results? Or is this difference between Figure 6 and 9 acceptable?
It looks similar enough to me. Proper statistical analysis will give you regions where differences between conditions are significant.
If you can make similar observations with all these methods, keep the simplest one (constrained to the cortex, constrained dipoles orientations), it would make the statistical analysis much simpler.
"The dSPM computation was modified recently, maybe half-way in your analysis..."
Yes, you were absolute right. I have changed the Brainstorm version during my analysis, so I will make dSPM calculations again for all the subjects.
I would still have some (final) question about sources and probabilities
First, just two simple questions:
Question 1) So, if I set amplitude threshold (Z-value) to 1.96 in normalized source map, I would see the activity that cannot be explained by baseline activity with probability of 95% (p<=0.05), right?
Question 2) Scouts time series y-axis is always z-value if source normalization (wMNE or dSPM) is done, right?
I'm a little a bit confused of different usage of statistical tests and source normalization. With both methods I get p-values, so
Question 3) Is it so, that no matter, if I use a proper statistical test or source normalization, I get the same sort of source map if I use same threshold for p-value?
Question 4) In literature it is said that without MNE normalization more superficial sources are emphasized and some deep sources might be missed. If I use statistical test, do they kind of normalize the MNE, so that also deep sources can be found?
Question 5) Can you advice me when to use normalization and when to use statistical test? In group study tutorial with visual EPs sources were normalized, but in the tutorial of deep sources the thalamic activity between two conditions were shown by statistical test. Is it so, that normalized source maps show only positive z-scores, but statistical test T-values present deviations also to negative scale? Like for example in frequency space, between conditions A and B?
Question 6) If I want to compare two anatomical scouts (for example left against right) in source space, is the only correct way to do this to compute MNE without normalization and do a proper statistical test? Or can I do comparison also with normalized sources within the same condition, when the different number of trials is not a problem?
Question 1) So, if I set amplitude threshold (Z-value) to 1.96 in normalized source map, I would see the activity that cannot be explained by baseline activity with probability of 95% (p<=0.05), right?
Question 2) Scouts time series y-axis is always z-value if source normalization (wMNE or dSPM) is done, right?
Question 3) Is it so, that no matter, if I use a proper statistical test or source normalization, I get the same sort of source map if I use same threshold for p-value?
Normalized with respect to baseline gives you a idea of the significant differences between the brain activity and the baseline.
T-test between two sets of trials or two sets of subject-level averages gives you the significant differences between two experimental conditions.
Question 4) In literature it is said that without MNE normalization more superficial sources are emphasized and some deep sources might be missed. If I use statistical test, do they kind of normalize the MNE, so that also deep sources can be found?
Question 5) Can you advice me when to use normalization and when to use statistical test?
The same bias to the surface would apply to all the subjects, so the results of the statistical tests between two conditions across subjects should not be impacted by this bias with or without normalization.
But if you don't normalize the source maps, the problem you may face is that some some subjects have much stronger signals than others, for various reasons (quality of the recordings, anatomical differences... it is recommended to normalize these values within each subject before the group analysis.
https://neuroimage.usc.edu/brainstorm/Tutorials/Workflows
Is it so, that normalized source maps show only positive z-scores, but statistical test T-values present deviations also to negative scale? Like for example in frequency space, between conditions A and B?
It depends how you normalize... This is up to you to define how you want to normalize your data, there is not one unique answer to this question, it depends on your hypotheses, what you expect to get from the data...
Just make sure you don't get fooled by the configuration of the colormaps: by default, the source maps are displayed in absolute values while the statistical results are displayed in relative values. Both have positive and negative values, but you can decide from the interface if you want to display only the absolute values on the cortex.
Question 6) If I want to compare two anatomical scouts (for example left against right) in source space, is the only correct way to do this to compute MNE without normalization and do a proper statistical test?
Within one single subject, when running a test between trials: no need to normalize.
In a group study, normalization at the subject-level before group analysis is advised.
Thank you so much Francois!
I think I understand now this statistical significance in source space, at least at the basic level.
If I have two conditions, and if I have EPs, ERPs or frequency spectra related to both of these conditions, and if I want to see statistically significant difference between these two conditions, I should use statistical test.
On the other hand, if I have some ERPs of one condition, the normalization of sources with baseline gives me possibility to present only those ERP sources that are significantly different that the sources that explain the baseline activity.
Hi Francois,
For visual ERP exploration I have scaled dSPM results by using the Scale averaged dSPM-function. I assume that if I want to compare visually these wMNE Z-score maps to scaled dSPM maps, I just multiply these wMNE Z-score maps with the square root of averaged trials (as is done with dSPM). Is this right?
This second question might be more complicated. In epilepsy tutorial it was said that noise covariance matrix should be calculated from recordings that do not contain epileptic activity. I understand this, if we are studying the origin and propagation of the epileptic spikes.
I have 20 epilepsy patients in my study and they are all diagnosed with drug resistant epilepsy. In baseline files there was no seizures, but there might be some constant epileptiformic activity (for example inter-ictal spikes) and at least many of these subjects have abnormal EEG.
How should I select the data in baseline file and the data for noise covariance calculations in a way, that I can minimize the effect of different abnormal brain activity between the subjects in group analysis? For example, if I have found ERP and I want to find out where is it originating from and if I assume that this abnormal brain activity has no effect on this ERP, how should I proceed to normalize subject averages (dSPM or wMNE) before group analysis (noise covariance and baseline selection)?
Now, if my assumption is wrong and if these ERP sources would be influenced by individual epileptic activity, would it be so, that I could not see this effect on source level, if I have used baseline data which contains epileptic activity? On the other hand, if I find normal EEG for baseline and for noise covariance, would it be then possible to see the effect of epileptic activity to ERP sources?
Sorry, that this last topic was so messy. It is because I don't understand the effects of noise de-whitening and normalization to source maps well enough.
Thank you in advance!
I think the scaled dSPM values and the Z-scored min norm should give you similar ranges of values (Z values). But I agree that the documentation in the tutorial is maybe a bit misleading and seems to indicate that unscaled dSPM are comparable to Z-scores.
@pantazis Can you please clarify?
Thanks
How should I select the data in baseline file and the data for noise covariance calculations in a way, that I can minimize the effect of different abnormal brain activity between the subjects in group analysis?
The epilepsy tutorial shows none of the type of spikes of interest in the baseline we selected.
If you think you can't isolate any recordings that are free from the type of epileptic activity you are studying, you have the option to leave the model completely uninformed regarding the level of sensor noise, and use the option "No noise modelling", as suggested in the noise covariance tutorial:
https://neuroimage.usc.edu/brainstorm/Tutorials/NoiseCovariance#Variations_on_how_to_estimate_sample_noise_covariance
how should I proceed to normalize subject averages (dSPM or wMNE) before group analysis (noise covariance and baseline selection)?
dSPM: no additional normalization
wMNE: Z-score normalization
General recommendations:
https://neuroimage.usc.edu/brainstorm/Tutorials/Workflows
Example pipeline:
https://neuroimage.usc.edu/brainstorm/Tutorials/VisualSingle
https://neuroimage.usc.edu/brainstorm/Tutorials/VisualGroup
Now, if my assumption is wrong and if these ERP sources would be influenced by individual epileptic activity, would it be so, that I could not see this effect on source level, if I have used baseline data which contains epileptic activity?
It is unlikely that epileptic activity would be time-locked with your stim, therefore it should not impact much your ERP. But you have to check for this indeed.
Mattiher,
I did not go through the long message history, but here are some thoughts that may answer some of your questions.
In Brainstorm, when you compute a dSPM solution by default you obtain what we call ‘dSPM-unscaled’. This allows us to easily manipulate data by linearly combining trials (e.g. averaging) and still keeping track of the underlying distributions. When you want to visualize the actual dSPM, you should run the process “sources->scale averaged dSPM” which will multiply the source maps with sqrt(Leff), where Leff is the effective number of trials. This multiplication will convert the maps to have z-distribution in the baseline.
wMNE with z-score normalization should give you something similar to dSPM but not exactly the same. This is because this normalization uses the baseline time series to estimate the standard deviation, so it depends on how many time samples you have and is not as precise as the dSPM estimation, which uses the noise covariance. Further differences may arise by manipulating the data for example with low-pass filters. In such case the baseline time series will have reduced variance and the z-normalization will give you different results.
When you extract scout time series, there are different ways to summarize activity within the scout. The default is ‘mean’, which will average (with some care for opposite signs) the time series of all the sources within the scout. Such average will lead to reduced variance, and thus your scout time series will no longer be z-distributed in baseline. Because sources within a scout are heavily correlated in time, we cannot simply normalize them with the number of averages to keep them z-scored. The only way to normalize them again is to then explicitly z-score-normalize the scout time series.
Best,
Dimitrios
Hi!
Thank you for your explanations and for helping me. I misunderstood the tutorial. Now I understand why my wMNE and dSPM scales are not identical, even if I see that the same regions are active with both methods. It was just a coincidence, that when I erroneously multiplied wMNE with the same value as dSPM, I got more similar values for dSPM and wMNE scales. Thank you Pantazis also for explaining z-distribution of scout time series! You are really great in this forum!