first, I would like to thank the Brainstorm team for the great work. I am really enjoying this toolbox.
I am working with EEG data (64 channels) to compare oscillatory responses between 2 conditions in a motor task. In the first step of my analyses I calculated time frequency analyses of the pre-processed raw data. Based on previous literature, I constrained the analyses to theta and beta frequencies. TF analyses was calculated for all single trials, then averaged within a subject and condition, and then baseline-normalized (in db). These normalized, averaged TF data were then averaged across the whole population (n=25). Finally, I calculated the difference between condition A and B at the time of interest (200 - 500 ms after stimulus onset). The results show differences in frontal electrodes. In confirmed this by statistics (permutation tests). So far so good.
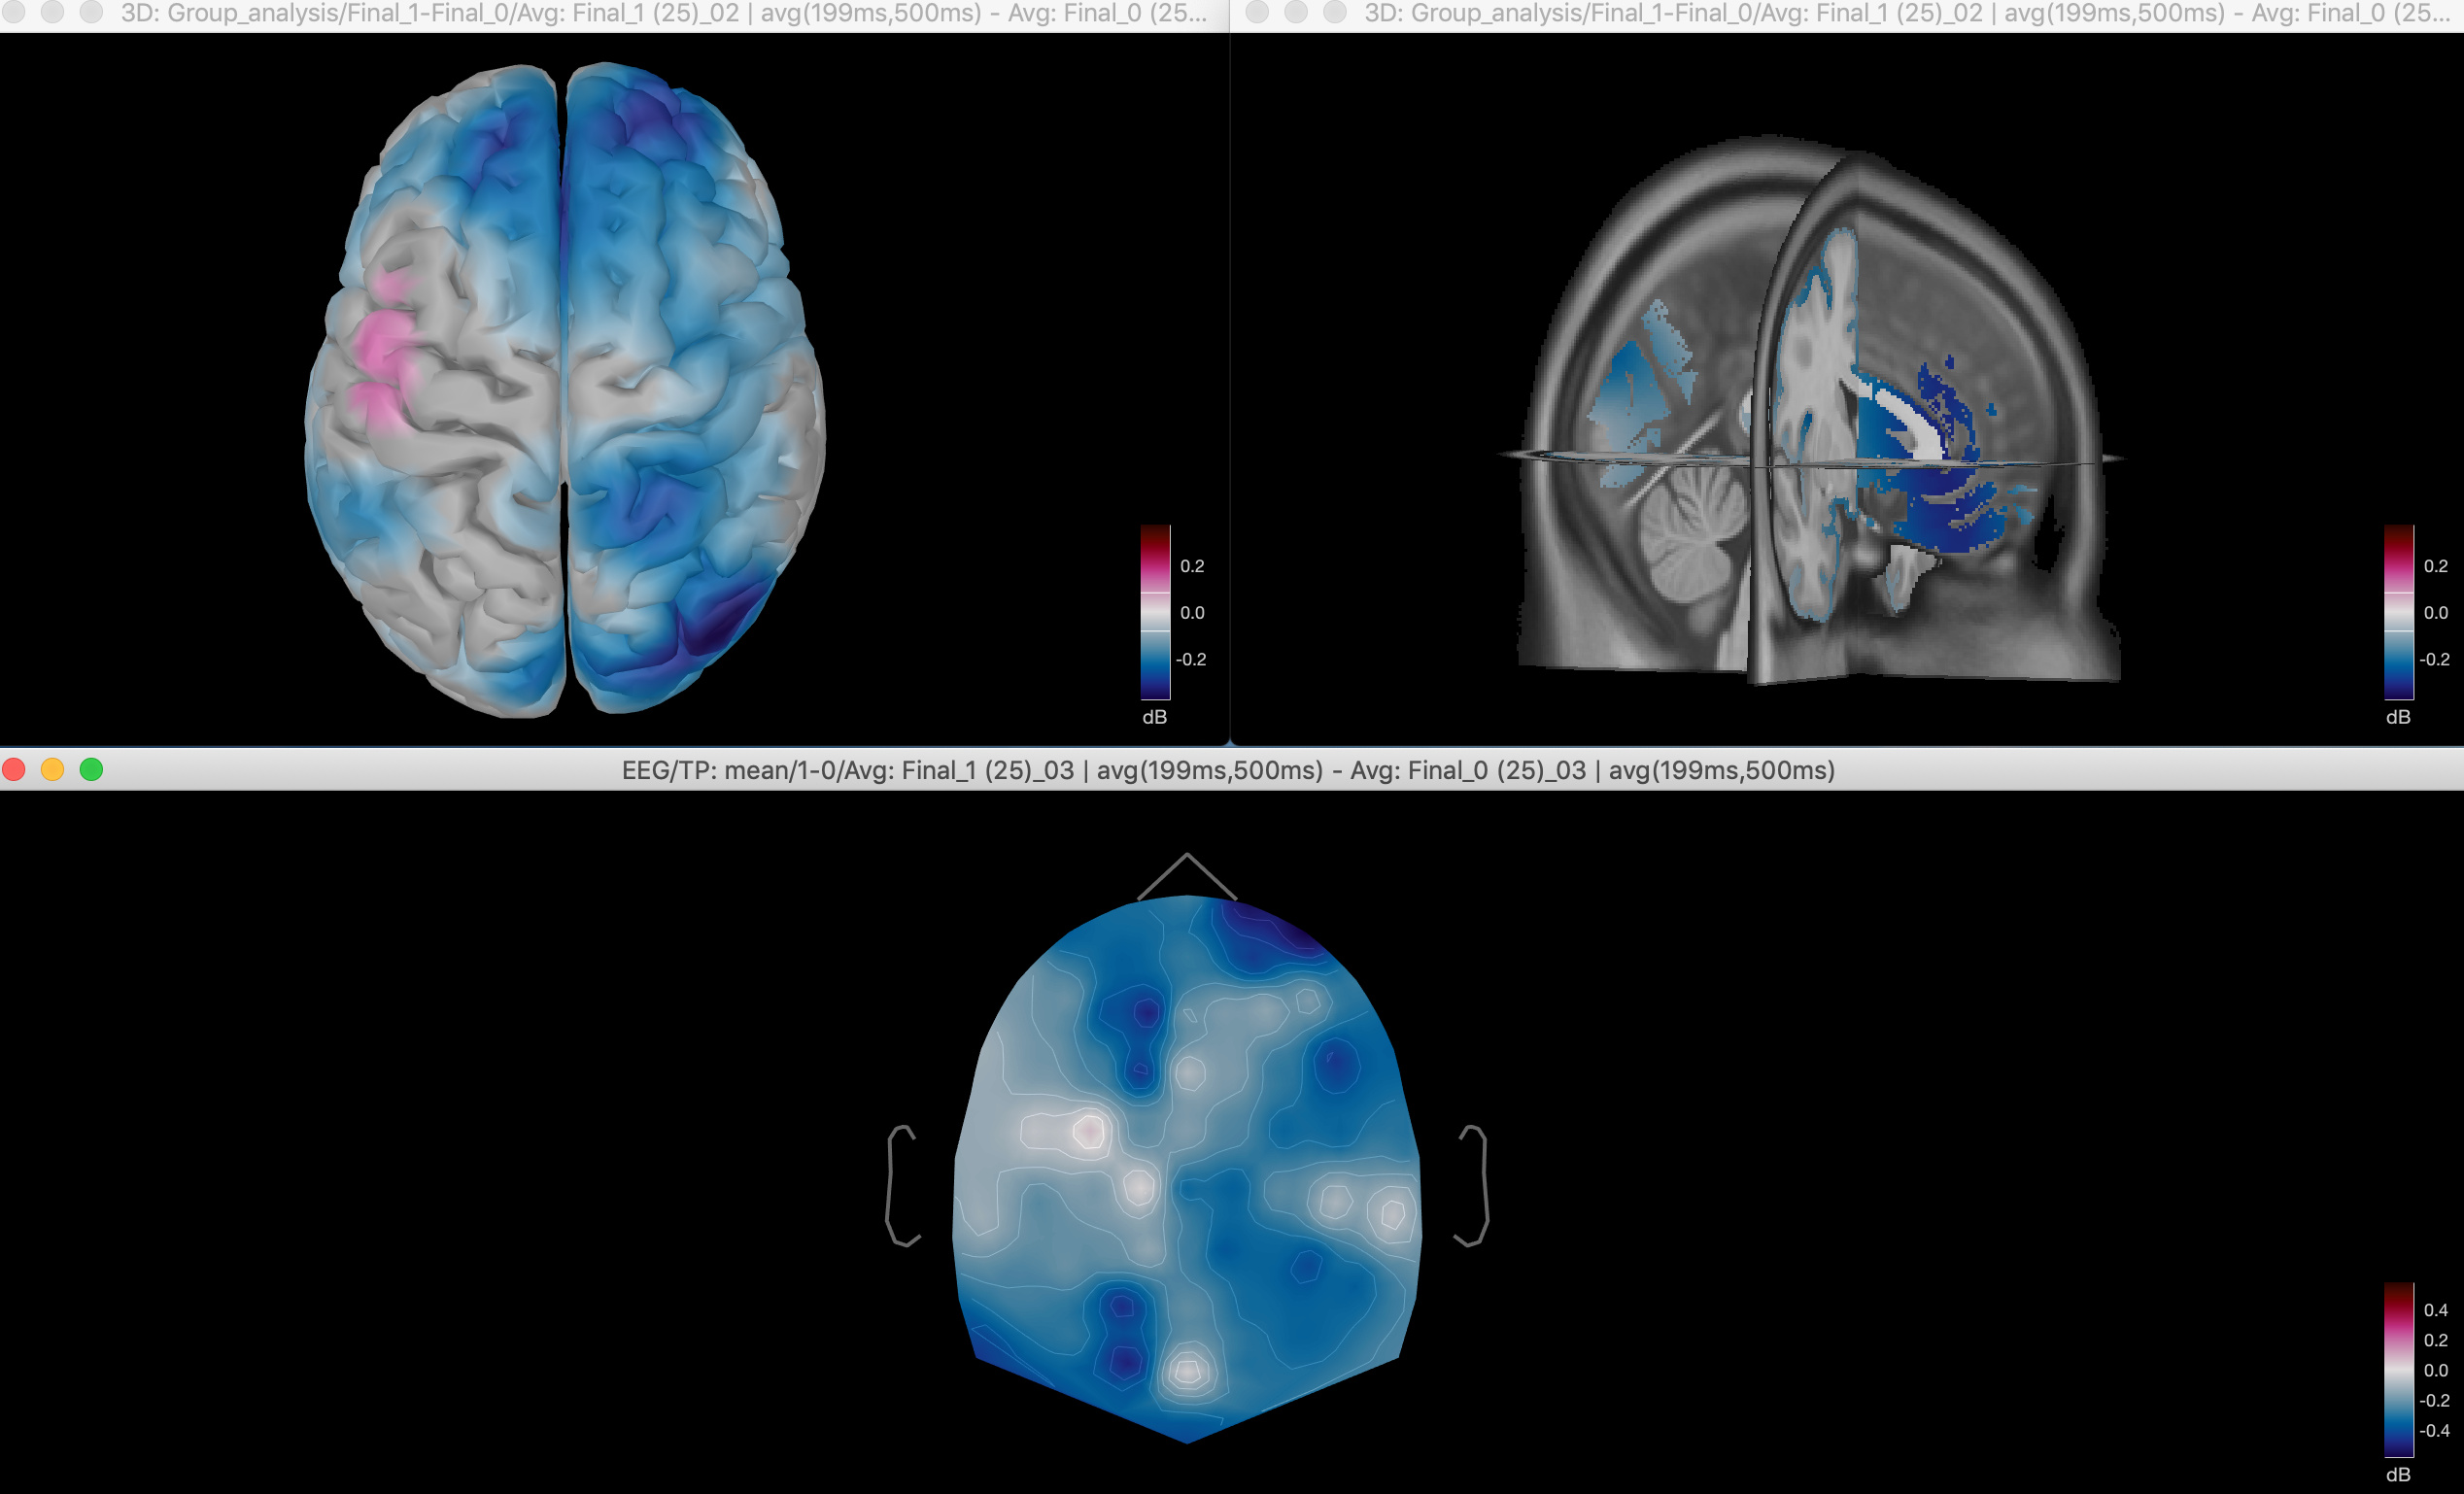
Now, I would like to perform source localization on these effects. I followed all the tutorials and some discussions in the forum. I ended up calculating time frequency analyses (with Morlet wavelets) on source data (current density maps, unconstrained sources). Since I do not have individual MRI available, I am using the ICBM152 and a OpenMEEG BEM model that is constrained to the cortical surface (15000 vertices). I performed the same TF analyses as described before but this time on the source data. In comparison to the sensors space data, the source space data look reasonable to me when looking at the cortical surface. However, there are also profound differences deeper within the interhemispheric fissure when looking at the 3D MRI. I attached the group-level averages for the theta band.
Do you think my whole approach makes sense? I have some difficulties to interpret the source results regarding activity in the areas within the interhemispheric fissure as I was not expecting this. This is probably because many of the medial electrodes (Cz, Fcz, Fz) showed strong activity. The same results is also present when looking at the single condition (not the differences between the conditions). Would be great if anyone can comment on that.
Further, I was wondering whether the db normalization for the TF source data is reasonable? I saw that you recommend z-scores?
If you need more information on my analyses, let me know.
In comparison to the sensors space data, the source space data look reasonable to me when looking at the cortical surface. However, there are also profound differences deeper within the interhemispheric fissure when looking at the 3D MRI.
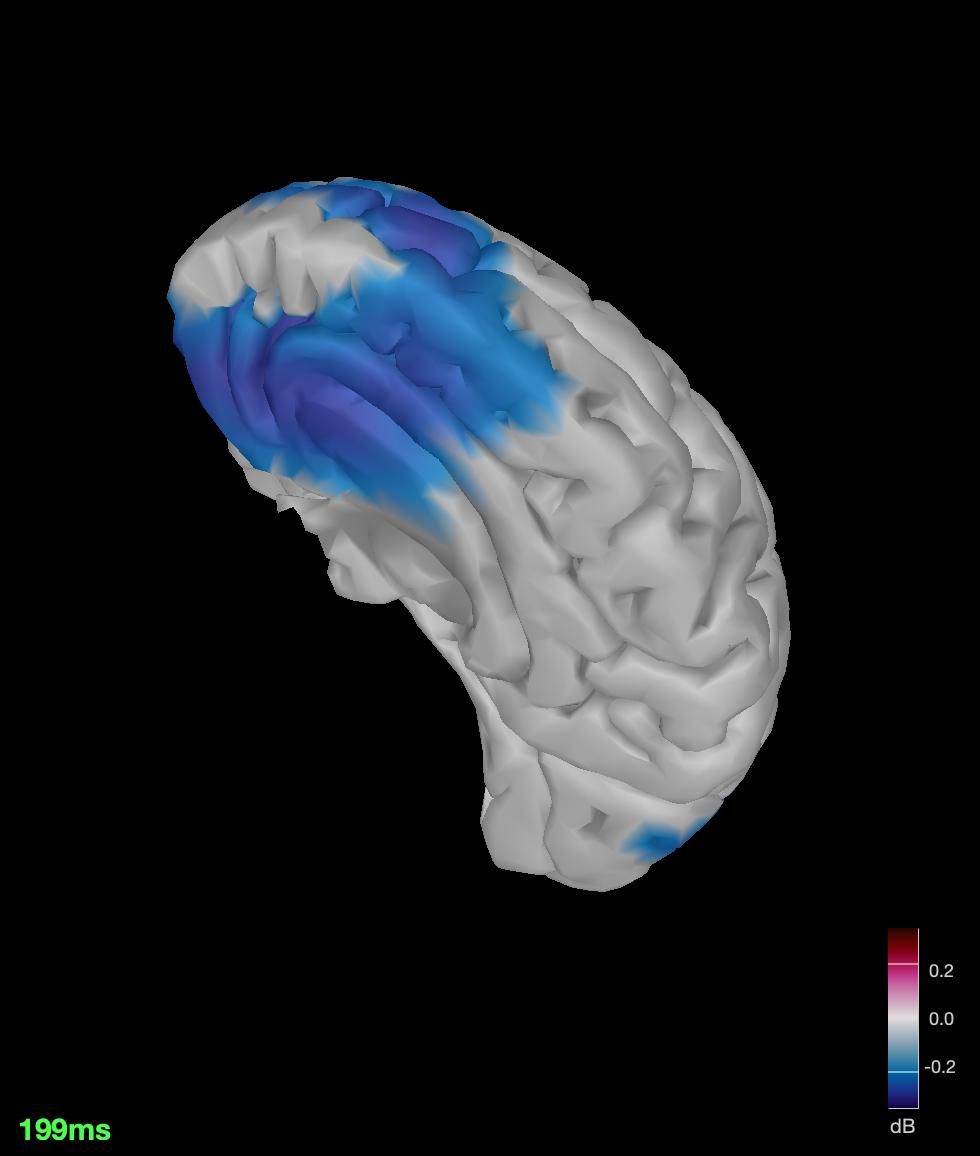
It looks like your estimated sources are very similar on the cortex surface or in the volume: in the surface tab, click on the "left" of "right" buttons to show only one hemisphere, and you will probably see the same very central sources. The two approaches are expected to give similar results when using unconstrained source models.
The MNE solution reconstructs source maps involving all the dipoles of in the source space provided. Both in the surface and volume source spaces, there are some deep dipoles, which get attributed some activity. The activity of these central regions is a linear combination of the EEG data for the surrounding electrodes. If you have one electrode nearby that has an important increase in a condition A vs a condition B, then the value of these deeper sources will also increase significantly.
Event if at the source reconstruction step, the current values estimated in these regions is lower than in more superficial regions, it increase might still be significant, and show up in the normalized maps and in the final statistical analysis.
In the end, I think what you observe deep in the frontal lobe is only a projection of the high deviation observed in your right-frontal electrodes.
And this right-orbitofrontal pattern could be related with ocular artifacts. Check again carefully for eye movements and blinks in the epochs of your condition B - review them one by one with the shortcut F3.
Further, I was wondering whether the db normalization for the TF source data is reasonable? I saw that you recommend z-scores?
Yes, this is reasonable. Prefer using a type of normalization 1) you are familiar with and you understand well 2) that is commonly used in your research field and for the type of data you process.
I understand your argumentation and it makes sense to me. Looking at the cortical surface (only one hemisphere) was a good hint :-). Indeed, it looks like orbifrontal/cingulate cortex but as you mentioned I should be careful in interpreting these "deeper" sources.
Since I removed ocular components (via ICA) during my preprocessing, I do not think that it is due to artifacts. These frontal effects are also well in line with other studies, so that makes sense.
As mentioned before, I constrained my source model to the cortical surface (no volume model, I just plotted the cortical surface results on the 3D MRI). The results for constrained and unconstrained dipoles are similar, though the unconstrained option yields smoother results and is more appropriate since I don't have individual MRIs.
I could have a look at the sources using a MRI volume model. However, I don't think that would add a lot since I am mainly interested in cortical regions. It would also take a lot of further processing time (I assume the number of vertices would be higher?). Or would that be necessary based on what I see in the cortical surface results? Would be great if you can briefly comment on that.
The total number of source points could be similar, depending on the distance between your source points on the volume grid. Overall, the surface/unconstrained and volume source models would provide very similar information, but I find volume results more difficult to review and to work with in general. Having the data projected on the cortical surface makes the visualization easier.
If you are satisfied with the current results, there is no need to do anything else.