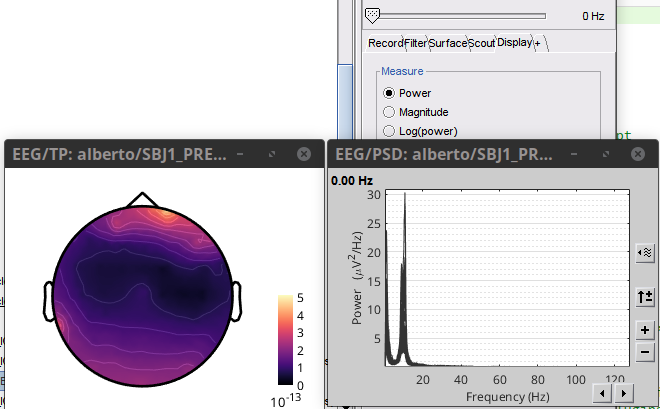
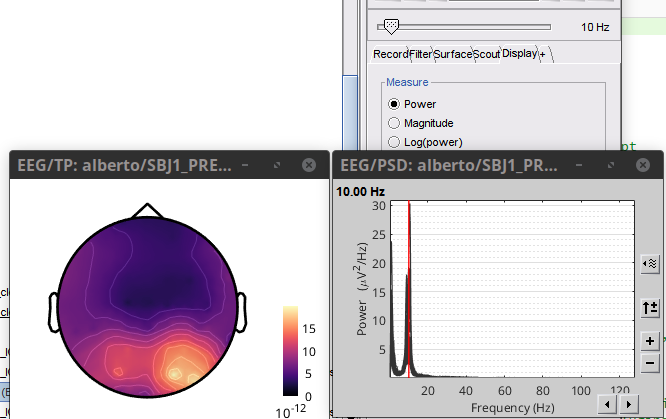
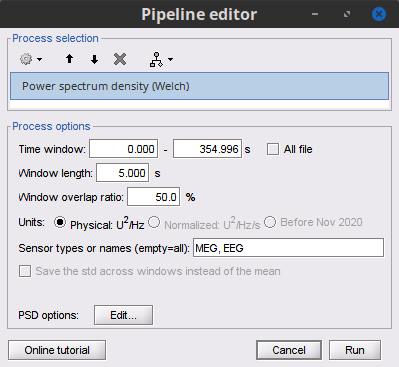
Plotted PSD as spectrum, displayed with power option, i.e., physical units [μV^2/Hz], the frequency range of interest is in 10*10^-12 order.
3.Plotted PSD as spectrum, displayed with log(power), in physical units, the freq range should be in around 10*log10(10*10^-12) i.e., around -110dB, which was the case.
Plotted the PSD on the 2D disk, using power and log(power) and noticed dB was correct but with opposite sign, absolute value was computed.
Yes i did all the same steps but I can't visualize the frequencies (e.g. 20 40 60 80 100 120) as you and your power spectrum is cleaner than mine.
How can I fix it?
Those frequencies are in the spectrum, but it has x-axis in log scale. Change it to linear: right-click on the Spectrum figure > Figure > X scale linear
I have two more questions. I am working with Multiple Sclerosis patients who have WM lesions and it should be very important to load both the lesion mask and the tractography to visualize both the fibers involved by EEG activity over time and to see how the eeg activity changes corresponding to the lesions.
How do you think I can do this?