Virtual Fiber Tracks for Connectivity Visualization
Authors: Martin Cousineau, Takfarinas Medani
Brainstorm offers rudimental ways to interact with your connectivity matrices extracted using the different functional connectivity measures available.
Contents
Importing Fibers
Many tools and algorithms exist to extract white matter fibers from diffusion MRI data. Similarly to how other anatomy files are handled in the software, you cannot create fibers in Brainstorm but rather import existing fiber tracts produced with other software. Brainstorm supports the most commonly used fiber tract format: TRK files.
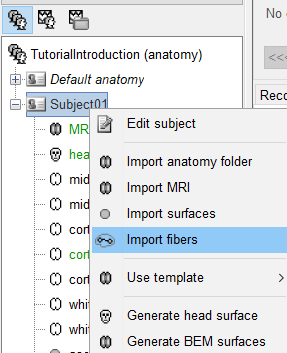
To import your own fiber files, go to the Anatomy view, right click on your subject and select Import Fibers.
If you do not have anatomy files or fiber tracts for your own anatomy, we have a template fiber tract available to you and aligned to the ICBM152 template. You can download it here. Refer to the following publication for how this template file was produced.
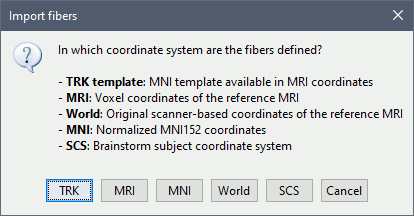
You can select the coordinate system in which the 3D positions are saved in the file you are importing. When using the template distributed on this page, always select "TRK template". When using this template on anatomy different from the ICBM152 template, the MNI normalization computed for the subject is used to transform the fibers to the subject space.
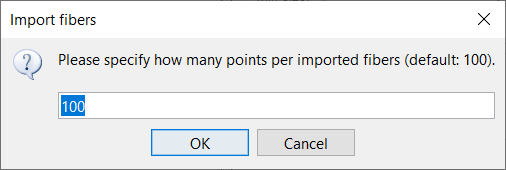
You are prompted to enter the number of points you want your fibers to have. By default, we recommend 100 points for optimal visualization as you often cannot tell the difference when you increase the resolution. If you find your computer struggling to display your fibers, feel free to reduce this resolution for better performance.
You can import multiple fiber files for the same subject. Note that the selected fiber file (the one in green) will be chosen by default when an action in Brainstorm requires fibers. You can double click on a fiber file to select it.
Displaying fibers
Once imported, your fiber file will be listed in the anatomy view of your subject. You can now visualize this fiber object on its own or with any other anatomy files using Brainstorm's 3D viewer.
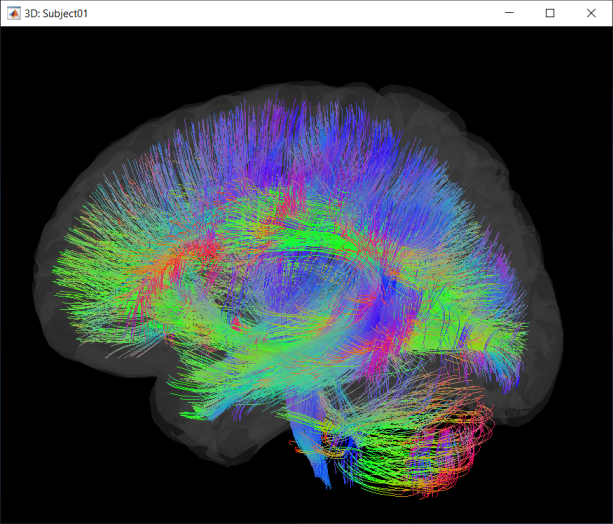
The default colormap is based on the underlying fiber orientation, with fibers oriented left-right colored in red, anterior-posterior in green and superior-inferior in blue.
Connectivity visualization
Once you have NxN connectivity results extracted, you have three ways of displaying your result.
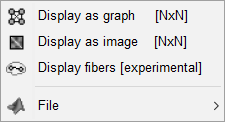
You can display it as an image, where you can see your NxN connectivity matrix.

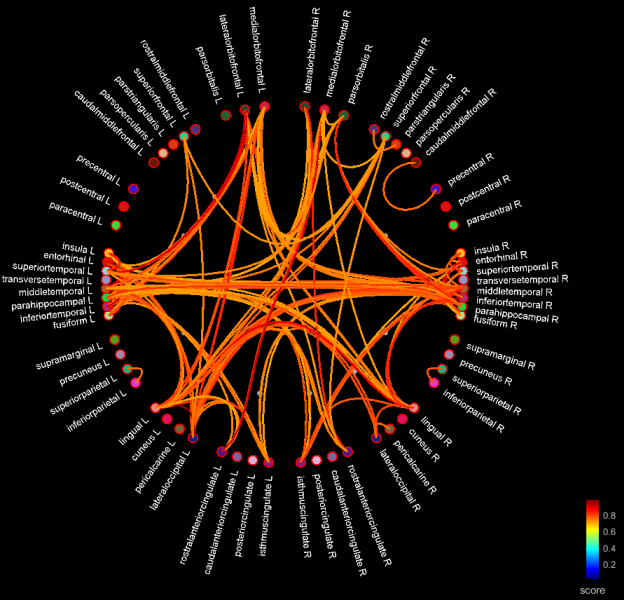
If you display it as a graph, you see all your regions spread out along a circle, with lobes grouped together and hemispheres separated. Regions are connected based on a threshold on distance and connectivity measure intensity. You can adjust the thresholds from the Display tab.
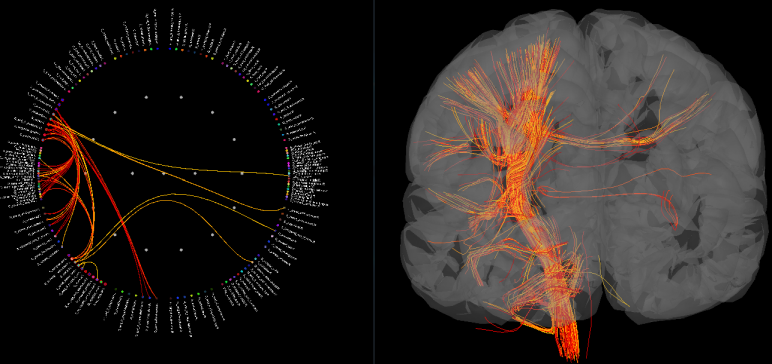
Finally, if you have fibers imported for this subject, you can display your connectivity results with both a graph and your fibers. Brainstorm will assign each fiber to a connection in the graph on the fly. That means that as you play with the thresholds on your connections or narrow your display to a specific lobe or hemisphere, you will get to see in real time the fibers in the brain related to your connectivity results.
You also now have an additional option in the Display tab: to show anatomically accurate connections. This will only show connections in your graph that have an associated fiber in your fiber file. This can help your interpretation as to whether a significant connection is a direct anatomically accurate connection in the brain or not.
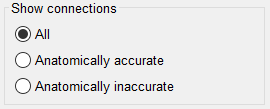
Disclaimer: This assumes that your fiber file contains all accurate connections in the brain and that its assignment to your surface scout is perfect, which is not exactly the case so do keep that in mind in your interpretation.
Additional documentation
Article
Yeh, F.C., Panesar, S., Fernandes, D., Meola, A., Yoshino, M., Fernandez-Miranda, J.C., Vettel, J.M. and Verstynen, T., "Population-averaged atlas of the macroscale human structural connectome and its network topology", NeuroImage, vol. 178, pp. 57-68, 2018.
Tutorial
