Hello there Brainstorm team, (sorry for the long post in advance)
For the past few days, I've been trying to generate a multitaper spectrogram (in the context of sleep EEG) using the method provided by Prerau et al. (2017). The authors of the article have thankfully shared the MATLAB code online that can generate their multitaper spectrogram.
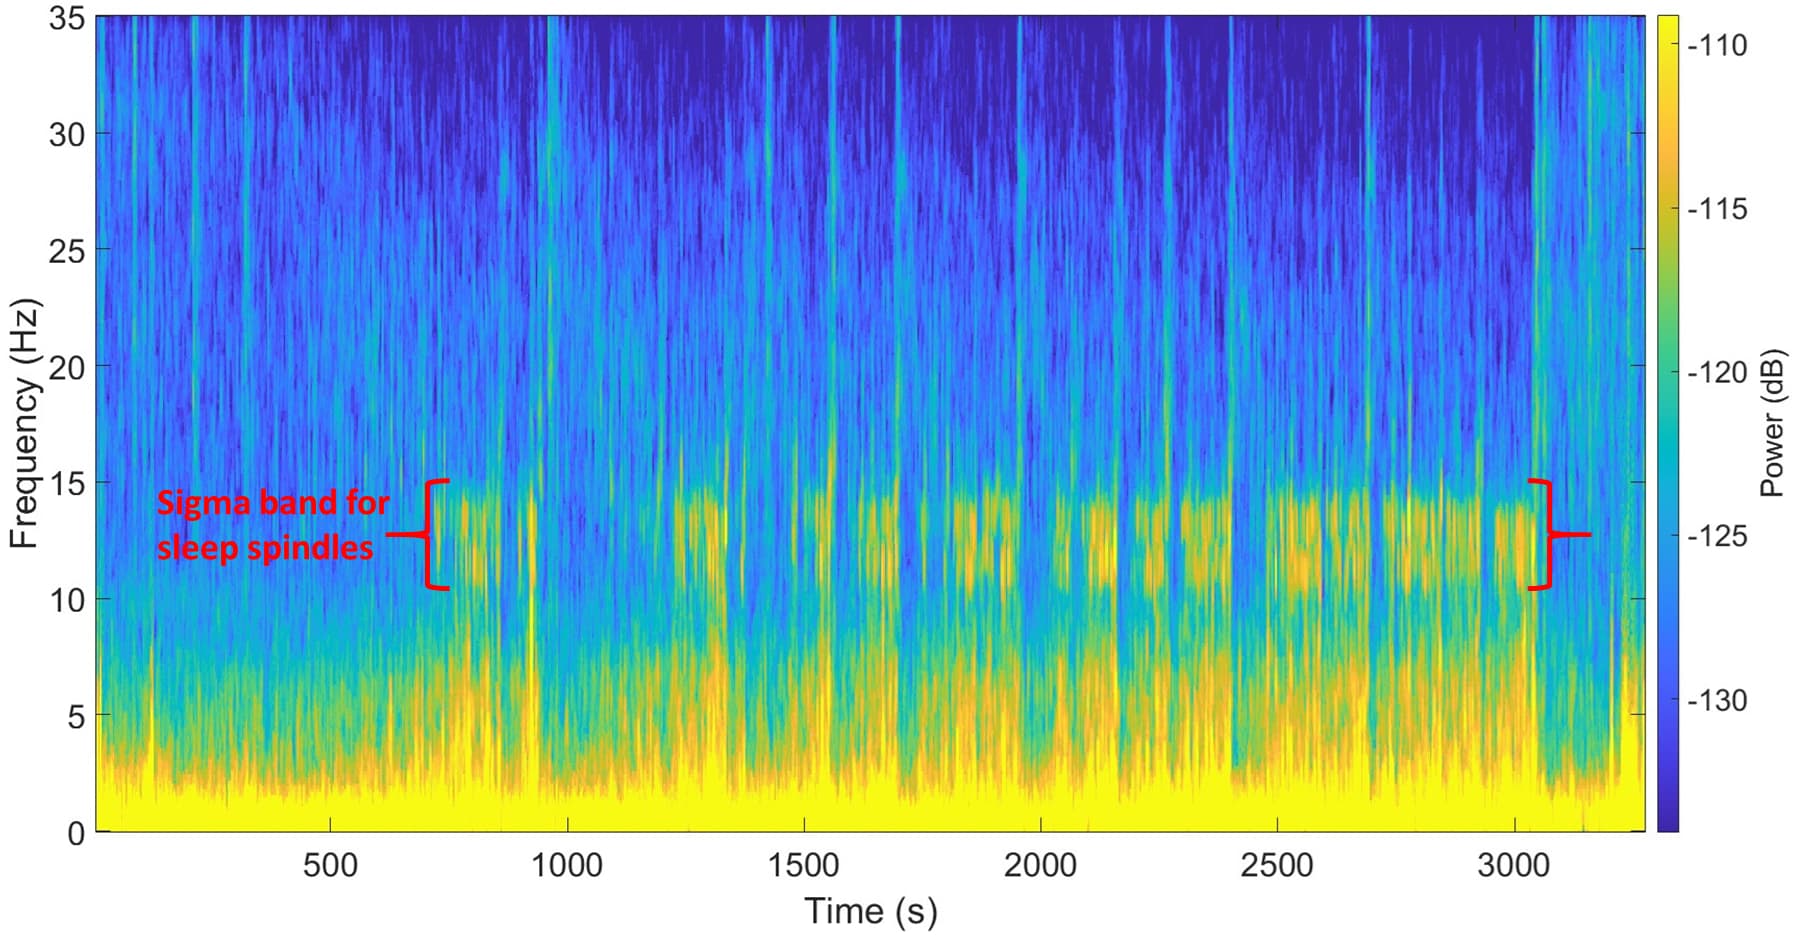
I was able to successfully generate the below multitaper spectrogram (Fpz channel) using the codes provided by the authors. The spectrogram shows a participant during sleep, specifically stage N2 of NREM sleep, which is shown by the sigma band representing sleep spindles (EEG hallmark of stage N2 sleep).
The code works relatively well but I was wishing to implement this multitaper spectrogram within Brainstorm to make things easier for me. Then I realised that Brainstorm has the process "FieldTrip: ft_mtmconvol (Multitaper)" already. Upon inspection, this process is somewhat similar to the multitaper spectrogram provided by Prerau et al. (2017). In an ideal situation, both the multitaper spectrogram and the TF sigma peaks (TF sigma peaks are my research interests) would be implemented in Brainstorm and I really would like to ask the Brainstorm team to perhaps consider implementing these two codes but of course, I understand that this will be a long task and you probably have more important implementations to do.
Therefore I thought about comparing and contrasting "ft_mtmconvol (Multitaper)" versus the multitaper spectrogram as provided by Prerau et al. (2017) in the hopes that I can somehow closely replicate the above multitaper spectrogram but using "ft_mtmconvol (Multitaper)". To properly understand "ft_mtmconvol (Multitaper)" I have consulted these forum/tutorial posts first.
First of all there are some things that I don't really understand so I will begin with some questions.
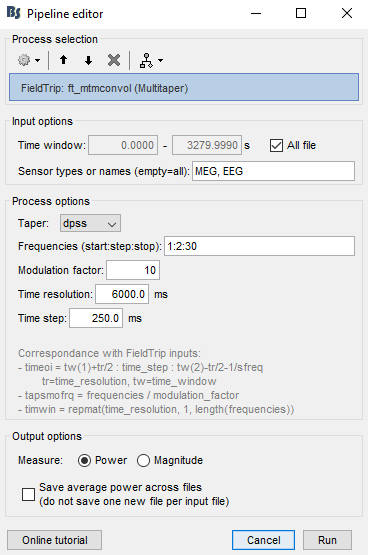
The below is the correspondence with FieldTrip inputs that Francois included in the "ft_mtmconvol (Multitaper)" process
- timeoi = time_window(1)+time_resolution/2 : time_step : time_window(2)-time_resolution/2-1/sfreq
- tapsmofrq = frequencies / modulation_factor
- timwin = repmat(time_resolution, 1, length(frequencies))
From the above statements:
a) what does time_window (1) and time_window (2) mean?
b) in this notation ": time_step :" what does the notation ":" indicate?
Is this saying "timeoi = time_window(1)+time_resolution/2 = time_step = time_window(2)-time_resolution/2-1/sfreq"?
Or is this saying "timeoi = time_window(1)+time_resolution/2 and time_step = time_window(2)-time_resolution/2-1/sfreq"?
The notation written seems a bit confusing for me.
c) what does "1/sfreq" mean?
d) in "tapsmofrq = frequencies / modulation_factor", what does "frequencies" mean exactly?
Is this the interval between the start and stop frequency? (i.e. stop minus start frequency)?
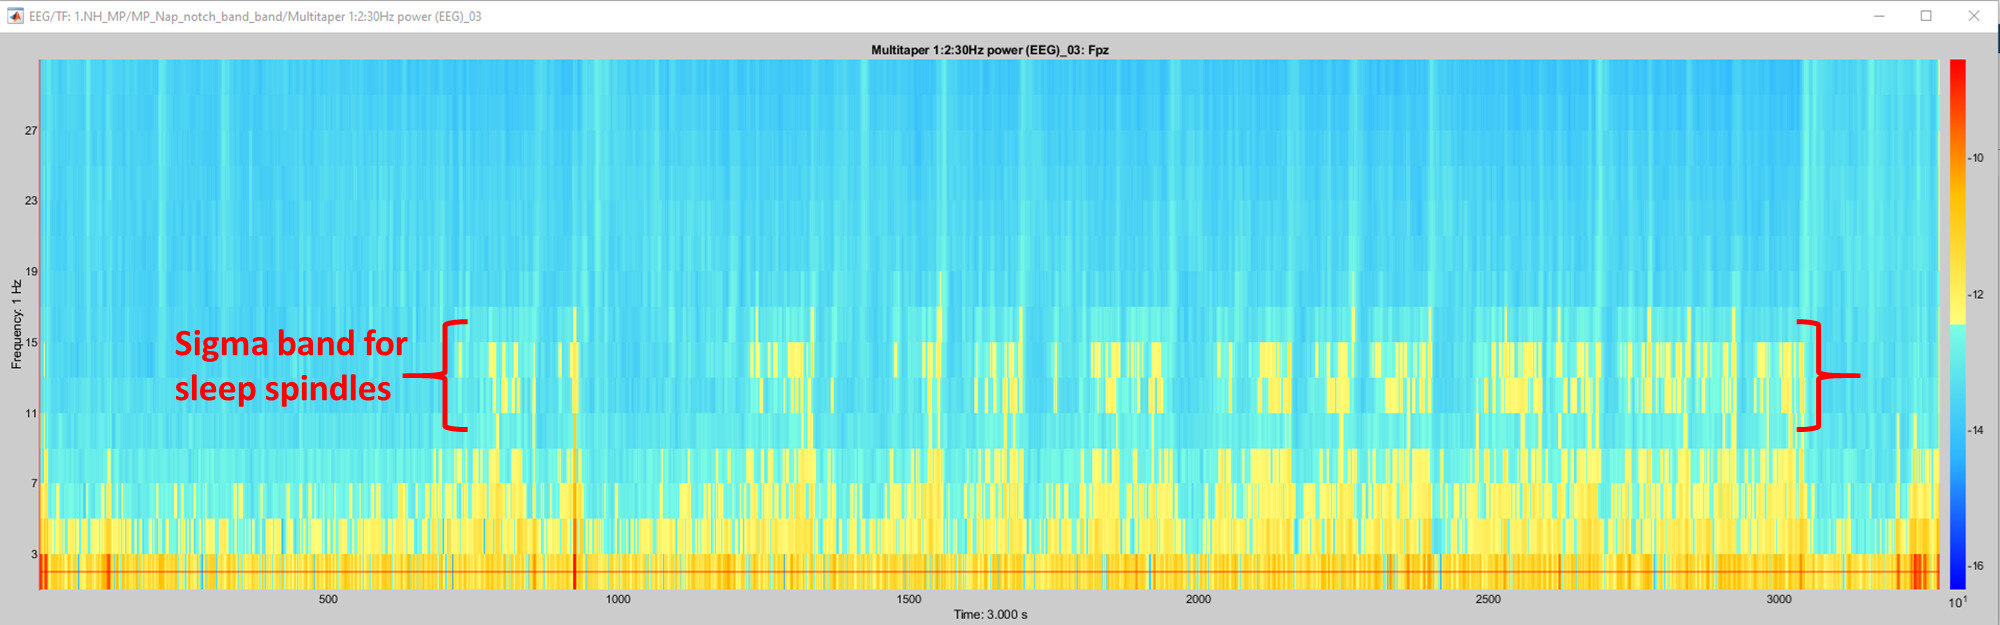
After playing with "ft_mtmconvol (Multitaper)" process I was able to generate the following TF decomposition from Fpz channel using the below inputs. If you compare Prerau et al. (2017)'s multitaper spectrogram versus "ft_mtmconvol (Multitaper)" TF decomposition they do look similar with respect to the overall TF activity pattern. However, it would be better if they looked even closer in similarity versus what I generated. But before I go any further, what are the units for the colour bar on the right side of the TF decomposition?
Therefore I did some further compare and contrasting...
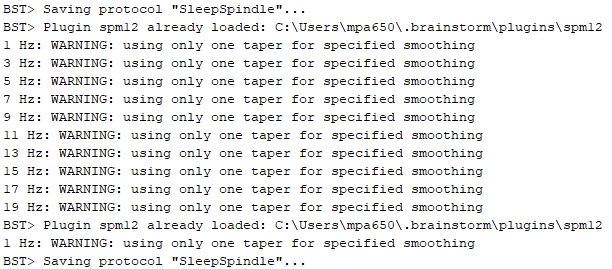
a) Looking at MATLAB command window I discovered something interesting.
The command window states that only one taper was used. Unlike Prerau et al. (2017) FieldTrip does not let the user specify the number of tapers therefore I am uncertain as to how only one taper was used. Any thoughts would be appreciated.
b) The below is the raw code that I copied from Prerau et al. (2017)'s multitaper spectrogram MATLAB code which highlights all the inputs required to run the function.
If you compare the below code to the inputs required by "ft_mtmconvol (Multitaper)" one can make the following observations.
- data and Fs are given by the data present - so this is of no concern
- frequency_range (I think) is the FieldTrip equivalent of "frequencies (start:step:stop)" - except Prerau et al. (2017) does not specify the "step" frequency
- taper_params are the inputs that FieldTrip does not require but Prerau et al. (2017) does.
- window_params (I think) are the FieldTrip equivalent of "Time resolution" and "Time step".
- FieldTrip does not have detrend_opt, min_NFFT and weighting of tapers.
As my goal is to replicate (as close as possible) the Prerau et al. (2017) multitaper spectrogram using "ft_mtmconvol (Multitaper)", my question here is what FieldTrip input do you think I should modify to make the FieldTrip TF decomposition as smooth as possible like Prerau et al. (2017)'s multitaper spectrogram?
For reference I used taper_params = [5 9]; and window_params = [6 0.25]. That is...
- time-halfbandwidth product = 5
- number of tapers = 9
- window size (secs) = 6 s
- step size (secs) = 0.25 s
%   Input:
%       data: <number of samples> x 1  vector - time series data-- required
%       Fs: double - sampling frequency in Hz  -- required
%       frequency_range: 1x2 vector - [<min frequency>, <max frequency>] (default: [0 nyquist])
%       taper_params: 1x2 vector - [<time-halfbandwidth product>, <number of tapers>] (default: [5 9])
%       window_params: 1x2 vector - [window size (seconds), step size (seconds)] (default: [5 1])
%       detrend_opt: string - detrend data window ('linear' (default), 'constant', 'off');
%       min_NFFT: double - minimum allowable NFFT size, adds zero padding for interpolation (closest 2^x) (default: 0)
%       weighting: string - weighting of tapers ('unity' (default), 'eigen', 'adapt');
%       plot_on: boolean to plot results (default: true)
%       verbose: boolean to display spectrogram properties (default: true)