SEEG Time-Frequency Fingerprint Analysis for Epileptogenic Zone Localization (under construction)
Authors: xxx
This tutorial introduces some concepts that are specific to the management of intracranial, SEEG recordings in the Brainstorm environment, and explains how to compute time-frequency decomposition maps to identify epileptogenic zone using ictal and interictal SEEG recordings. It is based on a clinical case from the McGovern Medical School, University of Texas Health Science Center at Houston, Texas, USA.
Note that the operations used here are not detailed, the goal of this tutorial is not to introduce Brainstorm to new users. For in-depth explanations of the interface and theoretical foundations, please refer to the introduction tutorials.
NOT FOR CLINICAL USE:
The performance characteristics of the methods and software implementation presented in this tutorial have not been certified as medical devices and should be used for research purposes only.
Contents
- Dataset description
- Download and installation
- Import the anatomy
- Electrode labeling and contact localization
- Access the recordings
- Display the depth electrodes
- Review recordings
- Import epochs of interest
- Head modeling
- Compute noise covariance matrix
- Modeling interictal spikes
- Modeling ictal wave
- Modeling ictal onset with LVFA
- Modeling ictal onset with repetitive spiking
- Edit the contacts positions
- Export the contacts position
- Additional Documentation
- Scripting
Dataset description
License
This tutorial dataset (EEG, MRI and CT data) remains property of the McGovern Medical School, University of Texas Health Science Center at Houston, Texas, USA. Its use and transfer outside the Brainstorm tutorials, e.g. for research purposes, is prohibited without written consent. For questions, please contact Yash Shashank Vakilna, MS ( Yash.Shashank.Vakilna@uth.tmc.edu ).
Clinical description
The dataset was recorded at the Epilepsy Monitoring Unit at UTHealth Houston. It includes recordings for a patient who was a 25-year-old right-handed woman with drug-resistant epilepsy since age six and a prior right parietal opercular corticectomy at 15 presented with weekly focal aware seizures featuring a left-hand tingling aura and focal impaired awareness seizures with staring and pouting. In the Epilepsy Monitoring Unit (EMU) she had intermittent right parietal slowing and ten habitual seizures arising from C4-P4, and MRI revealed bilateral perisylvian polymicrogyria (PMG), pachygyria, right posterior temporal periventricular nodular heterotopia, and post-surgical changes. MEG localized discharges to the right superior parietal region adjacent to her previous resection, and SEEG implantation mapped two distinct onset patterns: low-voltage fast activity in right superior parietal PMG during focal aware seizures and repetitive spiking in posterior insular PMG during impaired awareness seizures. After multidisciplinary review, she underwent uncomplicated MR-guided laser interstitial thermal therapy targeting the right superior parietal and posterior insular PMG and remained seizure-free at one-year follow-up.
SEEG recordings
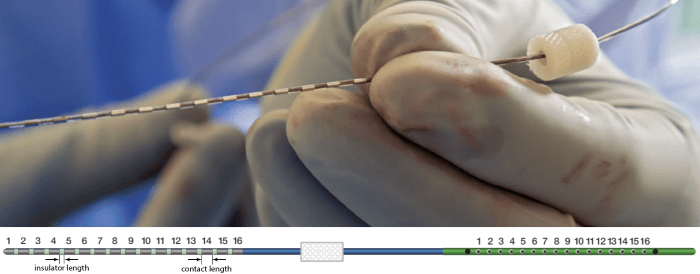
The depth electrodes used in this example dataset are PMT SEEG Depth Electrodes, with the following specifications:
- Diameter: 0.8 mm
- Contact length: 2 mm
- Insulator length: 1.5 mm
- Distance between the center of two contacts: 3.5 mm
- Between 8 and 16 contacts on each electrode
Files
tutorial_seizure_fingerprinting/
anatomy/: Anatomy data
pre_T1.nii.gz: Raw pre-implantation T1 MRI (in NIfTI-1 format)
post_CT.nii.gz: Raw post-implantation CT scan (in NIfTI-1 format)
cat12: Folder containing precomputed CAT12 segmented surfaces from the MRI above. More details about the files can be found in tutorial MRI segmentation using CAT12.
recordings/: SEEG recordings
Baseline.edf: Raw SEEG recordings (in EDF format) for baseline
ictal_repetitive_spike.edf: Raw SEEG recordings (in EDF format) for seizure with Ictal repetitive spiking
interictal_spike.edf: Raw SEEG recordings (in EDF format) for interictal spike
LVFA_and_wave.edf: Raw SEEG recordings (in EDF format) for seizure onset with Low-voltage-fast-activity
Subject01_electrodes_mm.tsv: Position of contacts localized using Brainstorm in world coordinates, relative to the post-implantation CT. The advanced section Electrode labeling and contact localization explains how it was done.
References
All details for this study can be found here: https://zenodo.org/records/14807262
Download and installation
Requirements: You have already followed all the introduction tutorials and you have a working copy of Brainstorm installed on your computer.
SPM: If you are running Brainstorm from the MATLAB environment, you need to have the SPM12 toolbox installed on your computer, as a Brainstorm plugin or a custom installation.
With the stand-alone compiled version of Brainstorm: all the needed SPM scripts have been compiled and included in the executable. This is required for two purposes:- Coregistration between pre-implantation MRI and post-implantation CT volumes.
Use mask from SPM based tissue segmentation to remove extracranial regions from the CT.
OpenMEEG: To compute the forward head model the OpenMEEG Brainstorm plugin is required.
Download the dataset:
Go to the Download page of this website, and download the file: tutorial_seizure_fingerprinting.zip.
- Unzip it in a folder that is not in any of the Brainstorm folders (program folder or database folder).
Brainstorm:
- Start Brainstorm
Select the menu File > Create new protocol. Name it "TutorialSeizureFingerprinting" and select the options:
"No, use individual anatomy",
"No, use one channel file per acquisition run".
Import the anatomy
Pre-implantation MRI
Right-click on the TutorialSeizureFingerprinting folder > New subject > Subject01.
Keep the default options you defined for the protocol.Switch to the Anatomy view of the protocol.
Right-click on the subject node > Import MRI.
Set the file format: MRI: NIfTI-1 (*.nii;*.nii.gz).
Select: tutorial_seizure_fingerprinting/anatomy/pre_T1.nii.gzThe MRI viewer opens automatically. Click on "Click here to compute MNI normalization", option "maff8". This method is embedded in Brainstorm and does not require the installation of SPM12. However, it requires the automatic download of the file SPM12 Tissue Probability Maps. If you do not have access to internet, see the instructions on the Installation page. It is based on an affine co-registration with the MNI ICBM152 template from the SPM software, described in the following article: Ashburner J, Friston KJ, Unified segmentation, NeuroImage 2005..

Click on Save to close the MRI viewer. New node named pre_T1 is created.

While it is not applicable to this data, but while importing some MRIs if there is a transformation available in the NIfTI header, then a window pops up asking Do you would want to apply the transformation to the MRI file ? Choosing Yes will orient the MRI based on this transformation and will reorient the MRI in Brainstorm's standard orientation, so you can see the coronal/sagittal/axial views correctly oriented. More details.
Post-implantation CT
The pre-implantation MRI above will be used as the anatomical reference for this subject. We will now import a second scan done after the SEEG implantation, on which we can see the SEEG contacts. In this dataset, the post-implantation volume is a CT scan (contacts hypersignal appear in white).
Right-click on the subject node > Import CT.
Select: tutorial_seizure_fingerprinting/anatomy/post_CT.nii.gzChoose SPM for coregistration. See the section Volume coregistration for more details on this option.
Choose Yes for reslicing so that the CT voxel dimensions match those of the MRI.

Choose SPM for skull stripping. It uses SPM toolbox's Tissue Segmentation to apply a binary volumetric mask to keep only the brain region in the volume.
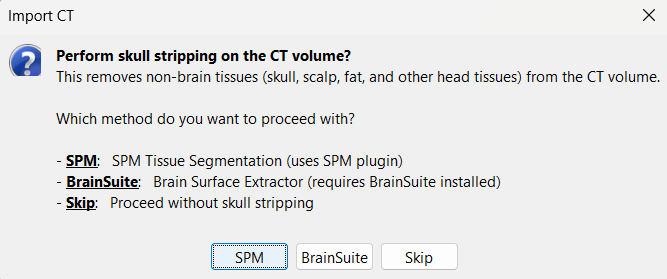
Another way to perform skull stripping is using BrainSuite's Brain Surface Extractor. Installation steps can be found in the BrainSuite for Brainstorm tutorial.
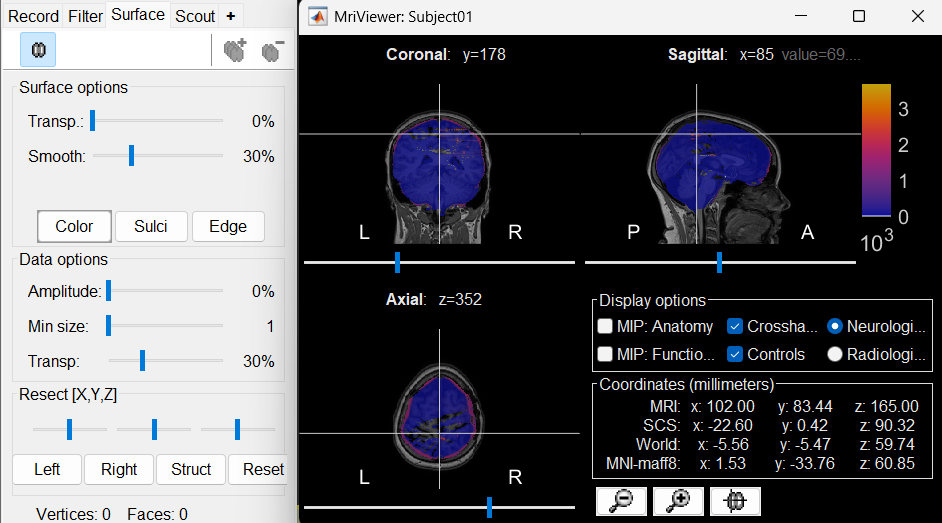
The MRI viewer opens automatically, showing the post-implantation CT volume as a colored layer on top of the previous volume. Adjust the transparency and amplitude threshold of this layer in the section Data options of the Surface tab, adjust its colormap with the popup menu of the figure. Use this display to validate that the coregistration of the two volume is correct, all the parts of the head must align well.
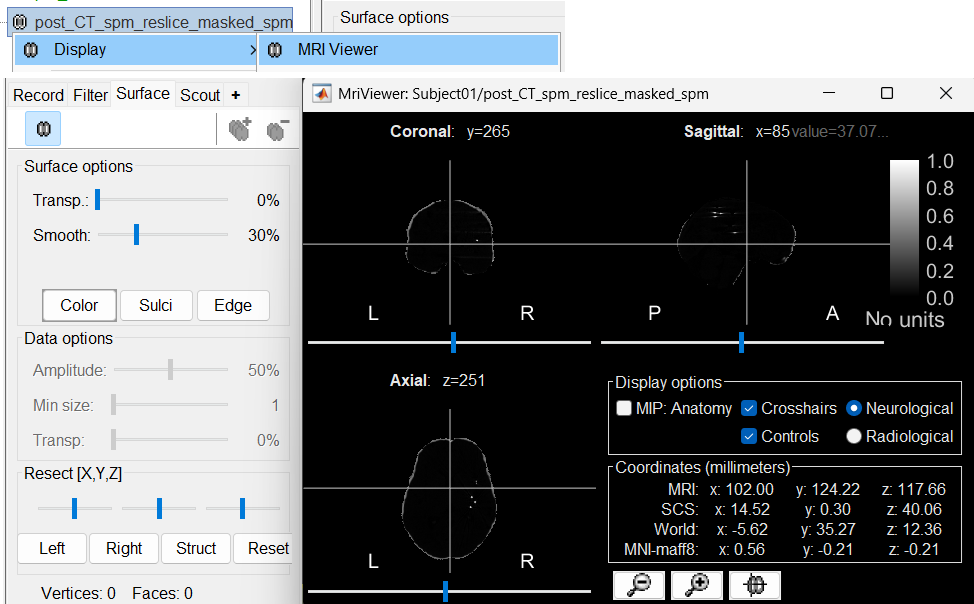
New node named post_CT_spm_reslice_masked_spm is created. The postfix _spm_reslice_masked_spm indicates the different processes it has gone through. To see the history of the processes for this file, right click on post_CT_spm_reslice_masked_spm > File > View file history.

To just view the CT File, right click on post_CT_spm_reslice_masked_spm > Display > MRI Viewer.
Generate default surfaces using CAT12
We recommend generating cortical surfaces with CAT12, especially if you are interested in a realistic representation of the patient's cortical folding in 3D. Follow the CAT12 tutorial to generate the surfaces as under.
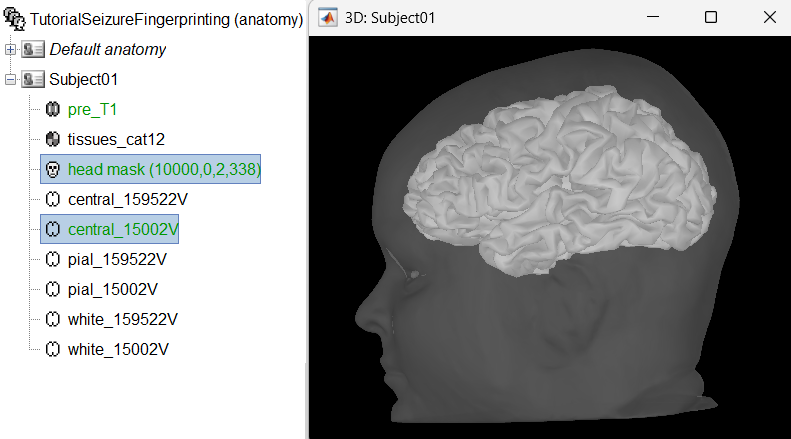
These surfaces will be used later, in the computation of the epileptogenicity maps. Read the section Importing realistic surfaces for information on how to use realistic surfaces from BrainVISA or FreeSurfer.
Segmentation using CAT12 can take around 1 hour depending on your system. To save time, we provide the precomputed CAT12 segmented surfaces generated using the MRI above as part of the tutorial dataset (tutorial_seizure_fingerprinting/cat12). More details on how to import them directly can be found in the CAT12 tutorial.
Electrode labeling and contact localization
If you do not have any recordings in the database, Brainstorm allows to creation and annotation of intracranial electrodes and contacts. Users can also then export these as a text file with all the positions that can be used in Brainstorm or any other program.
Generate isosurface
This creates a thresholded mesh from the CT by separating the contacts out from rest of the CT. This aids the user towards localization of the electrodes and its contacts more accurately.
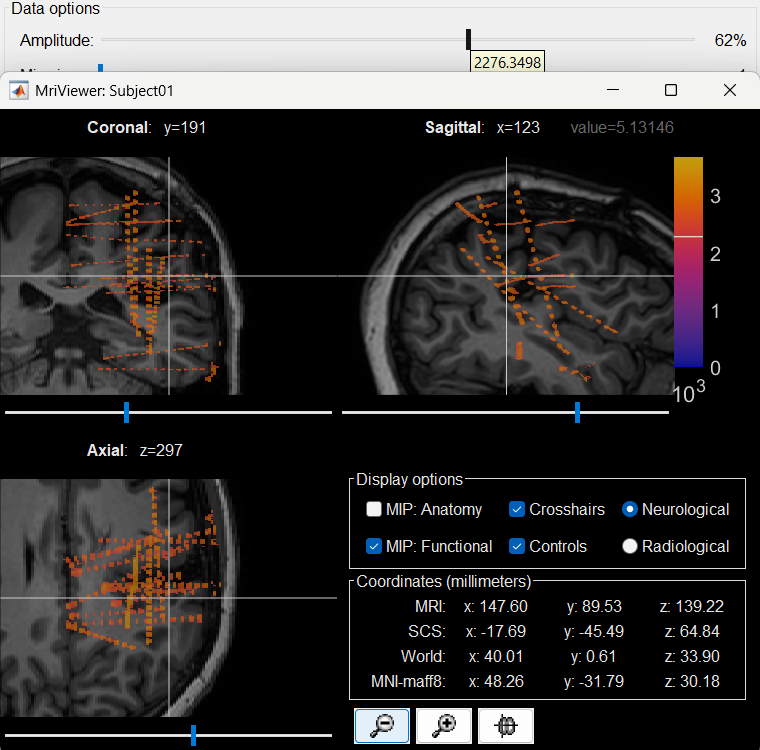
The first thing required is to define a good threshold (which we call isoValue) that will separate out the contacts from the rest of the CT. Just open the CT file (by double clicking on it), click on the MIP: Functional in the MRI Viewer, use the Data Options > Amplitude slider in the Surface tab to browse through the threshold, and once you are satisfied with getting a good separation of the contacts, hover on the slider to get the desired value and keep a note of it (to the nearest integer). In this case the value is 2276.
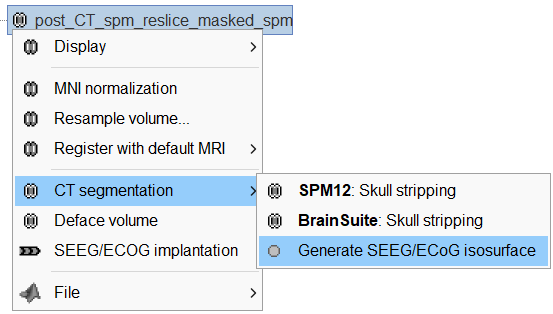
Right click on post_CT_spm_reslice_masked_spm> CT segmentation > Generate SEEG/ECoG isosurface.
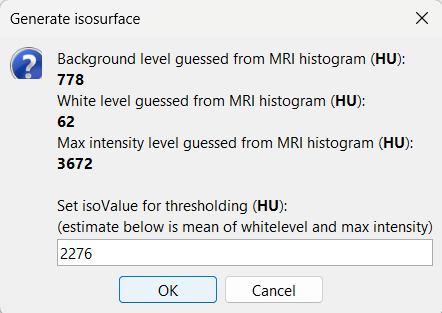
This will bring the Generate isosurface window. This window shows 4 values: the Background level, White level, Max Intensity and the suggested Set isoValue, all of them given in the Hounsfield Unit (HU) scale. The first 3 values are calculated automatically from the histogram of the CT and are displayed for reference. The editable isoValue field shows an estimated best guess based on mean of White Level and Max Intensity. Since we got a better value in step-1 above, set the value to 2276 and press OK.
An isosurface is generated showing the contact as blobs overlayed on the 3D MRI slices. The Thresh slider under Surface options can be further used to fine tune and regenerate mesh with different isoValues.

Start implantation
Right click on Subject01, and choose SEEG/ECOG implantation.
The SEEG/ECOG implantation menu pops to choose which modalities you want to use for doing your implantation with.

MRI: MRI viewer loads up with MRI volume only.
CT: MRI viewer loads up with CT volume only.
MRI+CT: MRI viewer loads up with the CT overlayed on the MRI.
MRI+CT+IsoSurf: MRI viewer loads up with the CT overlayed on the MRI. 3D figure loads up with the isosurface and 3D MRI slices.
Choose MRI+CT+IsoSurf. This takes you to the functional tab. Subject01 > Implantation > SEEG/ECOG (0) channel gets created. All expected figures open up. Panel iEEG loads up in the panel viewer. Move around the 3D slices to get a clear view of the contacts so that they can be clicked on.
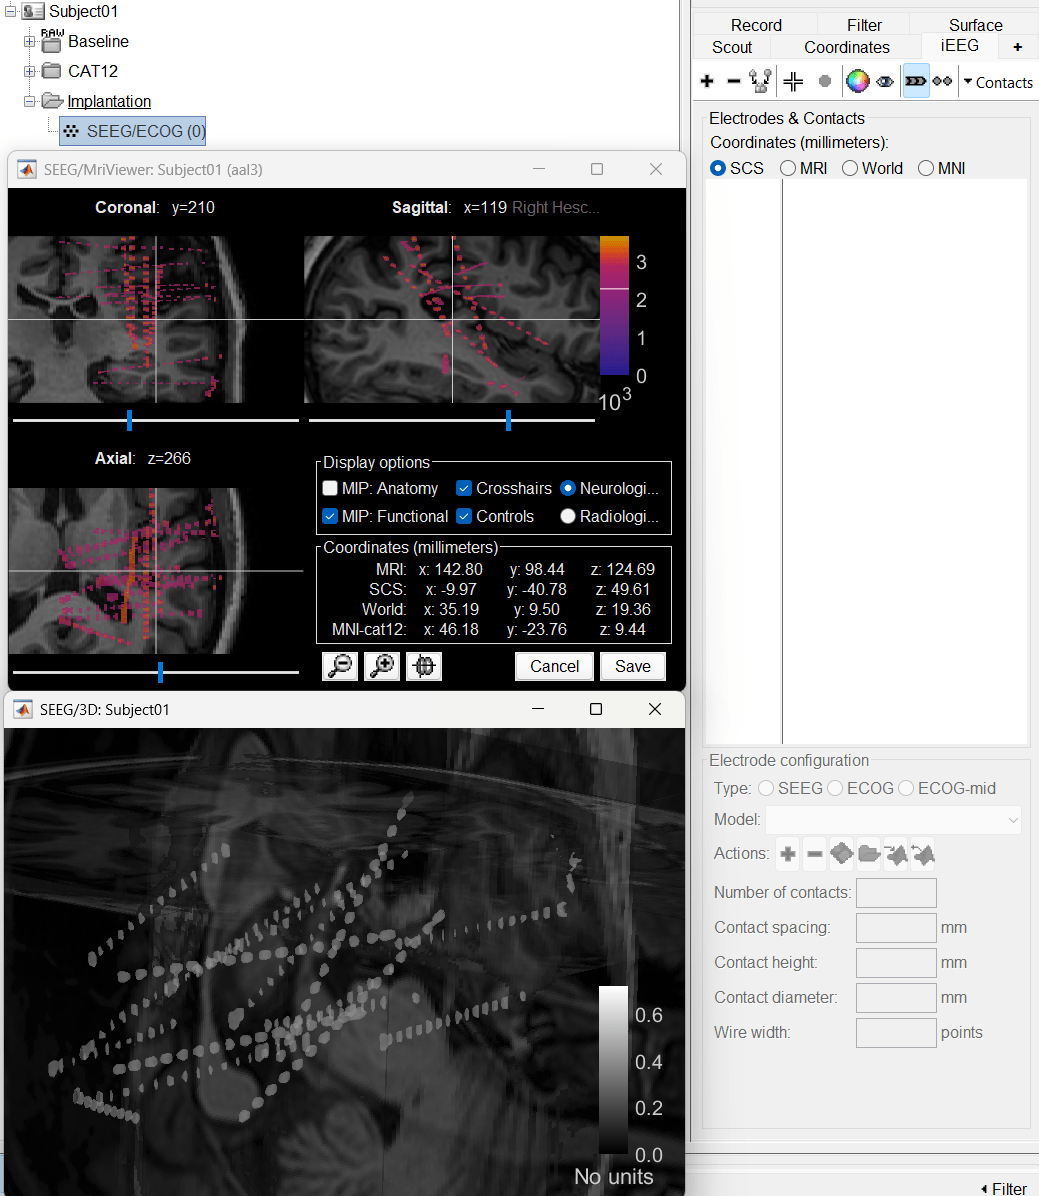
To know more about the panel and its features go to Panel iEEG.
Create electrodes and plot contacts manually
Before we start the implantation a prior knowledge of the implantation scheme is required in order to have the correct labels of the various electrodes used. One way here is to have a look at the recordings file and get a knowledge of that. Brainstorm matches the channel names to that of the recordings while importing the positions to them.
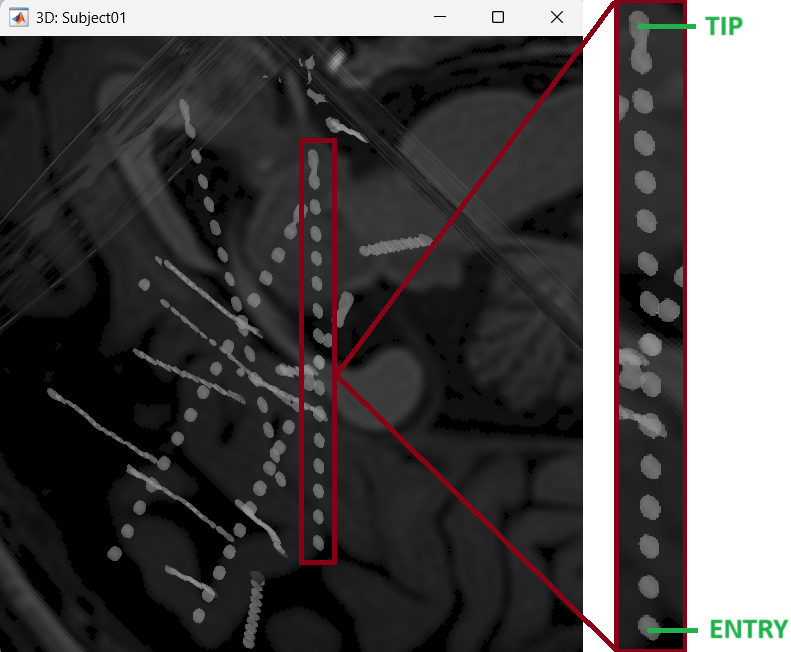
After performing steps above, we will have the Panel iEEG along with the MRI Viewer and 3D figure open. We will be working on the electrode marked below.
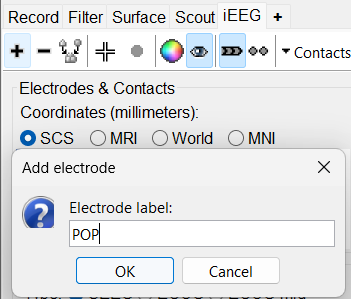
On Panel iEEG Click on the + (Add new electrode). This opens up the Add electrode window. For this e.g. enter POP (it is one of the electrodes in the recordings available in this tutorial data) and press OK.
This creates an electrode POP in selected state, and at the bottom the Electrode configuration section of the panel becomes active. Select the following:
Type: SEEG
Model: Choose PMT 2102-16-093/2102-16-103 from the drop down list. This will automatically set the other parameters in the section. More details for these parameters can be found in the advanced section here.
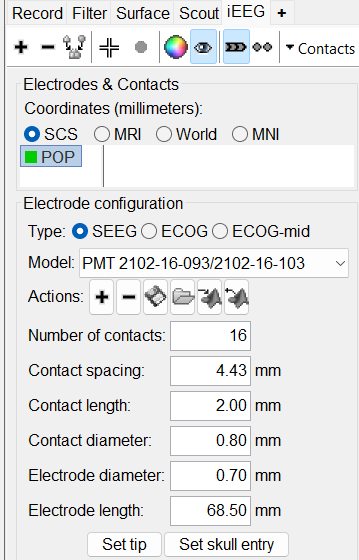
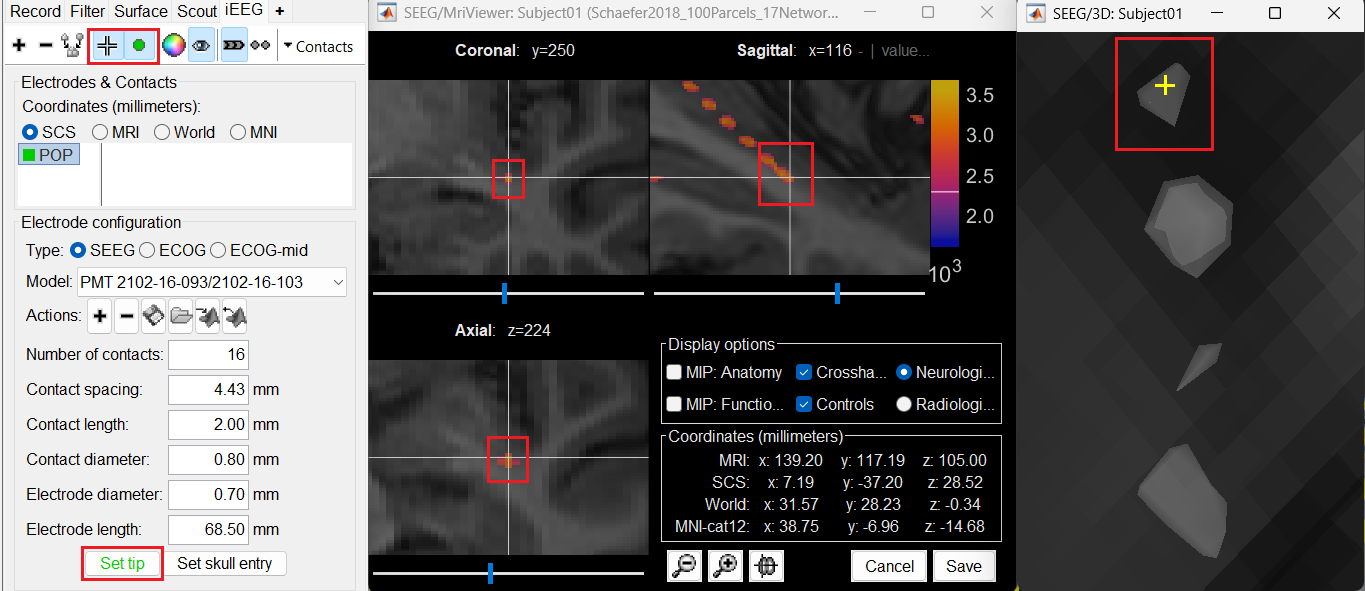
Set tip: Choose the location of the electrode's contact that is deepest in the brain. While we can use the MRI Viewer to set this location (as mentioned here), but to get a more accurate location we will leverage the 3D isosurface as described below.
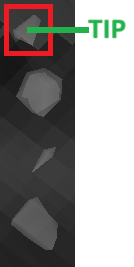
As seen in the first figure in this section, the tip contact blob is not well separated form its adjacent contact. As mentioned in the Generate isosurface section, switch to Surface tab, use the Thresh slider to adjust the isovalue to approximately 3100 and a readjusted isosurface will be generated that separates out the tip area contacts.
Switch back to the iEEG tab, click the
 button (shortcut: Ctrl+P) to activate surface point selection mode.
 Click on the
 button to activate selecting centroid of the candidate contact blob in the isosurface.
 Choose the tip contact in the readjusted 3D isosurface and this should plot a yellow crosshair marker point on the center of the blob and also update the MRI Viewer's crosshair. At the bottom in click Set tip and the button turns green indicating that the tip has been set. This point in 3D is at the centroid of the blob which gives a more accurate location of the contact compared to the same if chosen from the MRI.
Set skull entry: Choose the point in the 3D isosurface which is going to be set as the skull entry. This point can be any of the contacts other than the tip preferably closer to the skull so that we get an orientation of the electrode.
This should plot a yellow crosshair marker point on the blob and also update the MRI Viewer's crosshair.
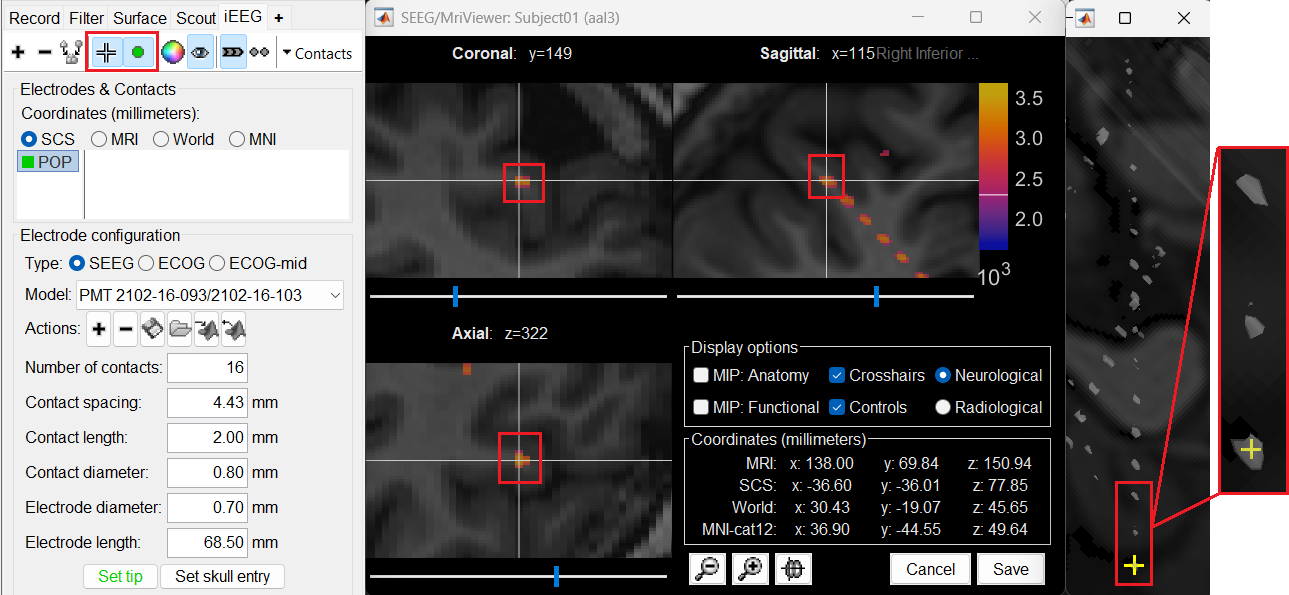
At the bottom of iEEG tab, click Set skull entry and the button turns green indicating that the entry point has been set. All the figures get updated with the an electrode based on the above configuration. The properties used for setting the position of the contacts are the contact spacing, the tip of the electrode and the entry point in the skull. Contact #i is placed along the electrode at (i-1)*contact_spacing millimeters from the tip of the electrode.
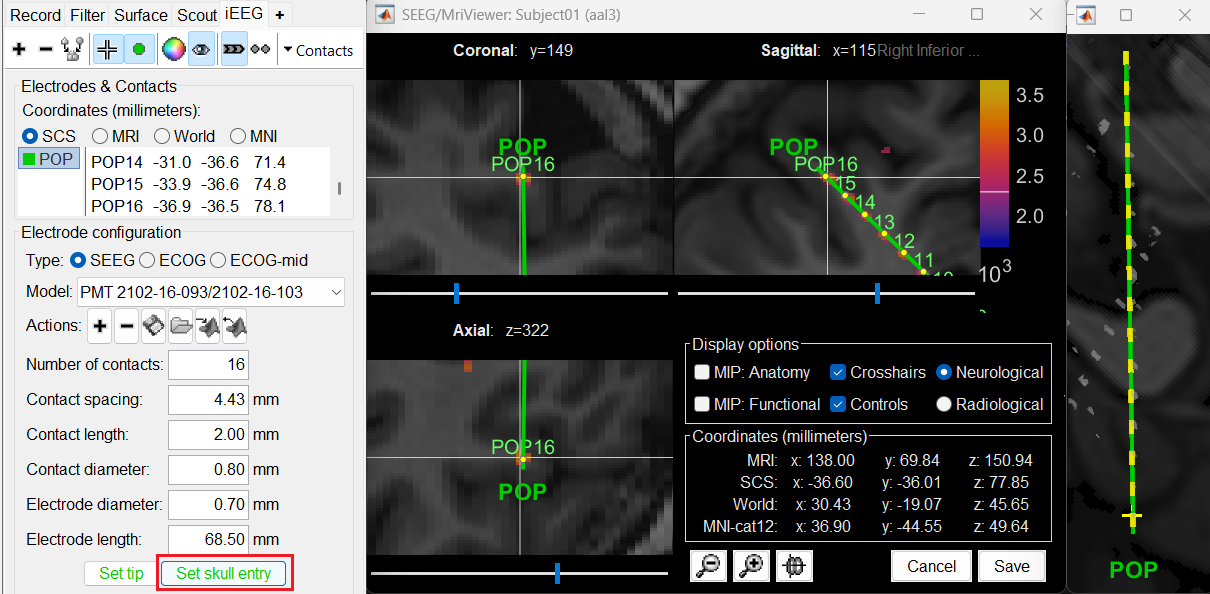
Click on Contacts > Save Modifications to update the channel information in the database.

Repeat the steps for creating implantations for all the other electrodes one by one and save the modifications. Each time you can see the channel file SEEG/ECOG being updated.
When you are done with everything, close all the figures and a prompt appears asking to save the changes. Just click Yes for everything. If all localized properly, the Implantation folder should now have channel file that defines the locations of all the 230 contacts.
To make this tutorial easier to reproduce and follow, we also distribute the positions of the contacts (that were localized using the steps above) exported as a .tsv file: tutorial_seizure_fingerprinting/Subject01_electrodes_mm.tsv. You can directly import them into the Implantation folder:
Right click on Implantation > Import channel file, choose type as EEG: BIDS electrodes.tsv, subject space mm (*.tsv), browse and select the .tsv file, click Open
Set the scaling factor as 1 (the positions in this .tsv file are in millimeters, the expected unit for this file format is also millimeters, there is no adjustment to make here)
Set the import reference MRI as post_CT_spm_reslice_masked_spm (as the implantation was done on it) and press OK.
Select Yes to replace the existing channel file and all the 230 contacts are updated in the channel. We will use this to link to the recordings in the section below.

In some cases, additional correction of the contacts may be required. To edit the individual contacts refer to the Edit the contacts positions advanced section.
Access the recordings
Link the recordings
- Switch to the "functional data" view (2nd button, on top of the database explorer).
Right-click on the subject folder > Review raw file:
Select the file format: EEG: EDF/EDF+
Select all the recordings: tutorial_seizure_fingerprinting/recordings/*.edf

The selected recordings get added to the database.
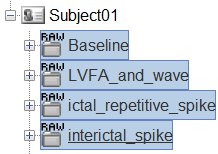
The new files Link to raw file let you access directly the contents of the original SEEG files. The menu Review raw file does not actually copy any data to the database. More details.
Import the contacts positions
In order to generate epileptogenicity maps, we need accurate 3D positions for the contacts of the depth electrodes. Placing the contacts requires a good understanding of the implantation scheme reported by the neurosurgeon, and some skills in reading MRI scans.
- The channel file "EDF channels" contain the name of the channels, but not their positions. We need to import or edit separately the positions of the SEEG contacts.
Click on the [+] next to the four folders, select all the channel files simultaneously.
Right-click one channel file > Add EEG positions > From other studies > Implantation
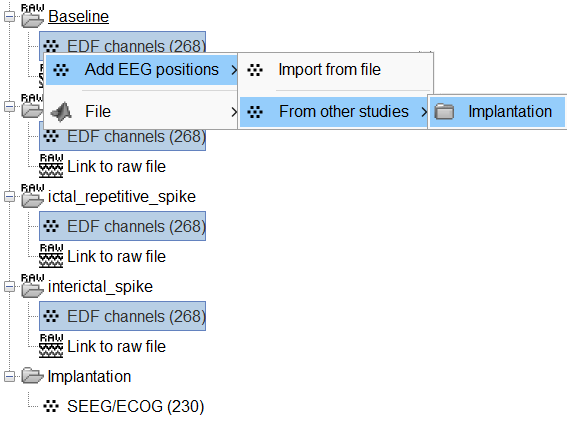
At the end, you get a report indicating how many channels from the SEEG recordings were attributed a new 3D position. The channels are matched by name: the position file you import must include the labels of the channels and they must be named exactly in the the same way as in your recordings.
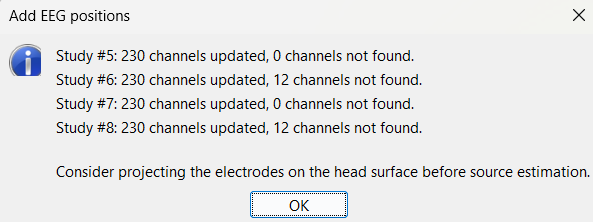
For EDF Channels under LVFA_and_wave and interictal_spike, there were 12 channels not found. The type of the channels for which a position was not found is set to EEG_NO_LOC, in order to ignore them when processing the SEEG data. In this example dataset, the channels numbered 245 to 255 and 262 are not found as they are not SEEG contacts.
For all the EDF Channels, mark the channel MPS16 as SEEG_NO_LOC because if not marked, when we compute the forward head model using BEM surfaces it says that MPS16 lies outside the BEM layer. Marking it excludes it from any future computations.
You should always validate that the type of all the channels has been detected correctly. Check also that the names are correct and using the same convention for all the contact of a given electrode. These are entered manually, and typing errors are frequent. Right-click on a channel file > Edit channel file.

To edit one channel, double-click on the text to modify. To edit multiple channels, select them all and right-click > Set channel group/type. The column Group corresponds to the name of the depth electrode. It is detected based on the channel type and name. If you include as SEEG a channel that detected as something else or rename a channel, you would need to manually update the channel name.
If you don't have the positions for the SEEG contacts, or if they don't look correctly aligned, see the section Edit the contacts positions on how to tackle it.
To make this tutorial easier to reproduce and follow, we also distribute the positions of the contacts (that were localized as per the section above) exported as a .tsv file (tutorial_seizure_fingerprinting/Subject01_electrodes_mm.tsv). To import the contacts position from that refer to Epileptogenicity tutorial.
Display the depth electrodes
3D figures
Right-click on the channel file > Display sensors and explore all the available options.
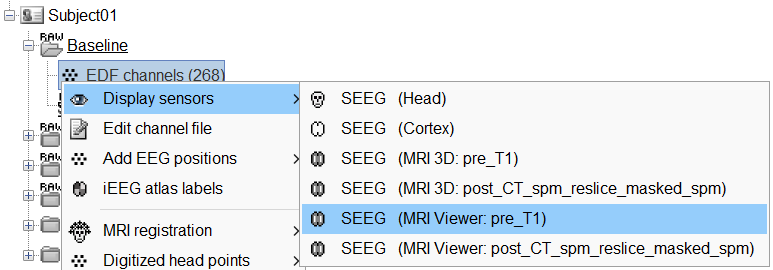
You can render the SEEG depth electrodes in 3D together with the subject anatomy: surfaces, pre- or post-implantation volumes. You can add more anatomy elements to the figure with the button Add a surface (
 ) at the top-right of the Surface tab. For more help: Display the anatomy.
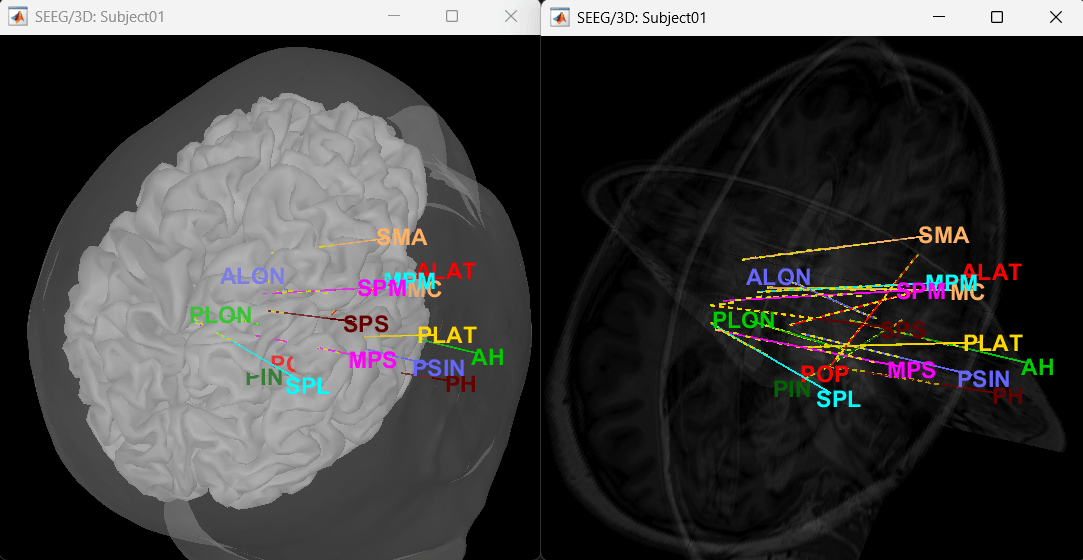
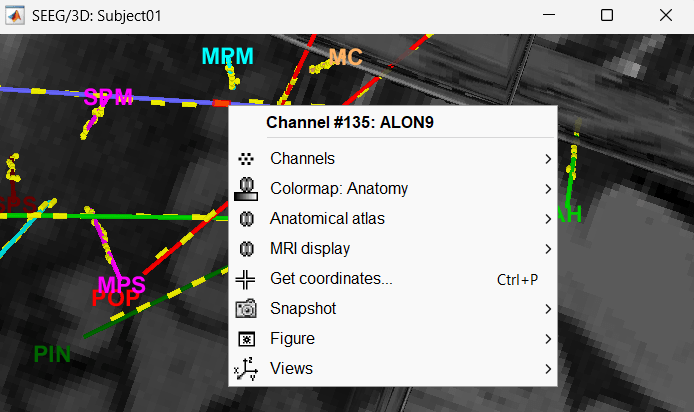
Click on a contact to select it, right-click on it to get its name.
MRI Viewer
You can also display the contacts in the MRI viewer, on top of the the pre- or post-implantation volumes. By default, the electrode is displayed in a slice if there is a SEEG contact associated to it in the slice.
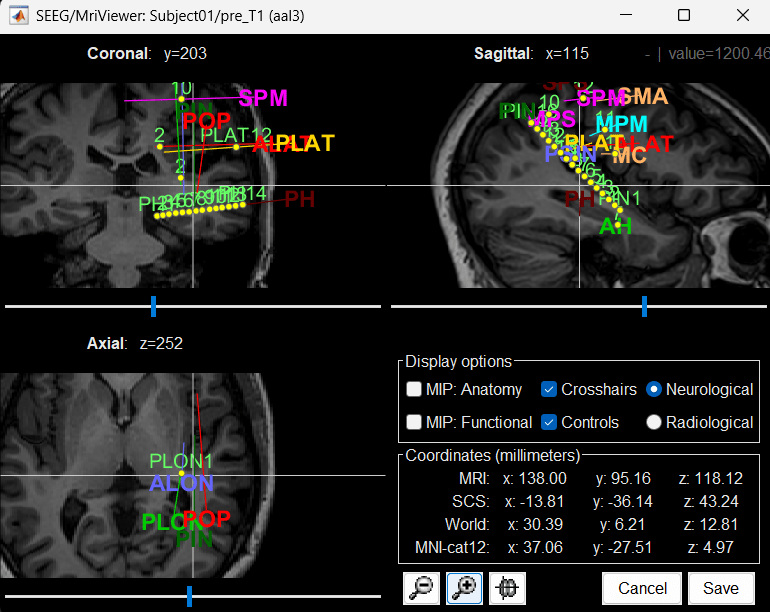
To display all the electrodes, select the option "MIP: Functional". For a glass-brain view, select at the same time the option "MIP: Anatomy".
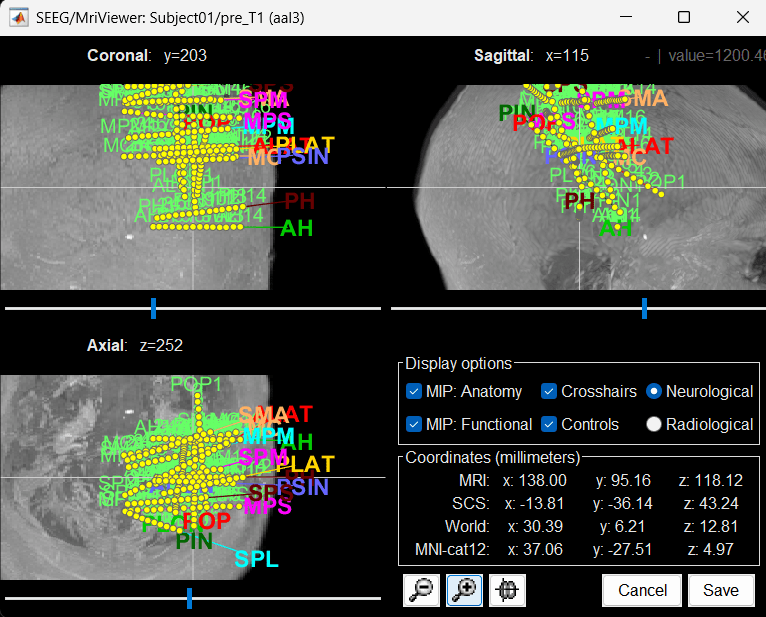
Zoom in/out with the buttons or the associated shortcuts (Ctrl+Scroll or +/-) and explore the volume with (Shift+)x/y/z. Additional display options are available in the popup menu for this figure. All the shortcuts are listed in this tutorial.
Panel iEEG
When opening SEEG/ECOG recordings, the panel iEEG is added to the Brainstorm window. You can use it to edit the display properties of the depth electrodes. More details about the iEEG Panel can be found in the Epileptogenicity tutorial.
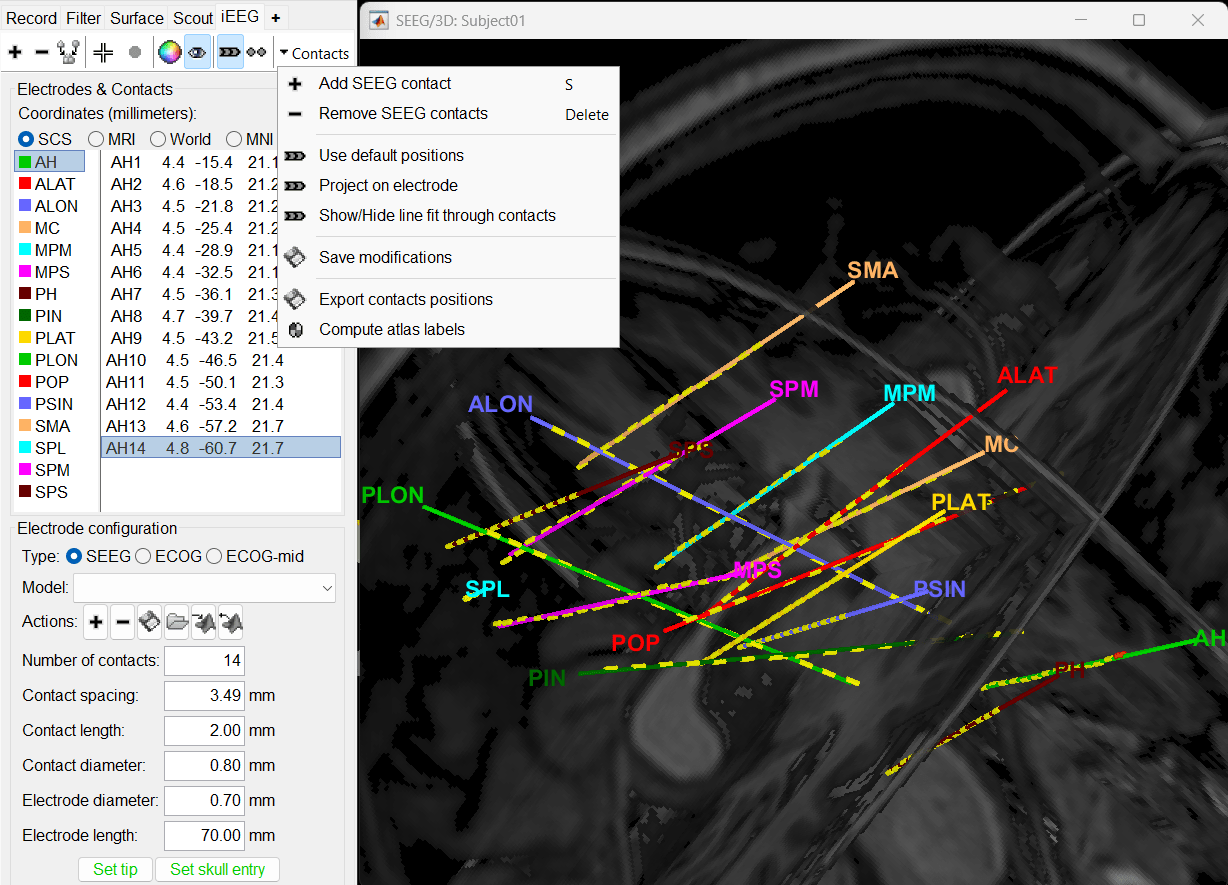
To know more about ways to display the SEEG recordings in Brainstorm refer to the Epileptogenicity tutorial.
Review recordings
Power spectrum
We recommend that you start your data analysis with a power spectral density estimation of the recordings to check the quality of sensor recording. This is described in more details in the Power spectrum tutorial.
In Process1, select all the continuous files (Link to raw files or folders).
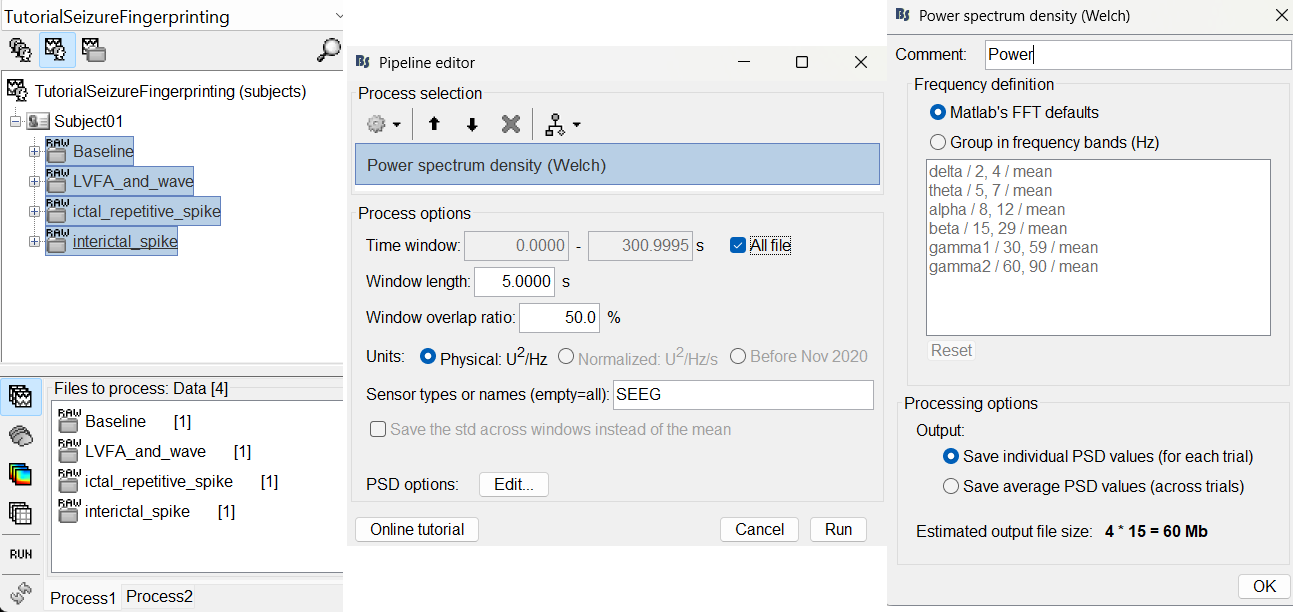
- Double-click on the PSD files to display them. Some channels have noise levels that are obviously higher than the others and should therefore be considered as suspicious.
In the Baseline PSD, peaks related with the power lines: 60Hz, 180Hz, 300Hz, 420Hz, 540Hz, 660Hz, 780Hz and 900Hz can be seen below.
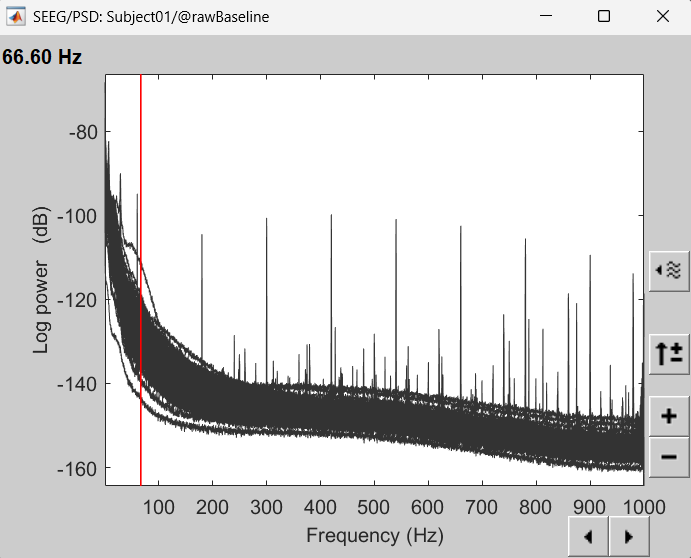
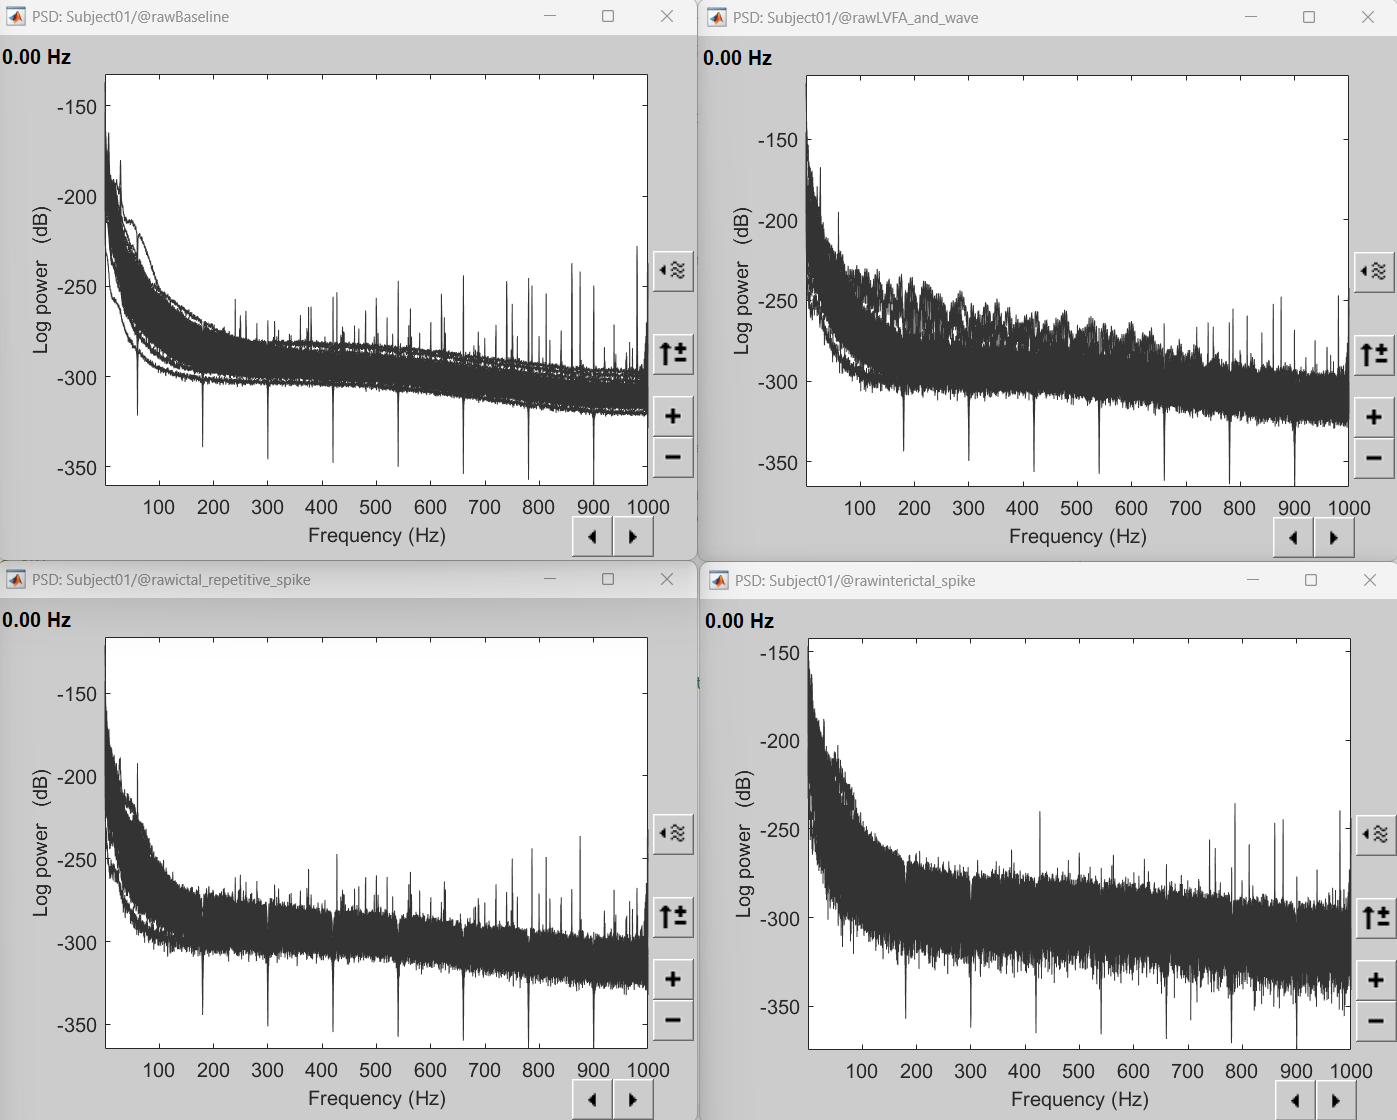
Applying the notch filter process can be used to remove these frequencies. The interictal spike, ictal repetitive spike and LVFA and wave are subsets of the Baseline recordings which have all the 60Hz+harmonics removed and it can clearly be seen from their respective PSDs in the figure below.
Add events
We need to mark seizure onset event for the ictal and LVFA and wave recordings and spike event for interictal recording. There are events already available in recordings, that were marked for clinical use, to jump quickly to the page of interest. More details can be found in the tutorial Event Markers.
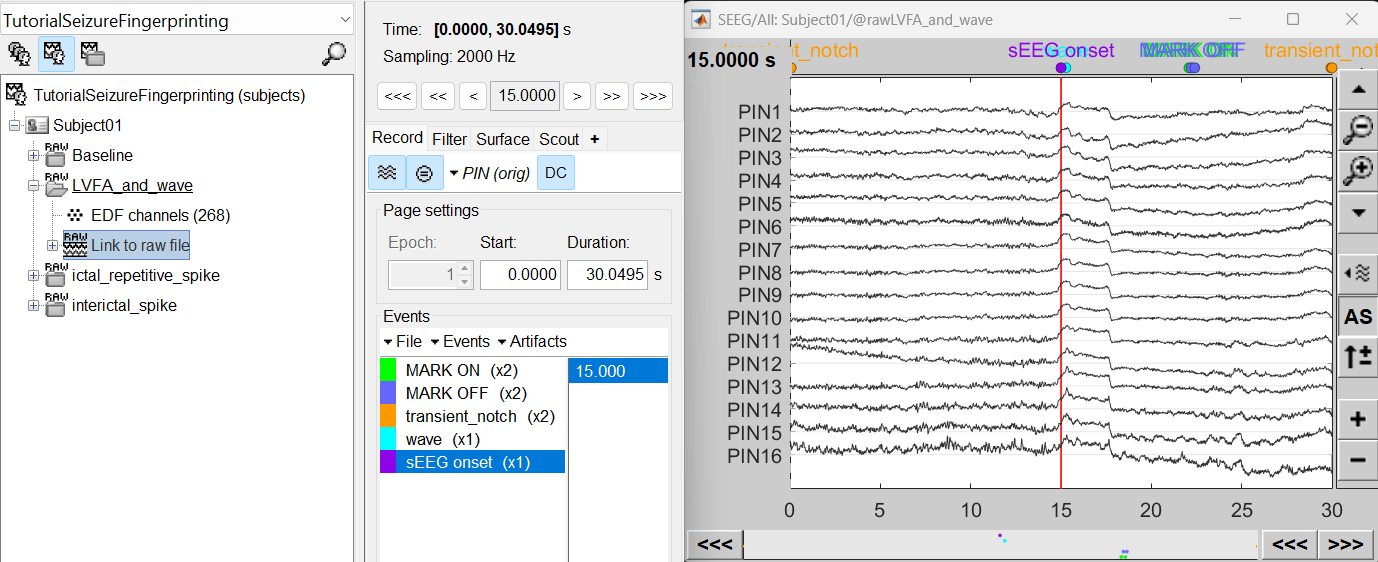
For LVFA and wave, we will create a new event sEEG Onset at around 15s (center of the 30s recording extract).
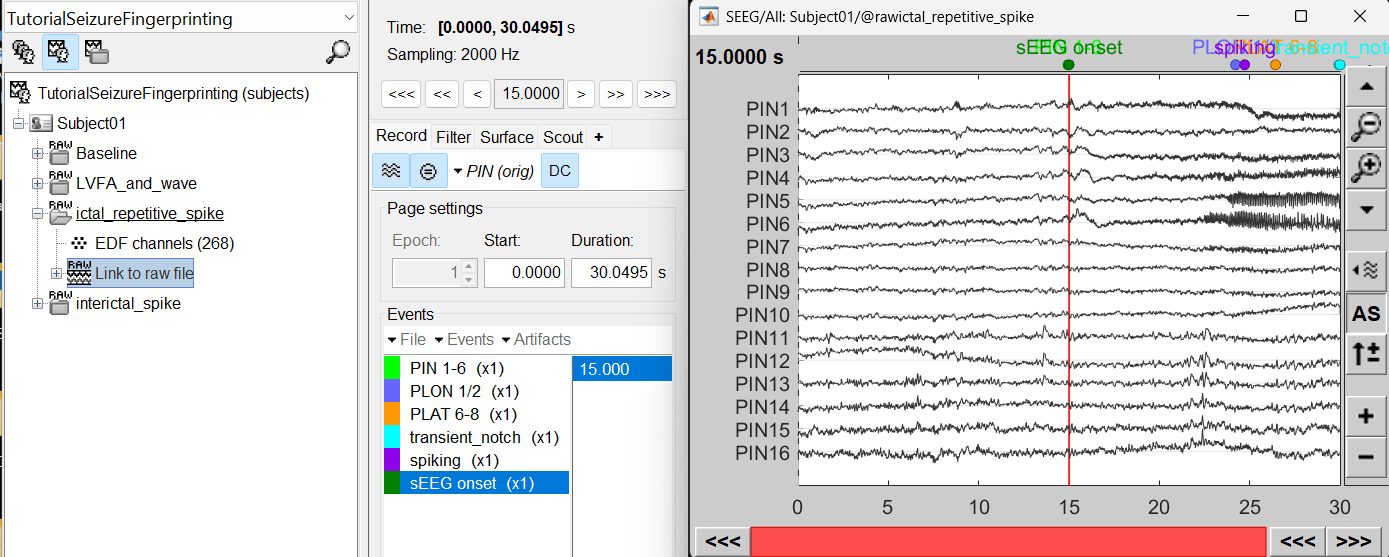
For ictal repetitive spike, we will create a new event sEEG Onset at around 15s (center of the 30s recording extract).
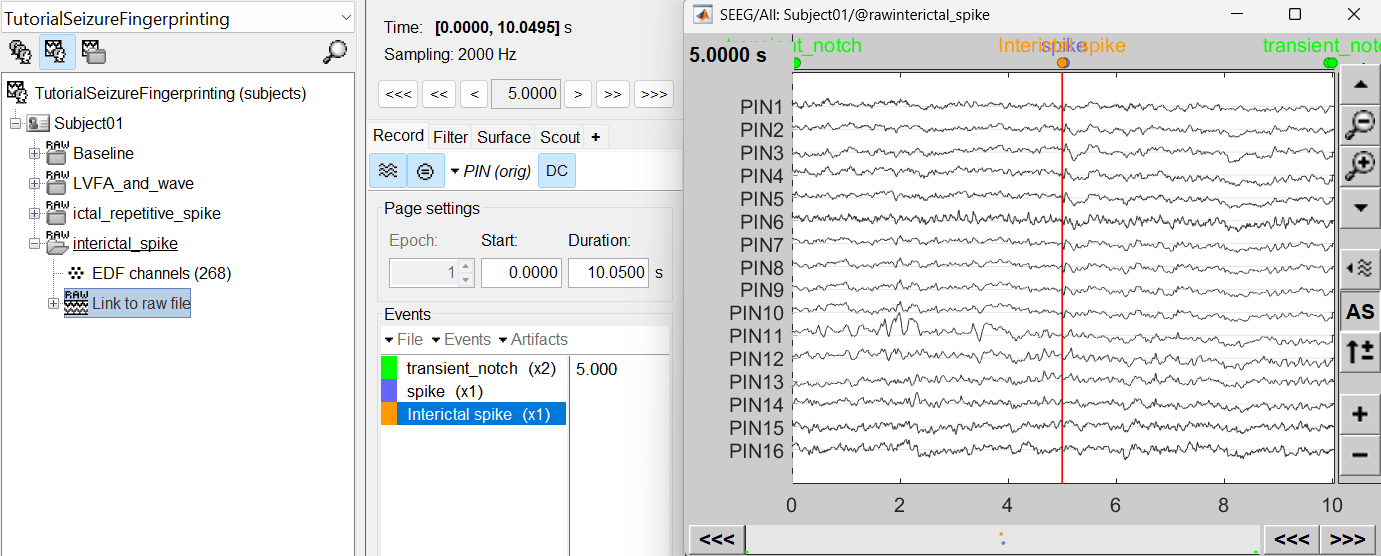
For interictal spike, we will create a new event Interictal spike at around 5s (center of the 10s recording extract).
Import epochs of interest
At this point of the analysis, we are still looking at the original files, no SEEG data was copied to the database. The montages are saved in the Brainstorm preferences, the new events are saved in the links of the database.
We are now going to import the three segment of recordings i.e. LVFA and wave , ictal repetitive spike and interictal spike which are a subset of the Baseline recording.
Import in database
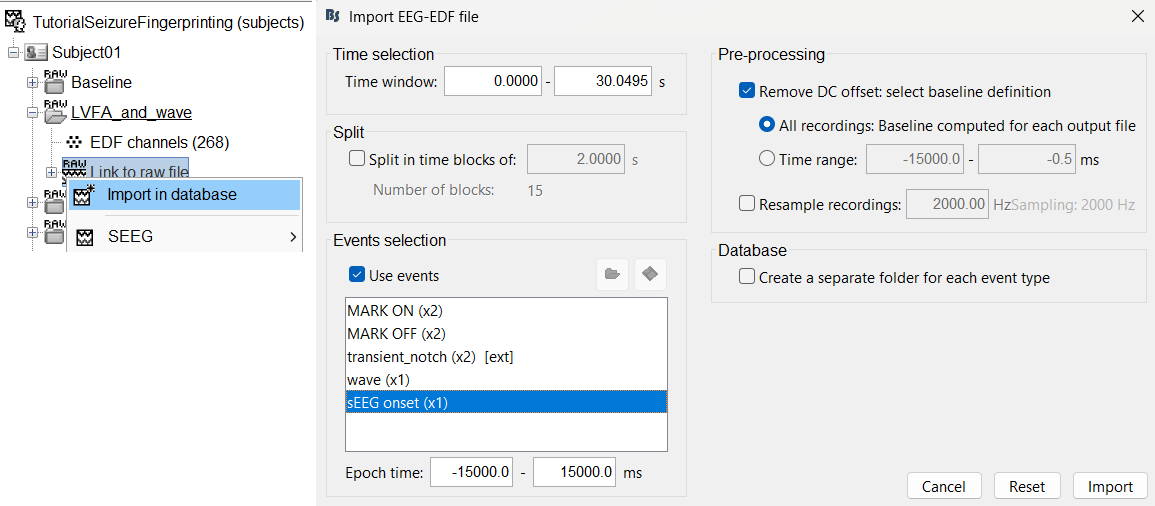
Right click on LVFA_and_wave > Link to raw file > Import in database.
- Time window: All (0 to 30.0495)
- Split in time blocks: Disabled
Use events: Enabled, select sEEG Onset
Epoch time: [-15000, +15000] ms (imports -15s to 15s around the event sEEG Onset)
Remove DC offset: Enabled. More details can be found here.
- Resample: Disabled
- Create a separate folder for each event type: Disabled
Click Import.
Repeat the same steps above for importing ictal repetitive spike into the database.
Repeat the same steps above for importing interictal spike into the database with the modification in the following options:
- Time window: All (0 to 10.0495)
Use events: Enabled, select Interictal spike
Epoch time: [-5000, +5000] ms (imports -5s to 5s around the event Interictal spike)
At the end, you should have three new folders LVFA and wave , ictal repetitive spike and interictal spike, the same name as the original raw files, but without the tag RAW on top. These new folders contain copies of the SEEG recordings, if you delete these folders from the database explorer, you lose the recordings they contain.
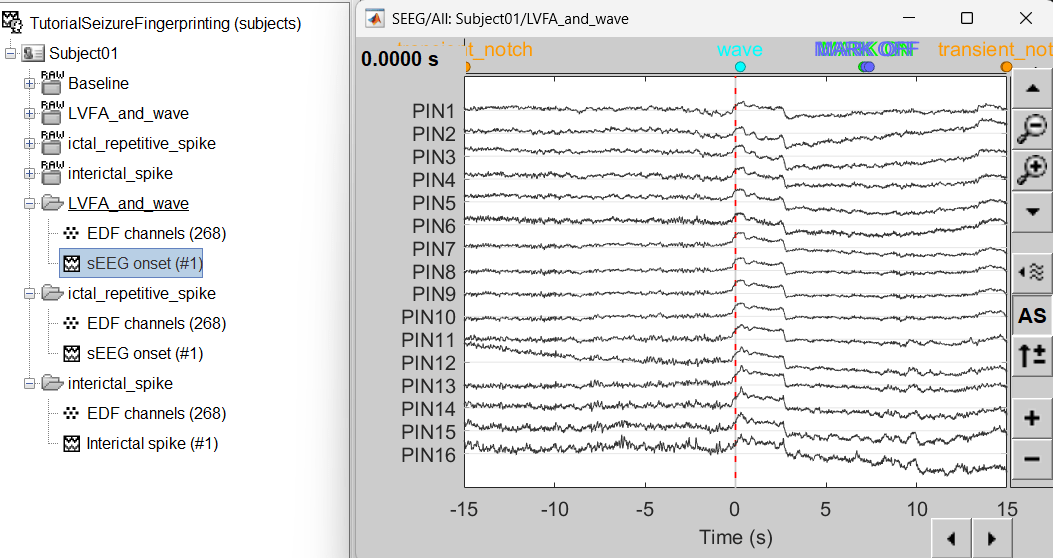
The imported epochs are saved with a new timing: for LVFA and wave and ictal repetitive spike, the reference time t=0s is now the event sEEG Onset and for Interictal spike, the reference time t=0s is now the event Interictal spike, which has been removed from the list. You can still see the other marker timings adjusted accordingly.
Bipolar montage
We will run the rest of the analysis using a bipolar montage (bipolar-2). The montage selected in the Record tab is for visualization only, most processes ignore this selection and work only on the original common-referential montage. To compute bipolar montage on time series, we need to explicitly apply the montage to the recordings. More details can be found in tutorials Montage editor and Epileptogenicity.
In Process1, drag and drop all the imported recordings (either the folders or the files).
Run the process Standardize > Apply montage
Montage name: Subject01: SEEG (bipolar 2)[tmp]
Create new folders: Enabled
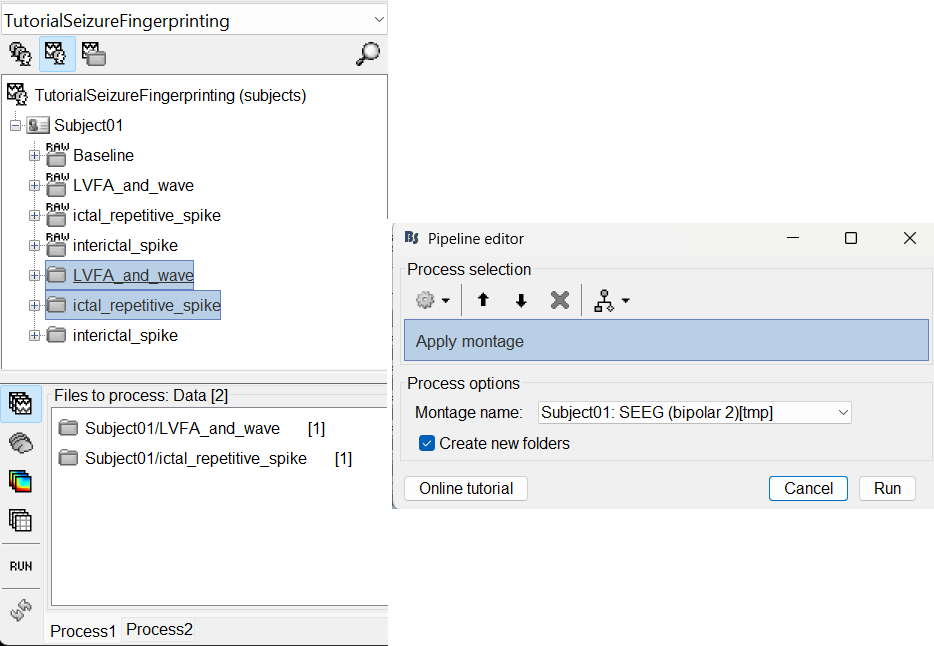
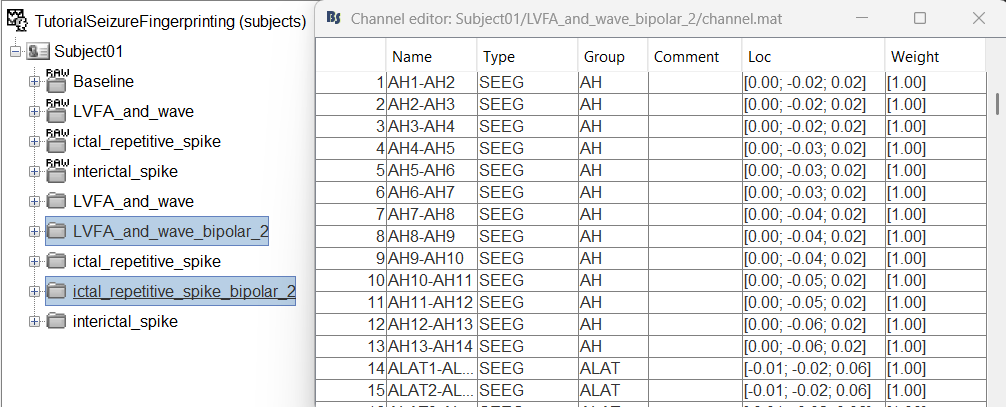
This process rewrites the channel files and data files in the selected folders. The position associated with a bipolar channel in the channel file is the middle of the segment between the two contacts (e.g. AH1-AH2 is placed half-way between AH1 and AH2).
Head modeling
The forward models depend on the subject's anatomy, including head size and geometry, tissue conductivity, the computational method, and sensor characteristics. In this section, we will use the Boundary Element Method (BEM) approach available in Brainstorm for constructing the head model for sEEG.
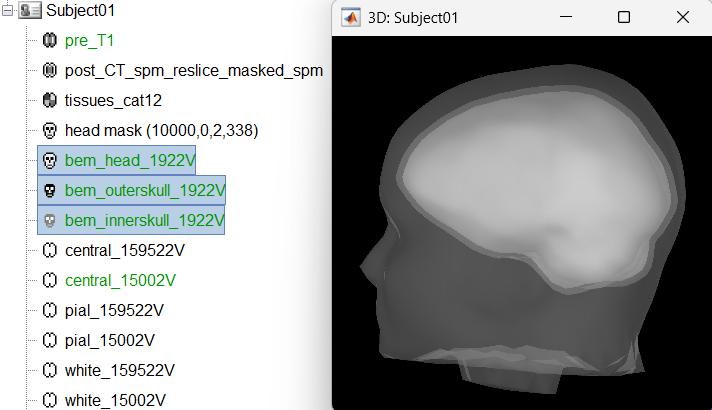
We will first generate the BEM head surfaces from the MRI. More details can be found in OpenMEEG BEM tutorial. This will generate three surfaces head, outer skull and inner skull estimated from the head mask and the cortex obtained from the segmentation. The BEM surfaces will be used for the BEM forward computation below.
We will then compute the forward head model using the OpenMEEG BEM method. Switch to functional tab, right-click on the interictal_spike > EDF channels > Compute head model.
Source space: Cortex surface
Forward modelling methods: SEEG: OpenMEEG BEM
Use only Brain in BEM layers and conductivities (corresponds to bem_innerskull surface) as other surfaces do not matter for SEEG.
Use default OpenMEEG options.
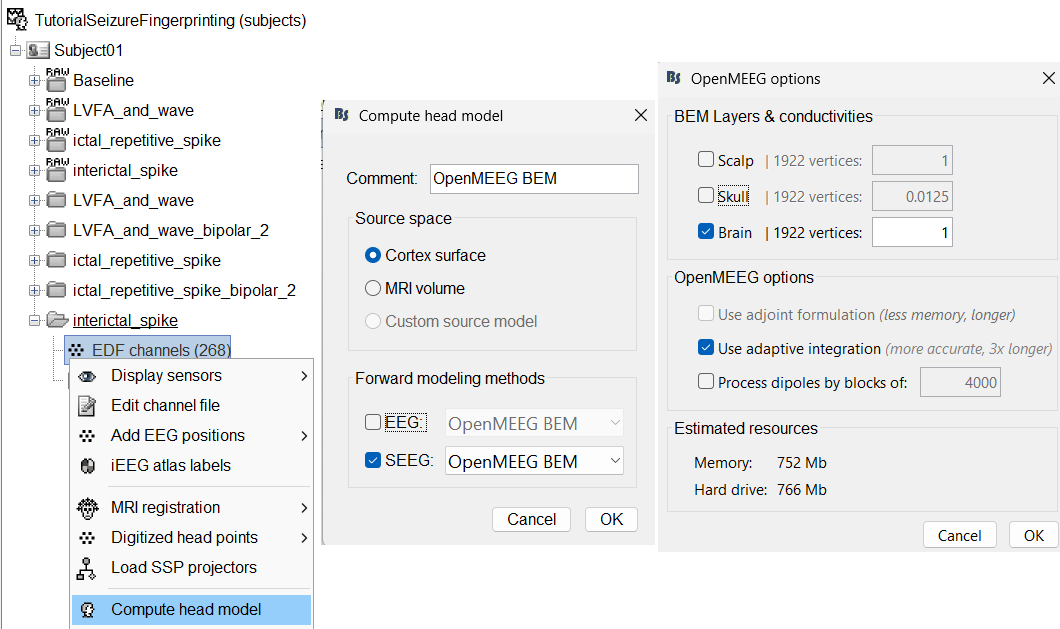
A new head model will be added to the folder.
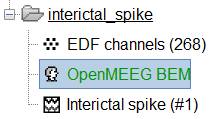
Right click on the head model file > Copy to other folders. Since the other folders contain data collected from the same subject using the same set of electrodes, we do not need to recompute the head model for each of them separately.
View leadfield vectors:
Right click on the head model file > View SEEG leadfield vectors
Select reference MC2 and click OK
Click on the figure and press E to display the electrodes
Make sure scouts are unselected (Scout tab > ALL and SEL unselected)
Surface tab: transparency = 90 and press Shift+Up arrow till the arrows are visible. Press Up/down to change the Reference electrode, Right/Left to change the target. Close all figures once done.
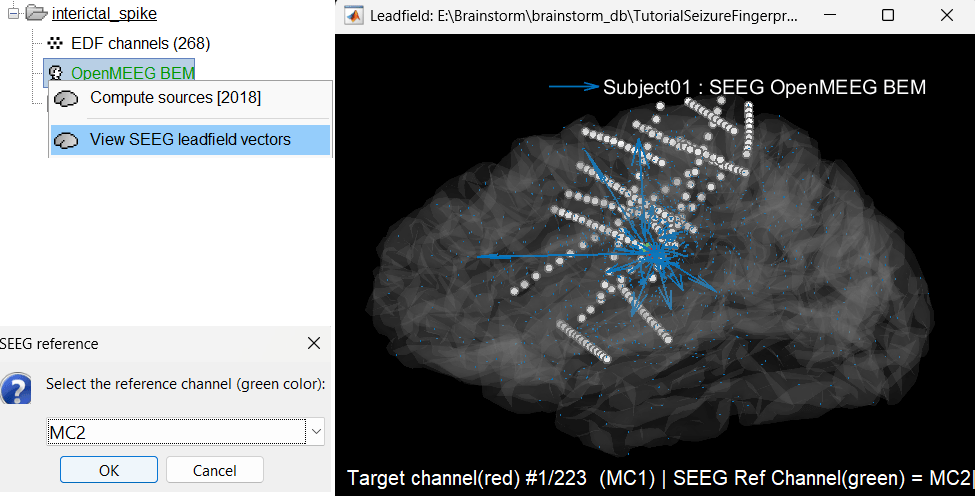
Compute noise covariance matrix
We will compute the noise covariance matrix for the Baseline recording as per the tutorial Noise covariance.
Right click on the Baseline (RAW) > Link to raw file > Noise covariance > Compute from recordings . Keep the default values and click OK.
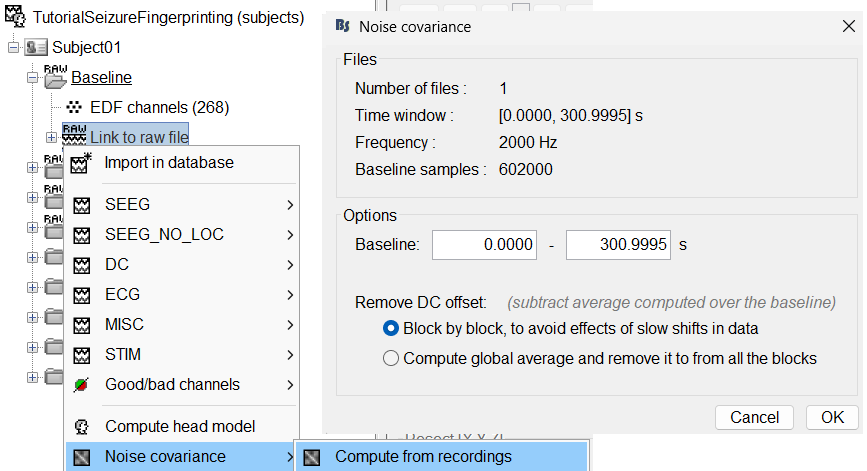
Noise covariance node gets added to the database.
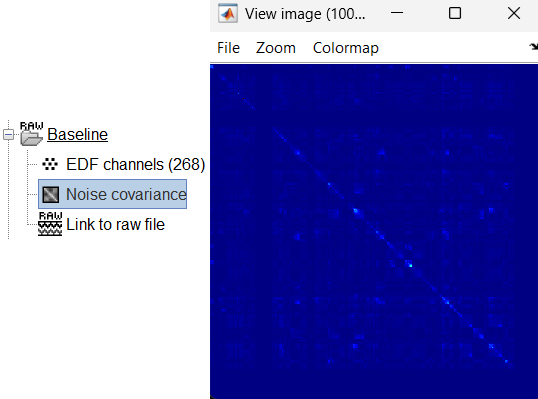
Right click on the Noise covariance and Copy to other folders.
Modeling interictal spikes
Compute inverse model
We will compute the inverse model for the interictal_spike recording. For more details refer to the tutorials Source estimation and Volume source estimation.
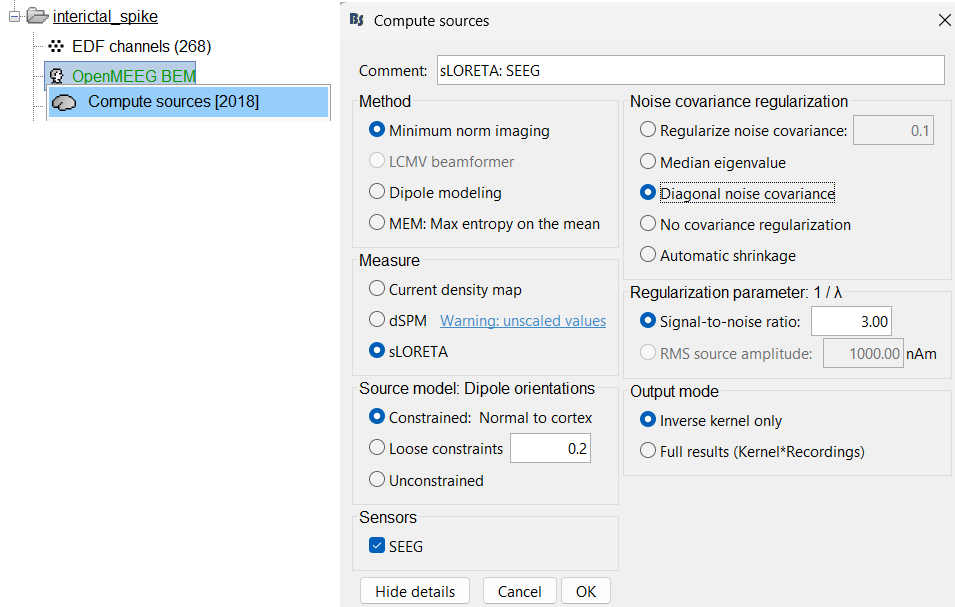
Expand the interictal_spike folder, right click on OpenMEEG BEM > Compute sources [2018].
Method: Minimum norm imaging
Measure: sLORETA
Source model: Dipole orientations: Constrained: Normal to cortex
Noise covariance regularization: Diagonal noise covariance
Regularization parameter: Signal-to-noise ratio: 3.00
- Output mode: Inverse kernel only
Sensors: SEEG. Click OK.
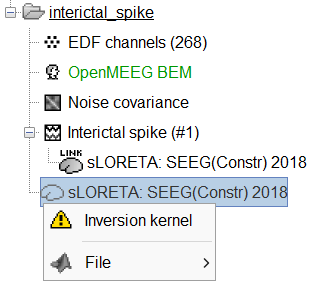
Two files get added to database. To learn about inversion kernel and LINK files in database refer to this section.
Display sensor time series
Display time series
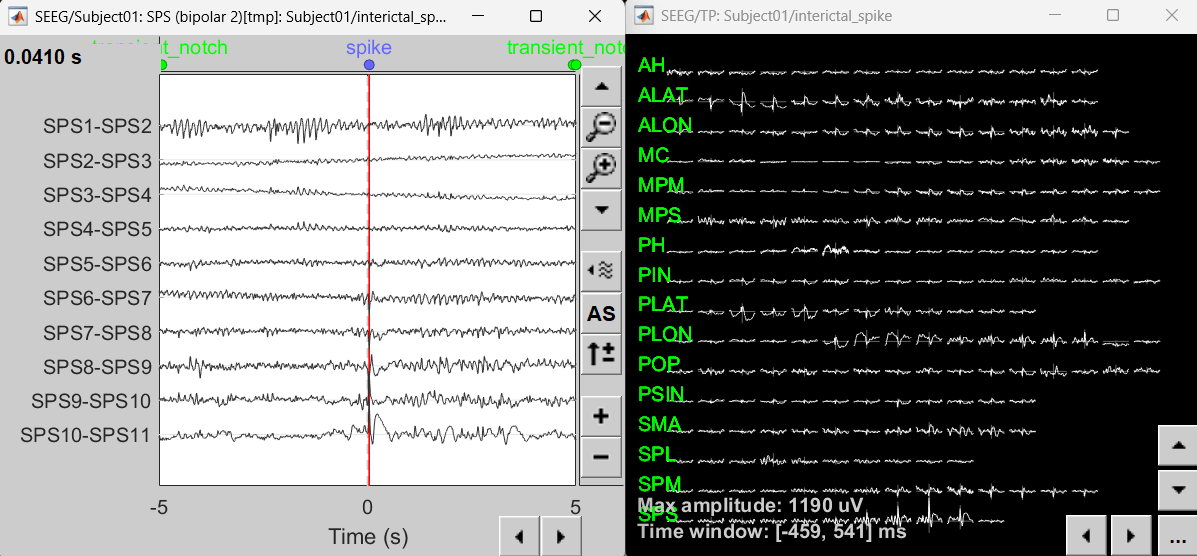
Right-click on recording Interictal spike > SEEG > Display time series
On the Record tab, select montage SPS (bipolar 2)
Select the first peak of SPS10-SPS11 (Time 0.041s).
Display 2D layout of the spike
Right-click on recording Interictal spike > SEEG > 2D Layout
Click [...] on the corner and set[-500, 500] as the time window. Doing this will enable visualizing 1s of data across all the sensors giving a more clear sense of where the different spikes are.
View sources
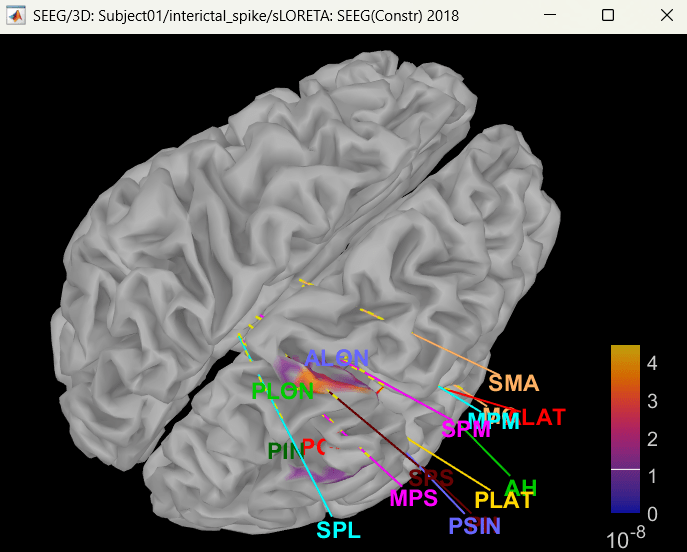
Display on cortex
Right click on sLORETA (LINK) > Cortical activations > Display on cortex
Show sensors: Ctrl+L (electrodes)
Set colormap: Colorbar > Colormap:Sources > Permanent menu, select Maximum: Global, Contrast -0, Brightness 0
Switch to Surface tab: Amplitude 26%, Min size 13
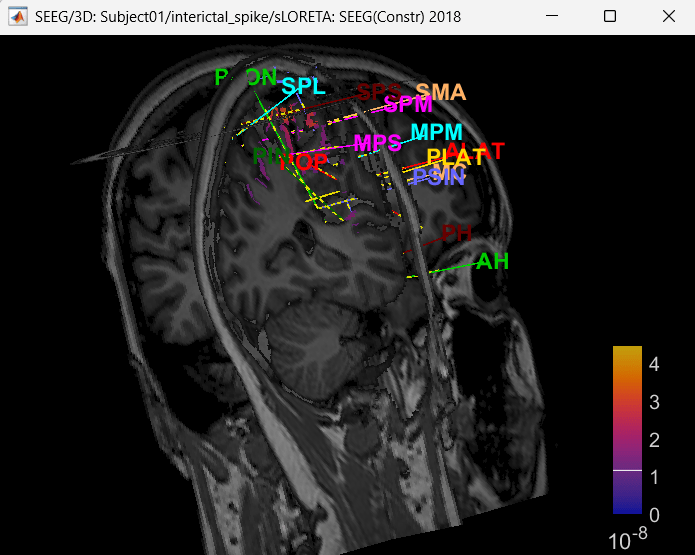
Display on 3D MRI viewer
Right click on sLORETA (LINK) > Cortical activations > Display on MRI (3D)
Show sensors: Ctrl+L (electrodes)
Press M to go to voxel with maximum intensity
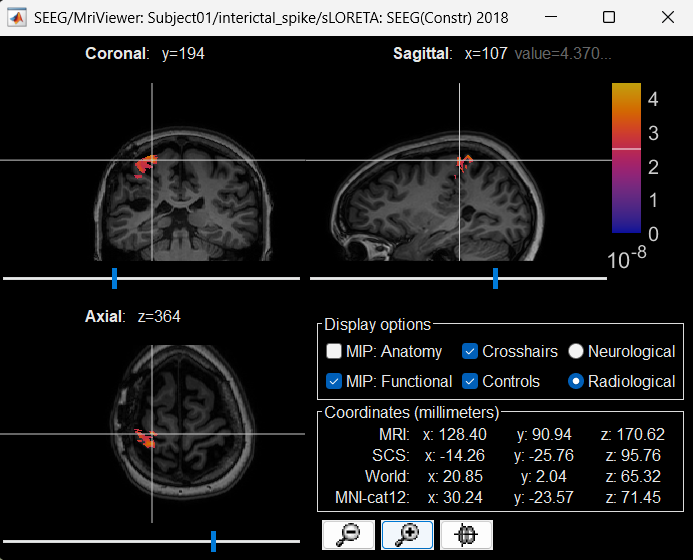
Display on MRI viewer
Right click on sLORETA (LINK) > Cortical activations > Display on MRI (MRI Viewer)
Turn on MIP: Functional
Switch to Surface tab, Amplitude: 56%, and press M to select voxel with maximum intensity
Atlases and scouts
- Display sources on the cortical surface
Right click on sLORETA (LINK) > Cortical activations > Display on Cortex
In the Scout tab, use the drop box to select Desikan-Killiany and click on ALL. This atlas is provided by default in Brainstorm. Ctrl+L to show all electrodes.
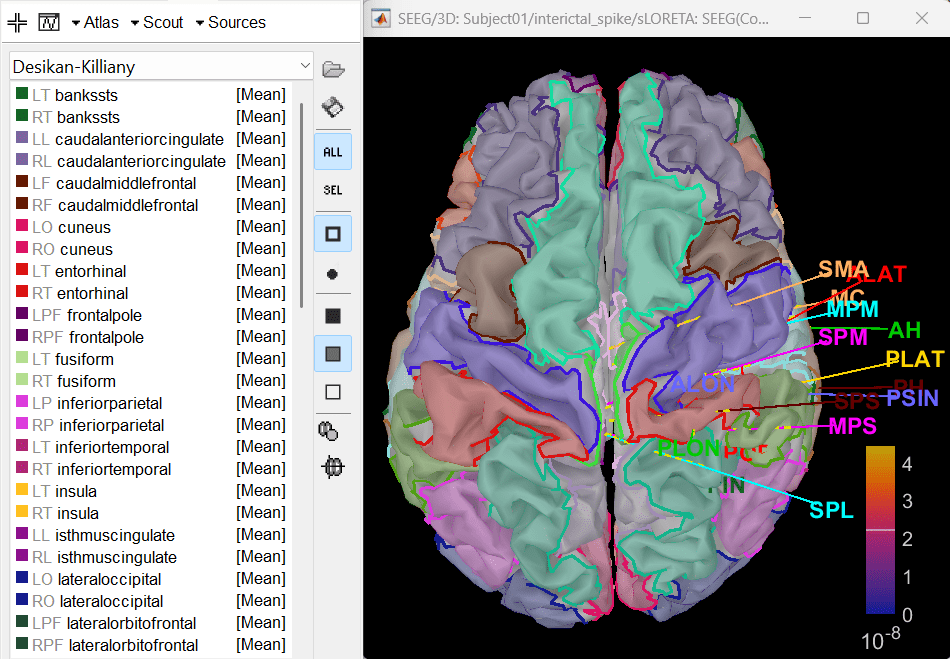
- Since all the electrodes in the data are implanted on the right hemisphere of the brain, it is better to edit this atlas to only have scouts defined for the right region and remove the rest. Also we can subdivide the atlas to smaller scout regions to have smaller ROIs that will help in having better and more focused time-frequency epileptogenic maps later in the tutorial.
In Scout tab, Atlas > Subdivide atals > Area > Area of the sub-regions: 5. It will create a new atlas named Desikan-Killiany [361].
Delete all the scouts whose name starts with L. A total of 182 scouts will remain that pertain only to the right hemisphere.
To know more about scouts in Brainstorm refer to the tutorial Scouts.
Modeling ictal wave
Switch to the folder LVFA_and_wave (not the RAW folder) and repeat the steps to compute inverse model as per the section above and study the sensor time series and inverse modeling results.
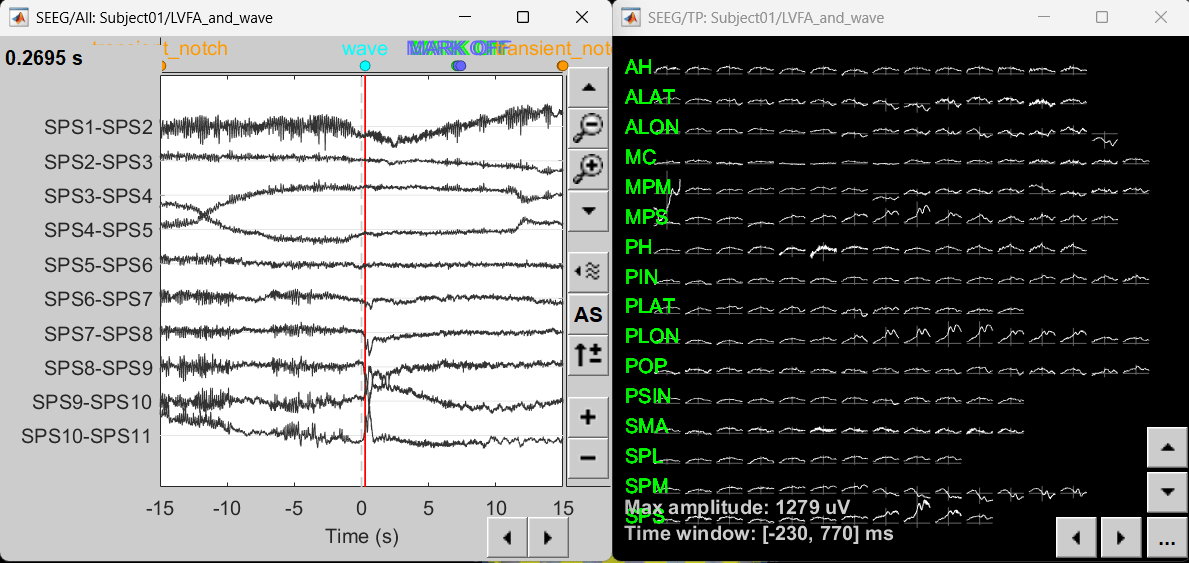

Modeling ictal onset with LVFA
Sensor space
Compute time-frequency decomposition
Navigate and expand LVFA_and_wave_bipolar_2 folder
Delete any previous recordings in the Process 1 tab below
Drag-and-drop recording file sEEG onset (#1) | bipolar 2 in Process 1, click [RUN]
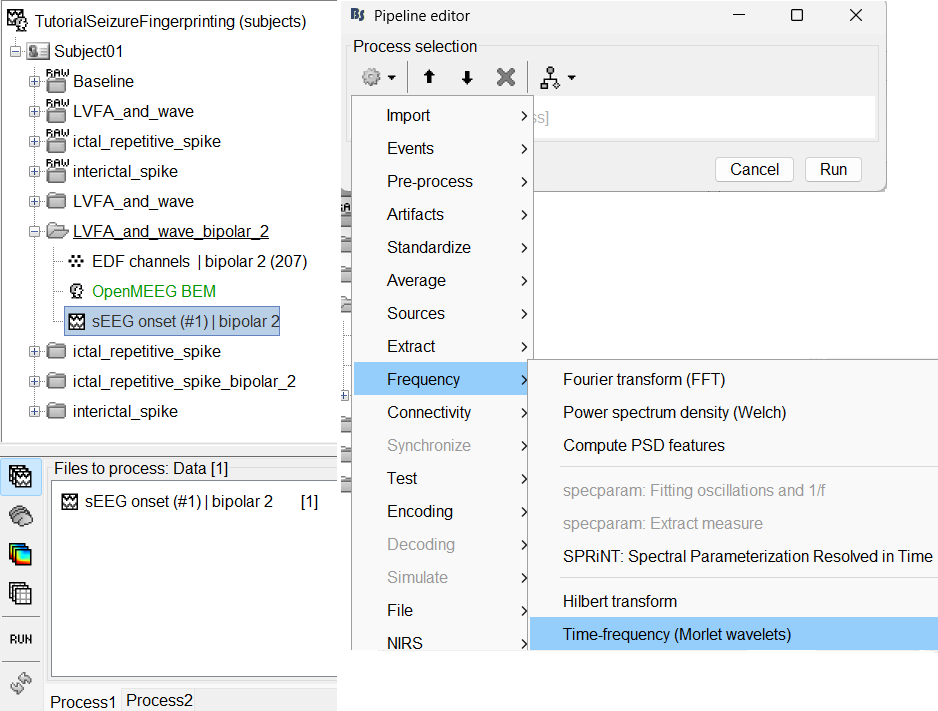
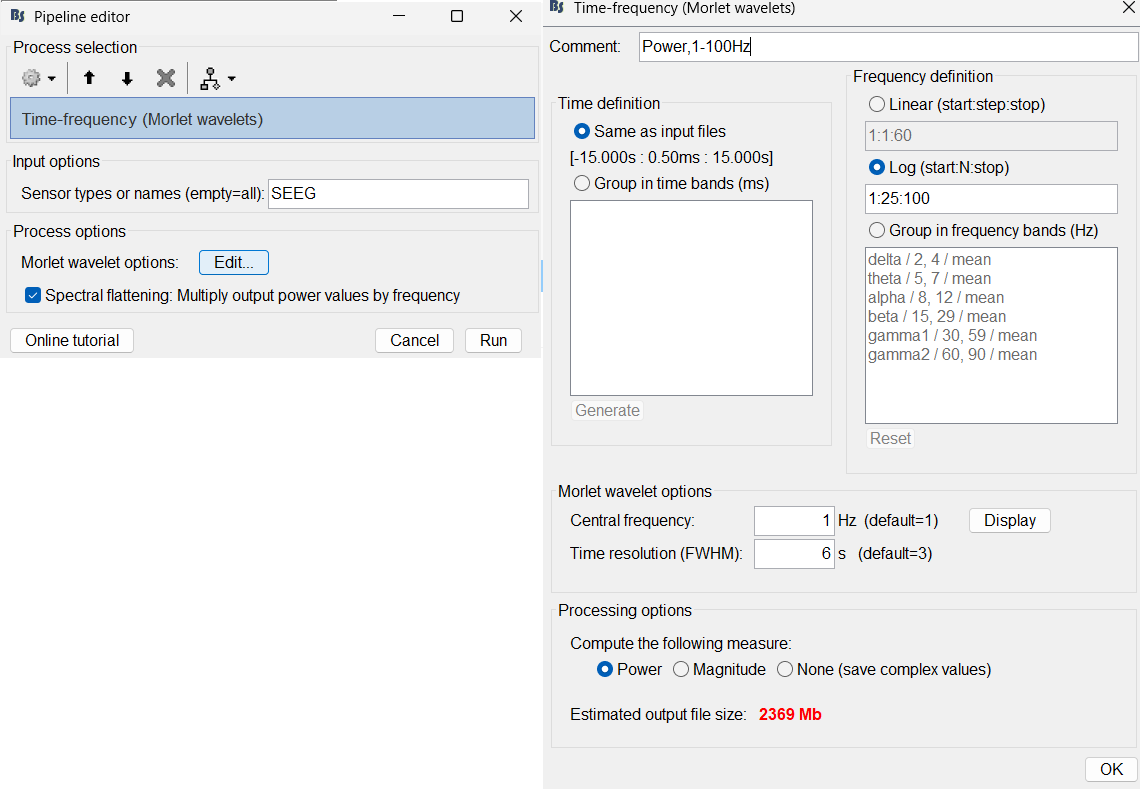
Add the process: Frequency > Time-frequency (Morlet wavelets)
Sensor type: SEEG
Select Spectral flattening: Multiply output power values by frequency
Click Edit...
Frequency definition: Log (start:N:stop), 1:25:100
Central Frequency: 1 Hz, Time resolution (FWHM): 6s. Click OK and Run.
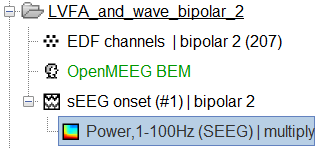
A new node Power,1-100Hz (SEEG) | multiply gets added to the database.
For more details go through the tutorial Time-frequency.
View time-frequency maps
Right click sEEG onset (#1) | bipolar 2 > Power,1-100Hz (SEEG) | multiply > All channels
Click on Log(Power) to bring out the essential features in the maps.
Click on Smooth display to apply a Gaussian kernel to the map so that the underlying pattern becomes clearer for viewing.
Click on SPS8-SPS9
Set colormap: right-click on Colorbar > Colormap: Timefreq > Permanent menu, Turn-off [Absolute Value](if on), Maximum: Local, Contrast 49 Brightness -65
Right-click on the colored time-frequency plot > Power Spectrum, Time Series
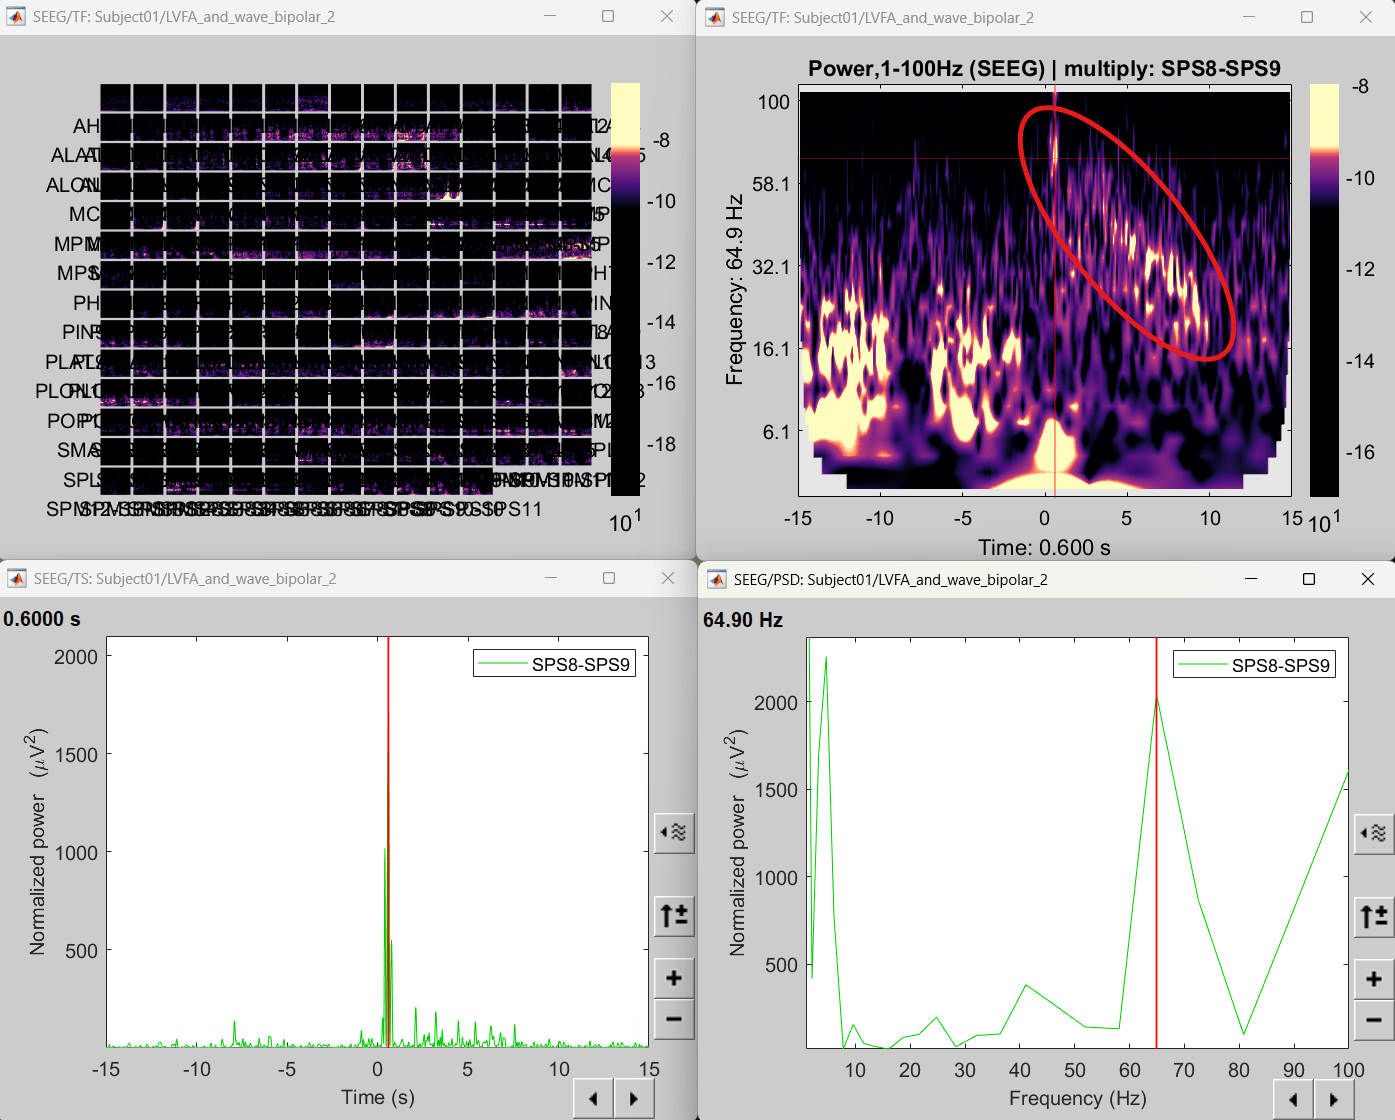
- The red marked area above is the high frequency activity. The bottom right area contains the pre-ictal spikes that is signature of seizure fingerprinting.
Source space
Extract scout time series
- We are going to now extract a single time-series for each of these scouts that best defines it.
Switch to the folder LVFA_and_wave (not the RAW folder).
Drag-and-drop sLORETA: SEEG(Constr) 2018 (LINK) in Process 1, click [RUN]
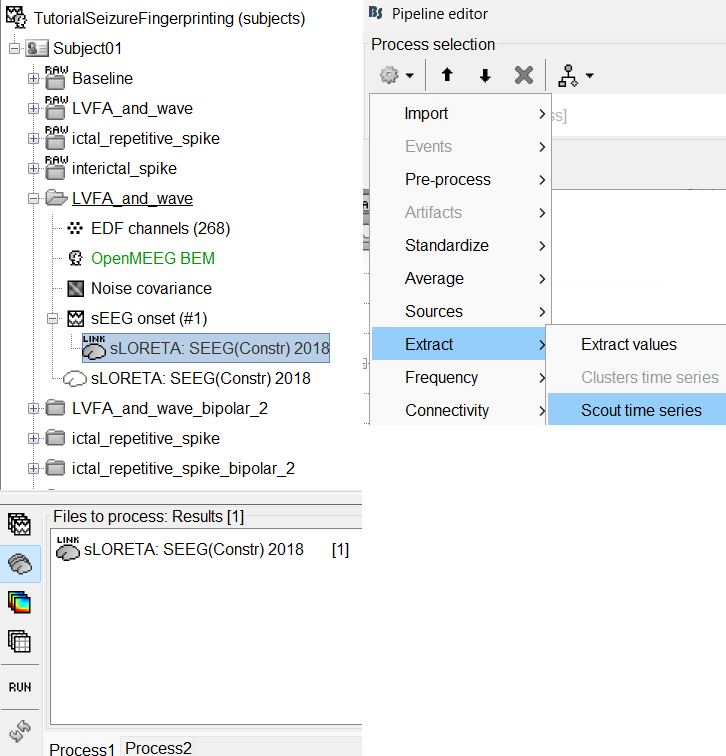
Add the process: Extract > Scout time series
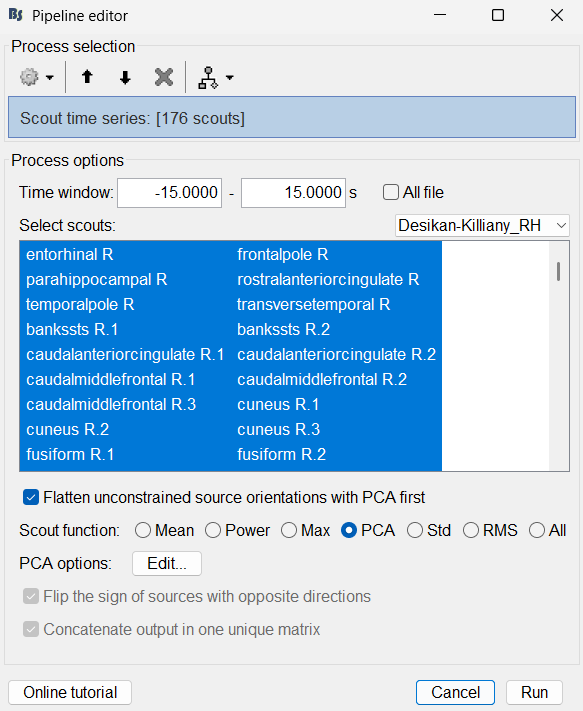
Select Desikan-Killiany [182].
Select scouts: Press Ctrl+A to select all the scouts in the box.
Select Scout function: PCA
A new matrix file sEEG onset (#1) | 182 scouts gets added to the database.
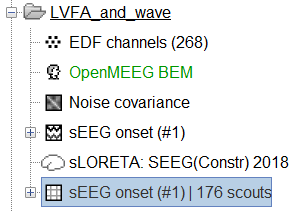
Right click on matrix file sEEG onset (#1) | 182 scouts > Display as time series.
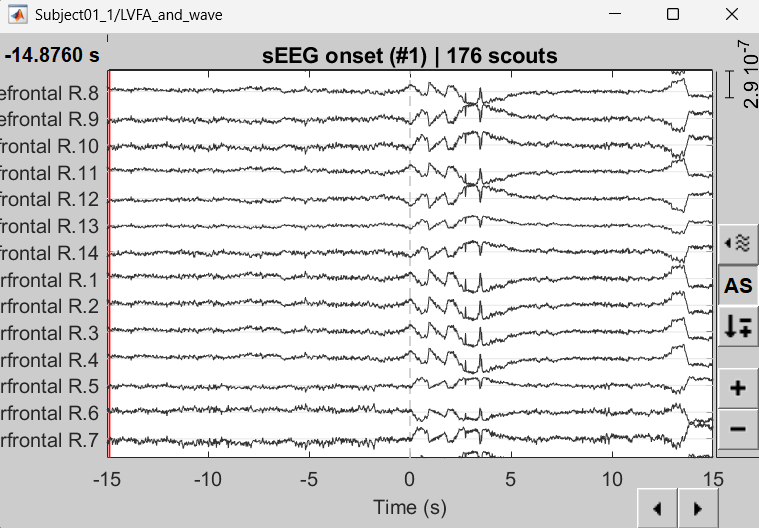
Compute time-frequency decomposition
Drag-and-drop matrix file sEEG onset (#1) | 182 scouts in Process 1, click [RUN]
Rest of the steps are the same as the corresponding earlier section in sensor space.
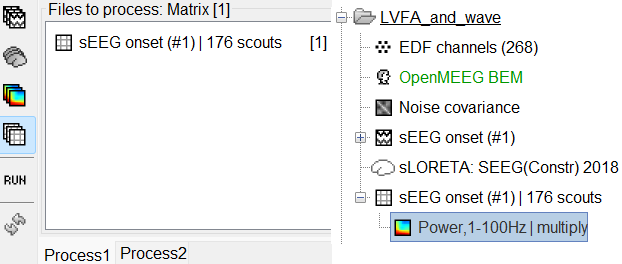
View time-frequency maps
Right click on matrix file sEEG onset (#1) | 182 scouts > Power,1-100Hz | multiply > Time-freq: All matrices
Right click on matrix file sEEG onset (#1) | 182 scouts > Power,1-100Hz | multiply > Time-freq: One matrix. Set selected data as postcentral R.3.
Click on Log(Power), Smooth display.
Set colormap: right-click on Colorbar > Colormap: Timefreq > Permanent menu, Turn-off [Absolute Value](if on), Maximum: Local, Contrast 52 Brightness -63
Right-click on the colored time-frequency plot > Power Spectrum, Time Series
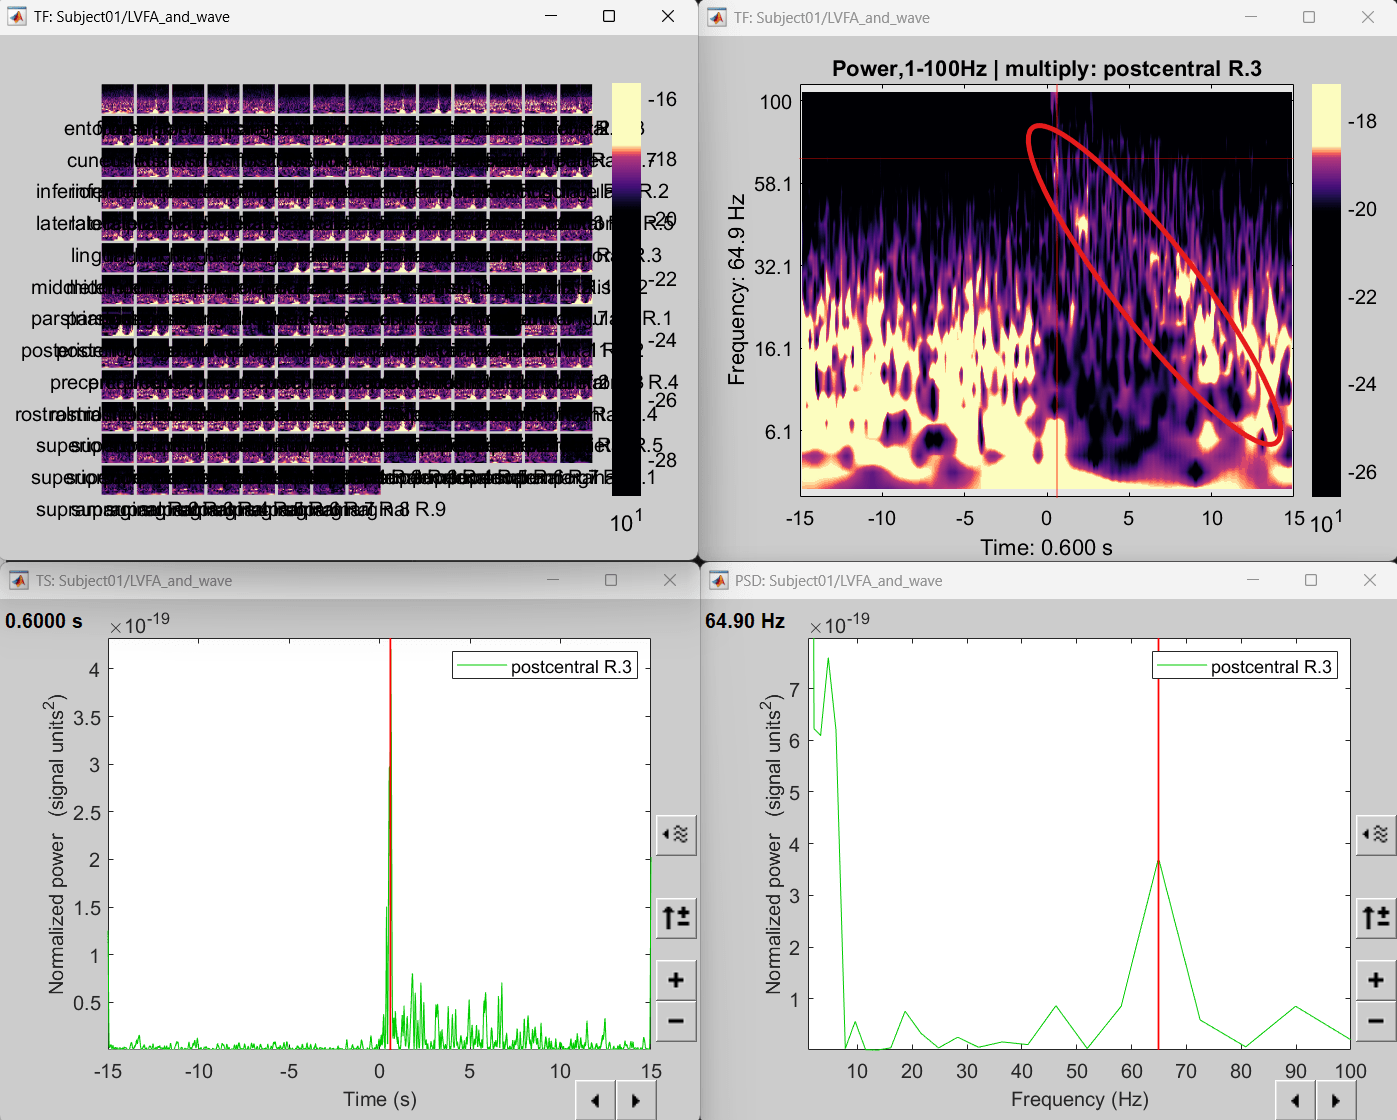
The red marked area above is the high frequency activity. The bottom right area contains the pre-ictal spikes that is signature of seizure fingerprinting. We can say that this patch of cortex postcentral R.3 was most associated with the LVFA pattern.
Modeling ictal onset with repetitive spiking
Sensor space
Display time-series
Expand the folder ictal_repetitive_spike_bipolar_2
Right click on sEEG onset (#1) | bipolar 2 > Display time series
Change Montage to PIN > PIN (orig)
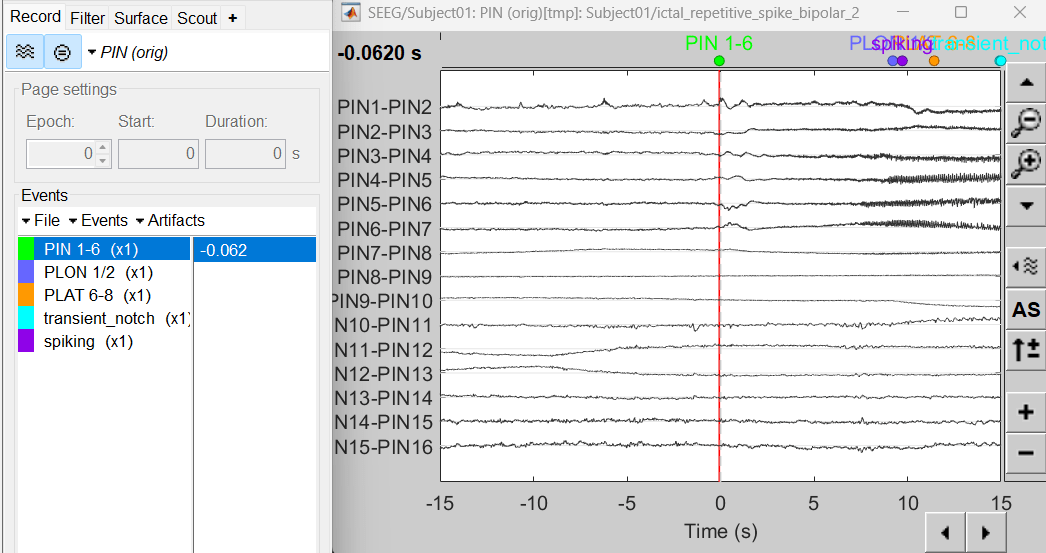
Compute time-frequency decomposition
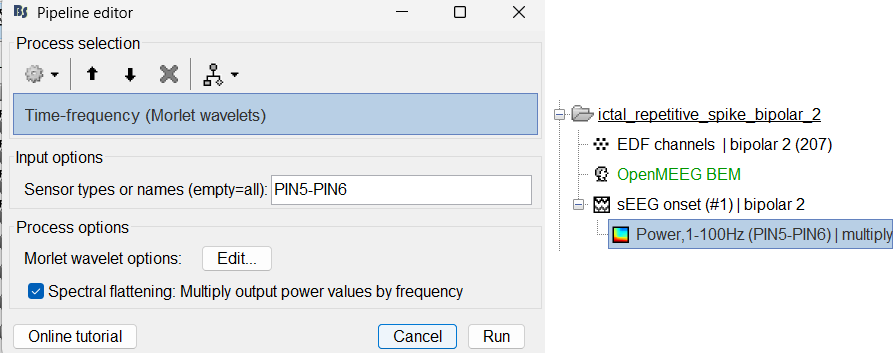
Same as above sections. Only one change, set sensor type: PIN5-PIN6 for Time-frequency (Morlet wavelets) process.
View time-frequency maps
Right click on file sEEG onset (#1) | bipolar 2 > Power,1-100Hz (PIN5-PIN6) | multiply > One channel. Set selected data as postcentral R.3.
Click on Log(Power), Smooth display.
Set colormap: right-click on Colorbar > Colormap: Timefreq > Permanent menu, Maximum: Custom [-18.5, -8], Contrast 23 Brightness -60
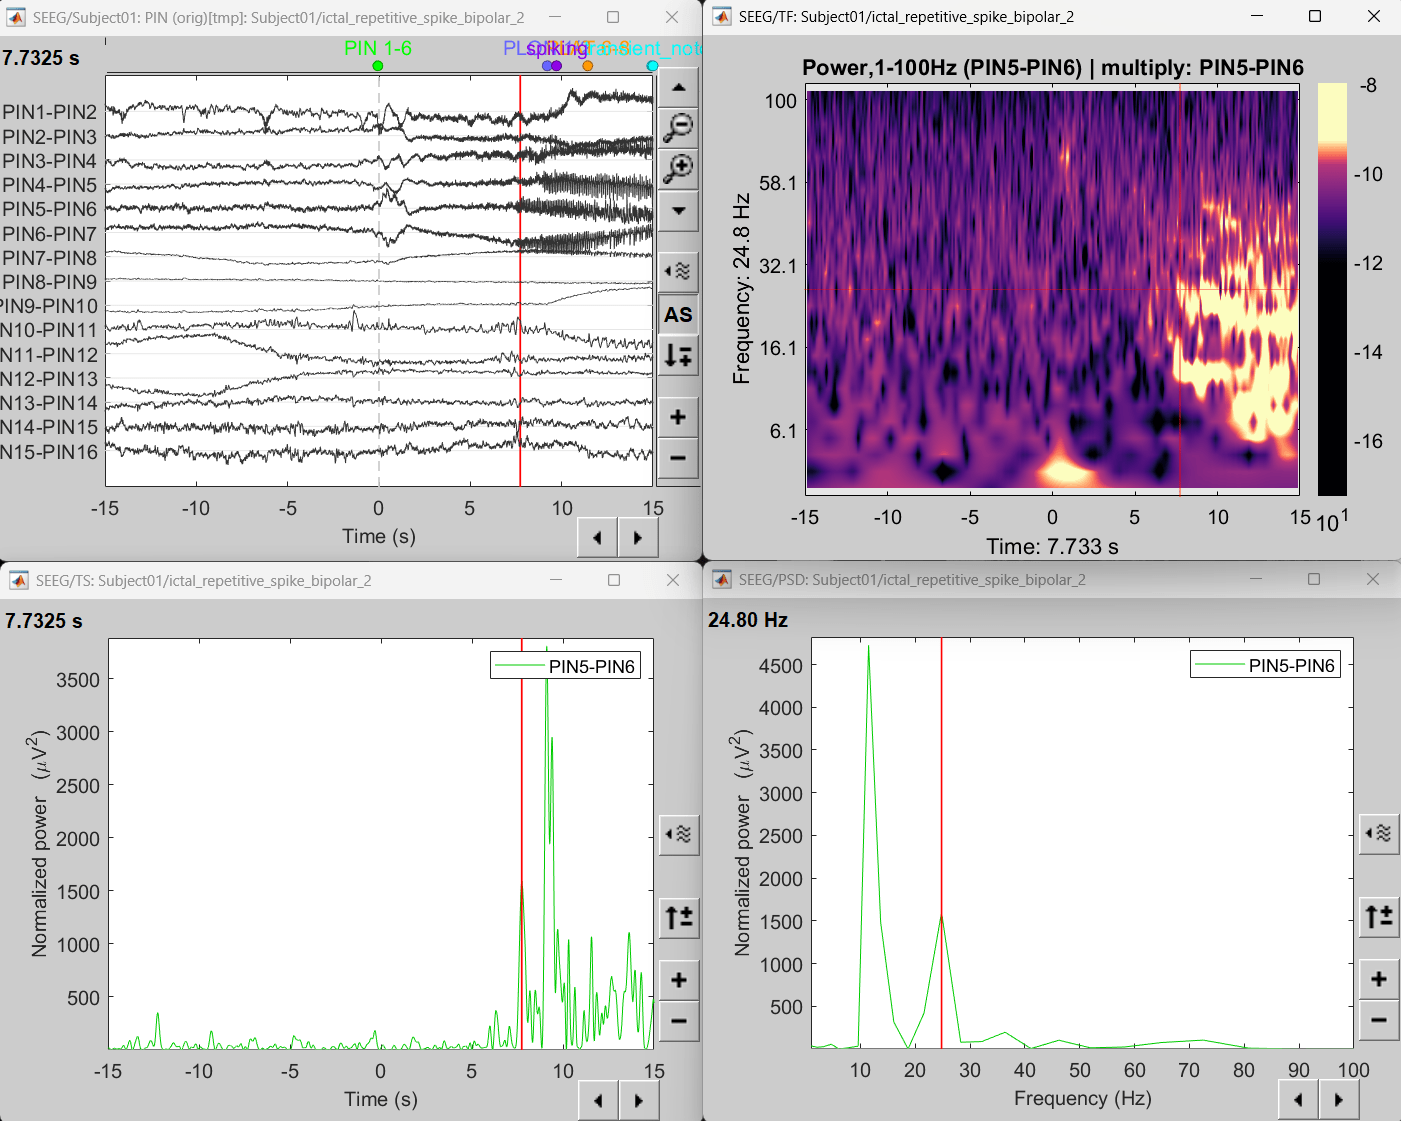
- The high frequency activity on the right is due to the rhythmic activity seen in the time series for PIN5-PIN6. On analyzing the time-frequency map, this activity is localized between 5Hz and 55Hz. So we need filter this frequency range so that our results are more focused on the rhythmic activity.
Source space
Compute inverse model
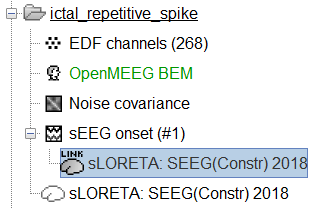
Switch to the folder ictal_repetitive_spike
Repeat the steps as in the previous section.
View sources
Right-click on sEEG onset (#1) > SEEG > Display time series.
Change Montage to PIN(orig)
Set frequency filter: High-pass: 5Hz, Low-pass: 55Hz
Display sources on MRI viewer
Right-click on sLORETA: SEEG(Constr) 2018 (LINK) > Cortical activations > Display on MRI (MRI Viewer)
Set colormap: Right Click on Colorbar > Colormap: Source > Permanent Menu, Maximum [0, 2].
Click on Surface tab, set Amplitude 33%
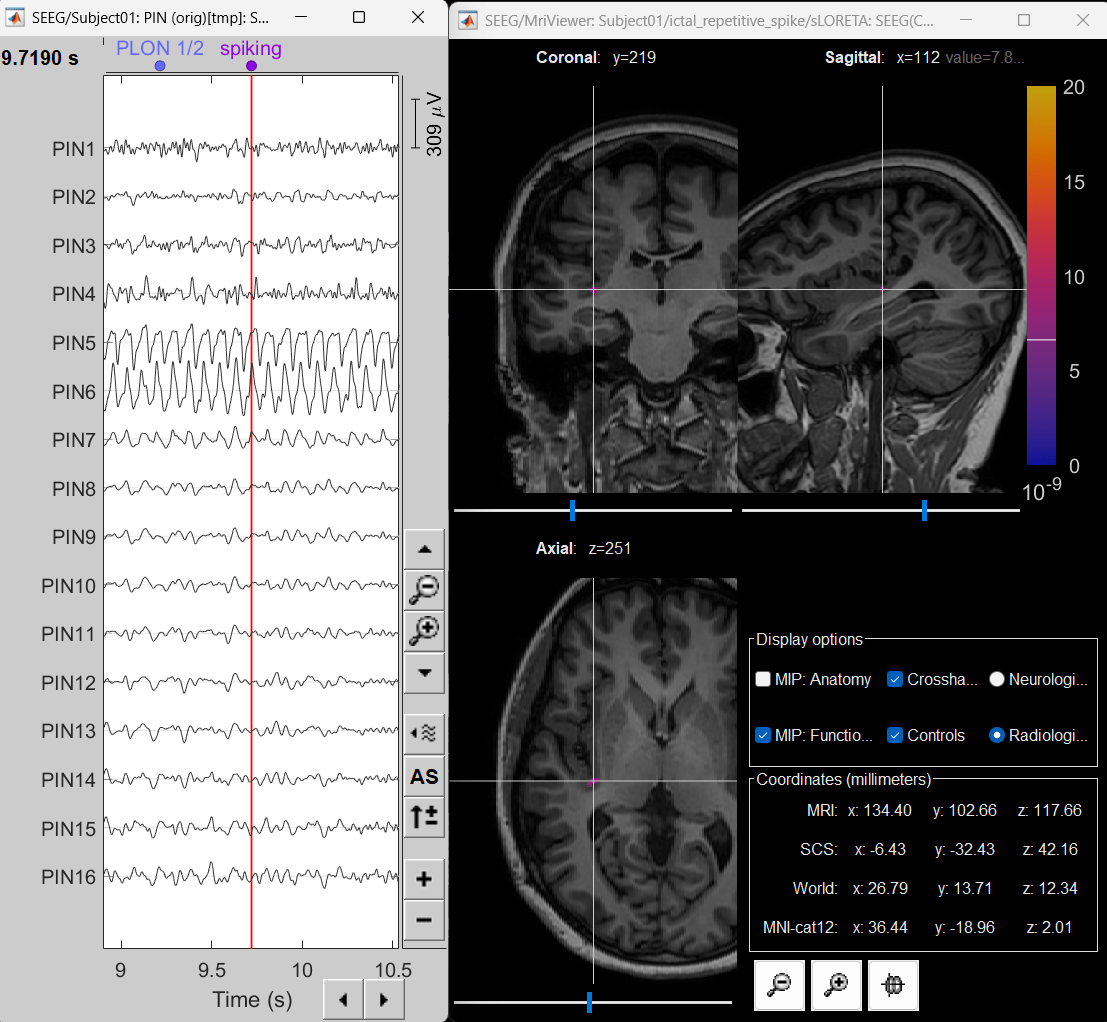
- The peak of the rhythmic activity localized on the patch of the cortex as seen in the MRI Viewer above.
Edit the contacts positions
The trajectory of electrode while implantation may not always follow a straight line as there could be bending introduced when the neurosurgeon inserts the electrode. In such cases we need to move these contacts to more appropriate positions.
For this section we will consider one such electrode from our dataset above which is marked below. Switch to anatomy tab, open the isosurface file under Subject01 and using the Thresh slider in the Surface tab set the isoValue to approximately 2280.
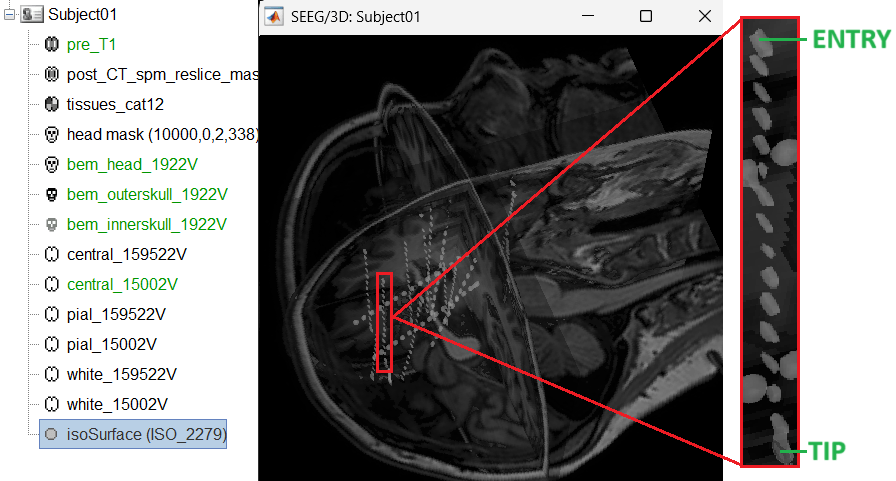
- This is a complex case where:
- The tip is not well separated from its adjacent contact.
- One of the contacts in the middle can be seen joined to another electrode's contact.
Play with the Thresh slider under Surface tab to get a good threshold that separates them out.
As per the sections Start implantation and Create electrodes and plot contacts manually above, create an SEEG electrode named SPM with model PMT 2102-16-091/2102-16-101. Switch to Surface tab first and change the isosurface threshold to approximately 2680 to get a clean tip for marking and then switch back to iEEG tab to do the implantation.
Set the isosurface threshold back to approximately 2280 for clear view of the 3D blobs. Select the 3D figure and toggle between the electrode (
 ) and sphere (
  ) modes to get the figures as under using buttons in iEEG panel. Keep it in the sphere mode for better visibility. The contacts definitely need to be corrected and moved to their right positions.
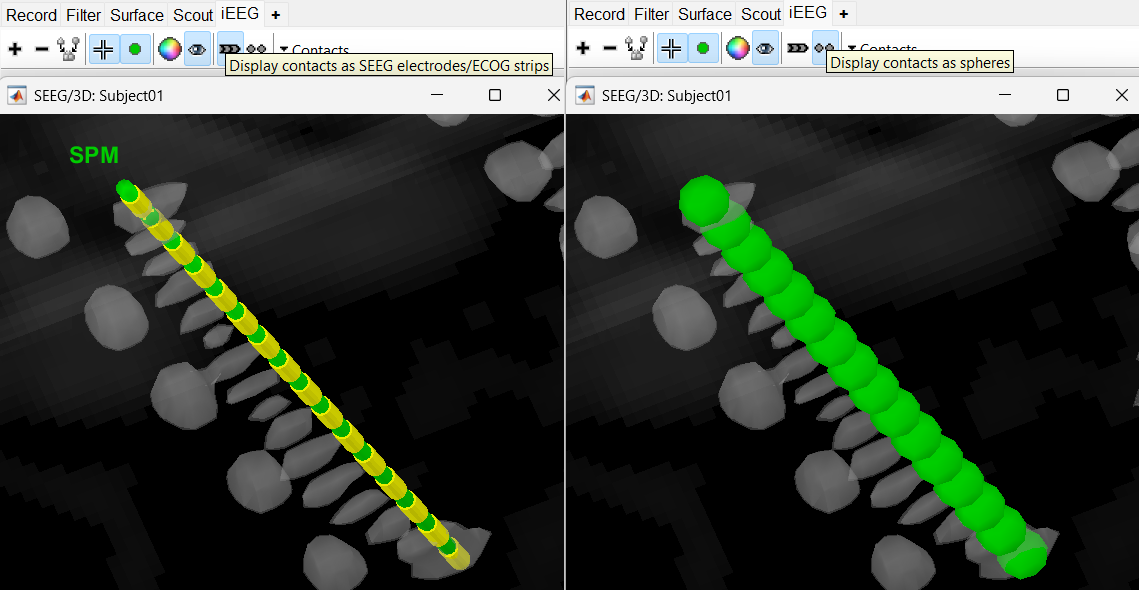
Display the contact labels in 3D figure by right clicking Channels > Display labels. It can be seen that the contacts SPM2-SPM16 are incorrect. Let us first correct contact SPM2.
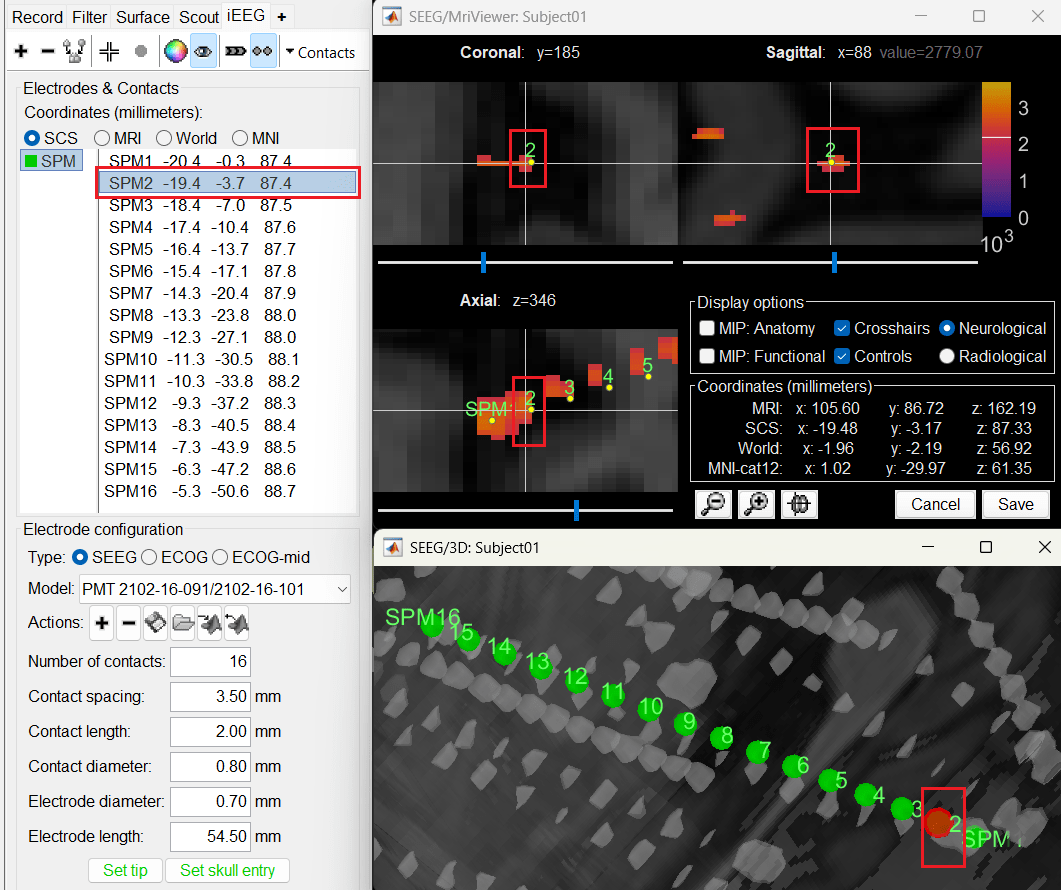
Switch to Surface tab, set the isosurface threshold back to approximately 2680 for separating out the tip and its adjacent contact blob (SPM2). Since the isosurface blobs are the correct ones, we can use them as ground truth guide to correct the contacts. Switch to iEEG tab, click the
 button (shortcut: Ctrl+P; to turn on surface point selection), click the
  button (to turn on centroid selection in surface) and click the correct 3D blob. That places a yellow crosshair on the blob and updates the MRI Viewer crosshair as well.
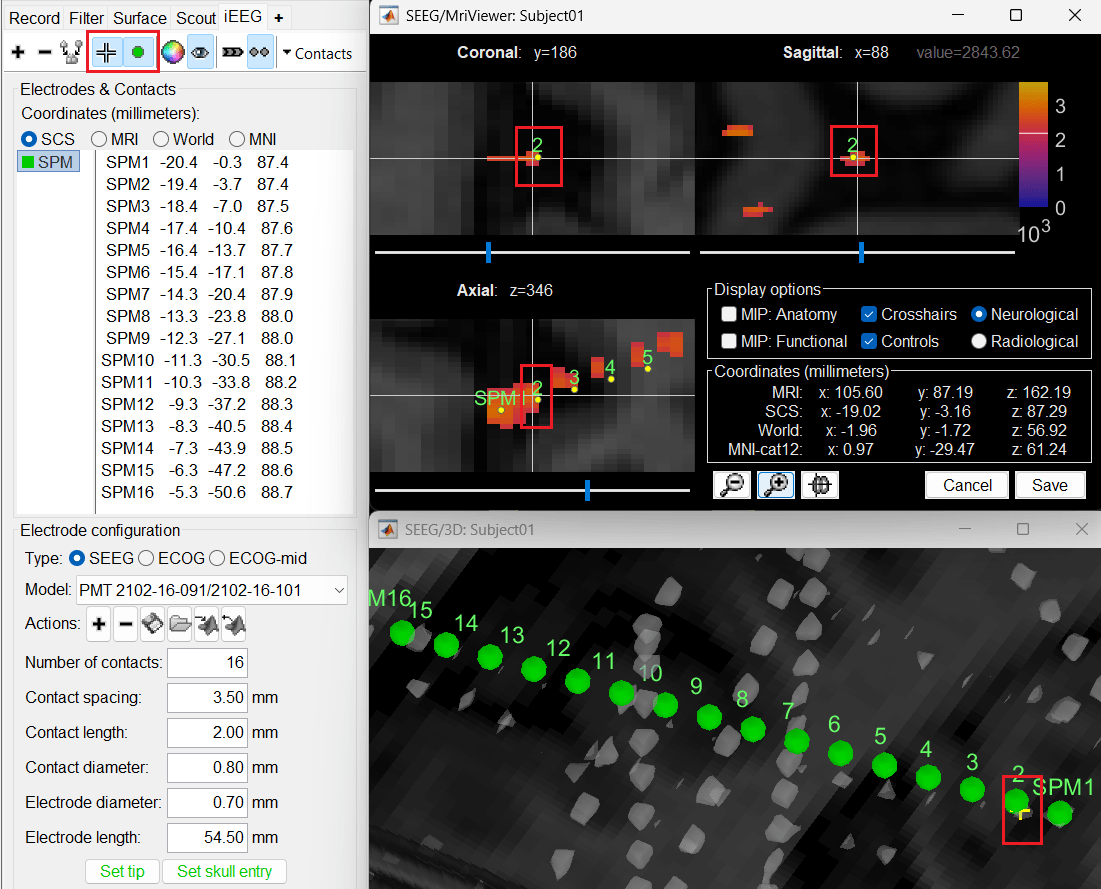
Without clicking anywhere else, move your cursor to the MRI Viewer, right click and go to Electrodes > Set electrode position (or press Ctrl+S). From the Set electrode position window choose SPM2 and press OK. This will update the position of SPM2 only in the MRI Viewer.
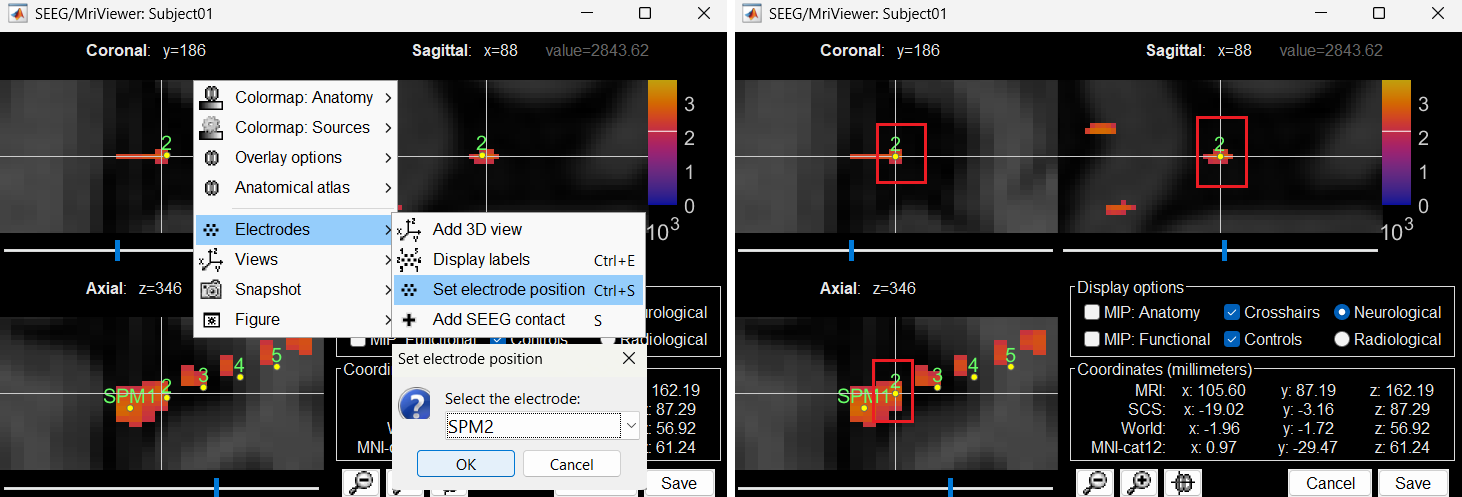
Click on Save and it closes all the windows and updates the channel file and number of channels in the database explorer.
Right click on Subject01 > SEEG/ECOG implantation. Click Continue for working on the existing implantation. Choose MRI+CT+IsoSurf to show all the figures. Switch to Surface tab, set the isosurface threshold back to approximately 2280 for clear view of the 3D blobs. Select the 3D figure and in the Panel iEEG, choose the sphere (
 ) mode for display. You will now see the updated contact in the 3D figure as well.
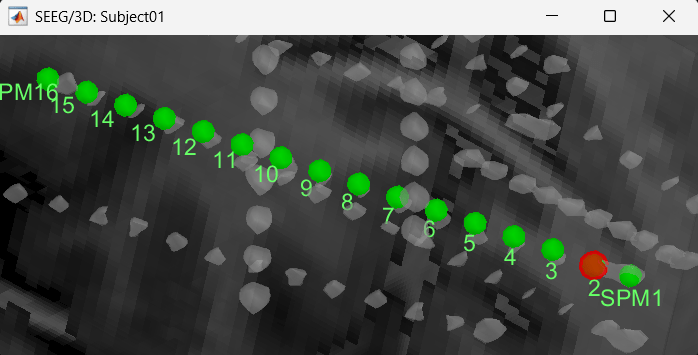
Follow the above steps to update all the remaining contacts as required. Unfortunately, Brainstorm currently does not have a way to handle curved electrodes display yet: if you move the contacts, the electrode remains represented as a straight line. This is a display issue only, which has no impact on any computation, but we hope to improve it at some point.
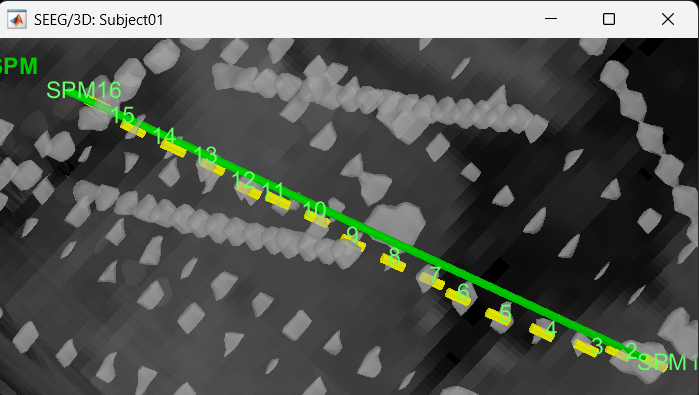
We have a functionality called line fitting that can help better view the trajectory in the 3D figure with sphere (
 ) display mode. Choose the electrode and click Contacts > Show/Hide line fit through contacts.
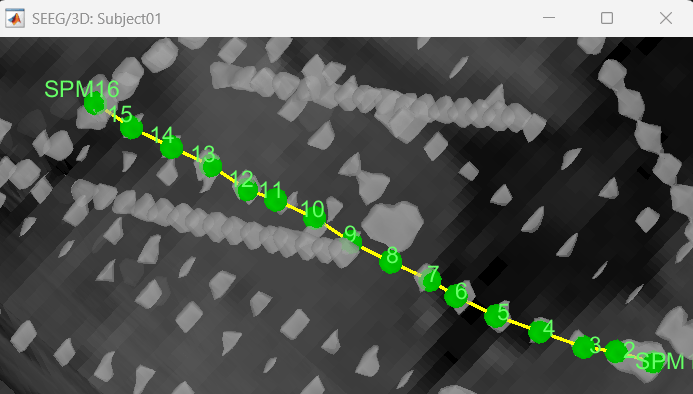
You can also edit the position of a contact directly in the MRI Viewer by clicking on its dot in one of the slice and moving it around. To do it you need to open the MRI Viewer in edit mode by right clicking on the channel file > MRI registration > Edit ... (MRI Viewer:...). Modifications are not saved immediately to the database and can be cancelled when you close the window.
You can also use the Add contact and Remove contacts feature in Brainstorm to edit the contacts.
Add contact can be done in the following ways:
Right click SEEG channel > Display sensors (SEEG: 3D MRI Viewer) > Surface tab (add isosurface) > Select electrode in panel iEEG > Turn on Select Surface Point > Select a location on the isosurface > click Contacts (menu) > Add SEEG contact in iEEG panel or press shortcut key S
Right click SEEG channel > Display sensors (SEEG: 3D MRI Viewer) > Surface tab (add isosurface) > Select electrode in panel iEEG > Turn on Select Surface Point > Select a location on the isosurface > Right click Channels > Add SEEG contact or press shortcut key S
Right click SEEG channel > Display sensors (SEEG: MRI Viewer) > Select electrode in panel iEEG > Set crosshair at a location in MRI Viewer > click Contacts (menu) > Add SEEG contact in iEEG panel or press shortcut key S
Right click SEEG channel > Display sensors (SEEG: MRI Viewer) > Select electrode in panel iEEG > Set crosshair at a location in MRI Viewer > Right click Electrodes> Add SEEG contact or press shortcut key S
Remove contacts can be done in the following ways:
Select contacts in panel iEEG > press Delete or Backspace
Select contacts in panel iEEG > click Contacts (menu) > Remove SEEG contacts
Select the contact in 3D figure > press Delete or Backspace
Select the contact in 3D figure > right click Channels > Remove contact
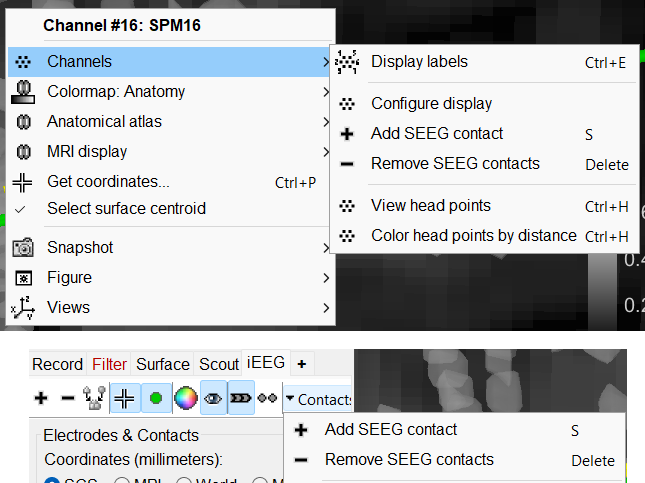
- The numbering of the contacts is automatically maintained in ascending order from tip to skull entry.
If user deletes all the contacts then then the number of contacts in this case goes down to 0 since all the contacts were deleted. It comes to a state like starting an SEEG electrode implantation from scratch but in this case the number of contacts need to be updated to the desired.
Export the contacts position
You can export the contacts created in Brainstorm as a text file to be used later in Brainstorm or in an external software.
Right click on the Implantation > SEEG/ECOG channel file, click File > Export to file, choose type as EEG: BIDS electrodes.tsv, subject space mm (*.tsv), set file name as Subject_electrodes_mm.tsv click Save, set the export reference MRI as post_CT_spm_reslice_masked_spm (as the implantation was done on it) and press OK.
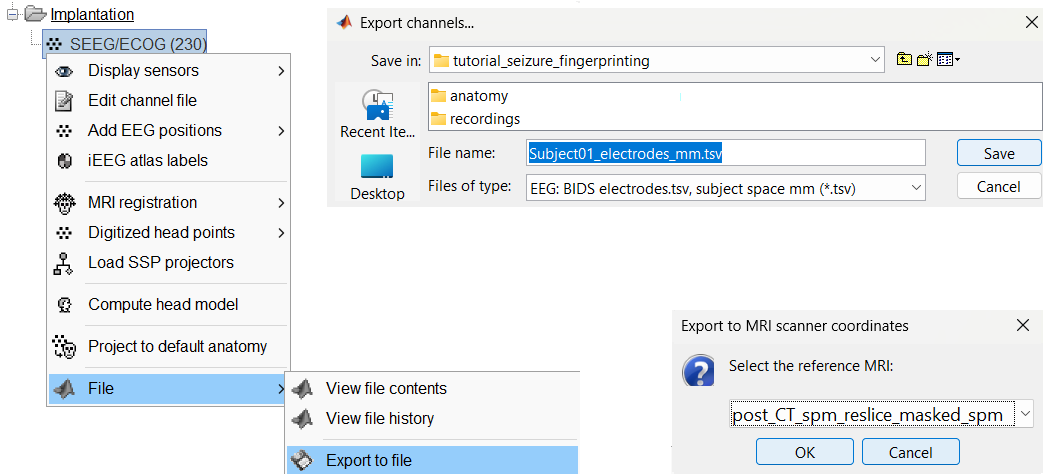
This exports the positions in the file in world coordinates.
Additional Documentation
Forum discussions
Related tutorials
Scripting
TODO
