|
Size: 51972
Comment:
|
Size: 51966
Comment:
|
| Deletions are marked like this. | Additions are marked like this. |
| Line 5: | Line 5: |
| === Changes in the scout processing === We made some important modifications to the way the scouts where handled in the processes. Now it is possible to select the atlas directly in the options of the process, and to process at the same time scouts from different subjects with different list of vertices. The new process function for extracting scouts is '''process_extract_scouts''' (before it was process_extract_cluster). The scout option value in the process is now a cell array, instead of the full scout structure.<<BR>>Example: '''{'User scouts', {'Scout1', 'Scout2'}}''' |
=== Changes in scout processing === We made some important modifications to the way the scouts where handled in the processes. Now it is possible to select the atlas directly in the options of the process, and to process at the same time scouts from different subjects with different list of vertices. The new process function for extracting scouts is '''process_extract_scouts''' (before it was process_extract_cluster). The scout option value in the process is now a cell array, instead of the full scout structure. Example: '''{'User scouts', {'Scout1', 'Scout2'}}''' |
What's new
A log of major improvements to Brainstorm's distribution.
Brainstorm is in a very active development state: small or major bug fixes and improvements are issued almost everyday. To update your version of the software easily: Install and update.
See also the full list of updates: brainstorm3/doc/updates.txt
November 2014
Changes in scout processing
We made some important modifications to the way the scouts where handled in the processes. Now it is possible to select the atlas directly in the options of the process, and to process at the same time scouts from different subjects with different list of vertices.
The new process function for extracting scouts is process_extract_scouts (before it was process_extract_cluster). The scout option value in the process is now a cell array, instead of the full scout structure. Example: {'User scouts', {'Scout1', 'Scout2'}}
This will affect all the processes that use scouts: time-frequency decompositions, power spectrum estimates, connectivity and PAC metrics. We tried to keep all the processes compatible with the previous input format, but there might be some modifications to do in personal scripts. If you have processes that use scouts structures in input, you might need to edit them to accept this new format. You can look at how it is done in process_canoltymap.m, or contact us through the user forum for help with updating your scripts.
October 2014
New anatomy template: Infant 7 weeks
The anatomical atlas presented in Kabdebon's article Anatomical correlations of the international 10–20 sensor placement system in infants is made available as a template in Brainstorm. To use this anatomy: create a new subject using an individual anatomy, right-click on the subject > Use template > Download: Infant7w.

EEG electrodes positions
It is now easier to manage the 3D positions of the EEG electrodes. To add electrodes positions to an existing channel file: right-click on the channel file > Add EEG positions. You can import the points from a file or from one of the default sets of positions available in Brainstorm.

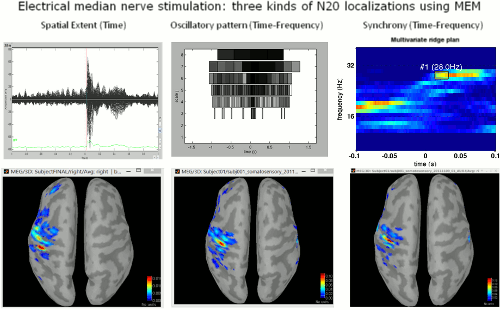
Brain Entropy in space and time
A tutorial is available online to introduce a new Brainstorm plug-in BEst: Brain Entropy in space and time which offers three new source localization approaches for EEG and MEG data, based on the framework of the Maximum Entropy on the Mean (MEM). These methods are particularly dedicated to estimate accurately the spatial extent of EEG/MEG generators with time series stable within parcels, to localize the generators of oscillatory patterns and synchrony.
Data export
All the files in the Brainstorm database can now be exported as ASCII, CSV and Excel files: channel positions, recordings, sources, time-frequency maps and connectivity matrices.
September 2014
Filtering continuous files
Major modifications were made to the way the continuous files are handled:
The continuous files saved by Brainstorm when applying a filter to a native file are now saved in a new file format (Brainstorm binary, extension .bst), regardless of the original file format. The values in this file are saved in floating point double precision to avoid the re-conversion to integer 16bit needed to save CTF of FIF files, which cause significant loss of data quality.
- Those files are not saved anymore in the same folder as the original data, but in the Brainstorm database itself. Removing the links to the processed files from the Brainstorm database now deletes the actual files.
All the frequency filters can now be applied to all the file formats, EEG and MEG.
To revert to the previous behavior (saving to native CTF or FIF files, in the database folder), use the menu File > Edit preferences > options "Store continuous files in original folder" and "Save continuous files in original format".
- The channel file structure is not copied anymore in the sFile structure used as the descriptor of the continuous files. This information can be read only from the channel file now. Personal scripts might need to be updated to consider this modification.
August 2014
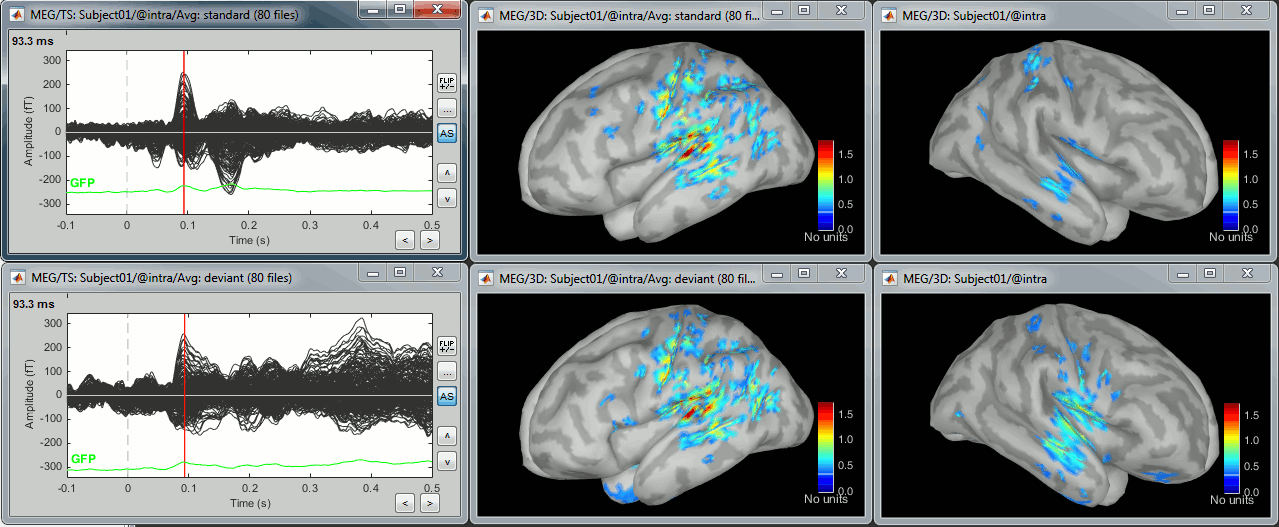
Brainstorm-FieldTrip auditory tutorial
A new tutorial proposes a standard pipeline for the complete analysis of a simple oddball paradigm in MEG: Brainstorm-FieldTrip auditory tutorial. It presents the workflow in the Brainstorm environment, the equivalent documentation for the FieldTrip environment will be available on the FieldTrip website.
July 2014
New processes
- Notch filter: Offered as an alternative when the sinusoid removal doesn't work well
- Bandstop filter: Same thing for larger artifacts
- Remove linear trend
File > Select files: Get all the files from a specific folder with a process
- LCMV Beamformer (HL Chan implementation)
Interface improvements
- SSP generic: New options "Average", "Use existing SSP projectors" and "Save average artifact"
- Display of the EEG electrodes in the MRI viewer
- Time-frequency figures: New option "smooth display"
New figure popup menu: Snapshots > Open as figure
- Support for the new Matlab2014b graphics system
June 2014
Resting-state MEG and phase-amplitude coupling
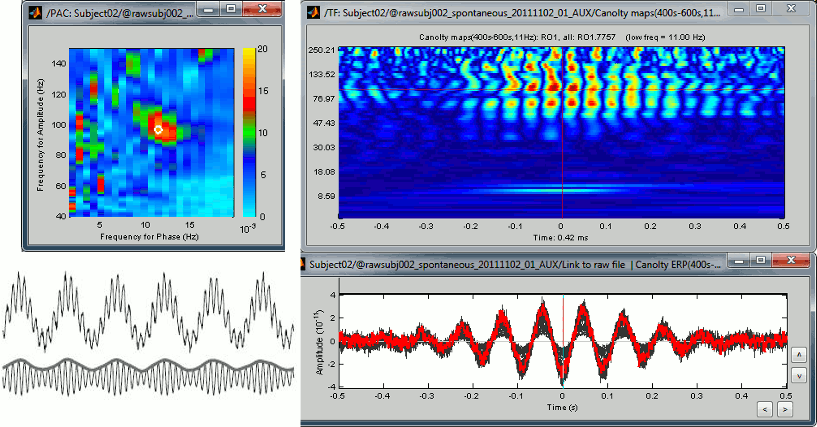
Two new tutorial are available online to explore the cross-frequency coupling in MEG resting state recordings: Resting state MEG and Phase-amplitude coupling
They will allow you to reproduce step-by-step the analysis and the results illustrated in this article:
Canolty RT, Edwards E, Dalal SS, Soltani M, Nagarajan SS, Kirsch HE, Berger MS, Barbaro NM, Knight RT,
High gamma power is phase-locked to theta oscillations in human neocortex
Science, 313(5793):1626-8.
Elekta-Neuromag tutorial
A updated version of the Elekta-Neuromag tutorial is finally available: click here.
May 2014
New processes
- Apply montage: To save the result of a custom EEG electrode montage
- Surface smoothing: Now supportes time-frequency files in input
- Export to SPM: Now supports time-frequency files in input
Other improvements
- Display EEG/ECoG/sEEG electrodes in the MRI viewer
- MRI Viewer: Allow the direct overlay of two MRI volumes
- Spectrum plot: The frequency axis can be displayed using a logarithmic scale
- SSP: Create from one time point of recordings
- EDF file format: Added the support for multiple Annotation channels
April 2014
Mixed head models
New developements allow more flexible configurations of source models. Now, different brain regions (cortical or subcortical) can be modeled using different constraints. From the Scout tab, select the menu Atlas > New atlas > Source model option. All the scouts present in this atlas can be associated with different source constraints (surface/volume, constrained/free orientation). Then, when computing the head model, select the option "Custom source model".
This work will be soon part of a detailed tutorial showing how to use efficiently sub-cortical atlases for estimating sources in the deeper regions of the brain.
3D scouts
Scouts may now be defined on 3D source grids. Display the volume-based source results in 3D, then use the Scout tab exactly the way you would do it for surface maps.
March 2014
Yokogawa tutorial
A new online tutorial teaches Brainstorm users how to import and process Yokogawa MEG recordings:
Yokogawa/KIT tutorial
New processes
- Granger causality spectral
- Native support for scouts in all the connectivity functions
- Simulation of auto-regressive signals
- Simulation of recordings based on scouts time-series
- SSP calculation with two inputs for more flexibility
February 2014
EEG and epilepsy
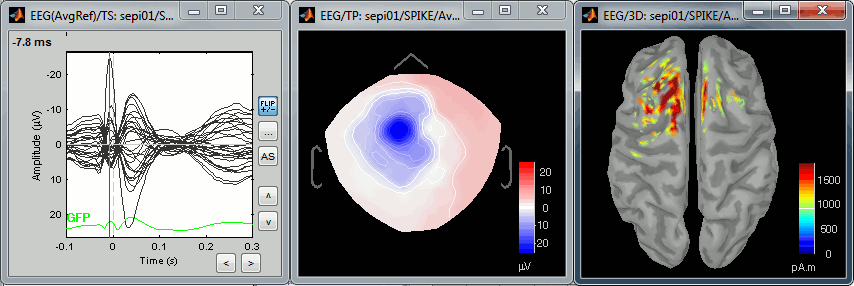
Many features have been added for displaying and processing clinical EEG and invasive measurement data (ECoG and LFPs). These tools are illustrated in a new online tutorial EEG and epilepsy. It is based on a clinical case from the Epilepsy Center at the University Hospital of Freiburg, Germany. The anonymized dataset can be downloaded directly from the Brainstorm download page.
January 2014
Montage interface
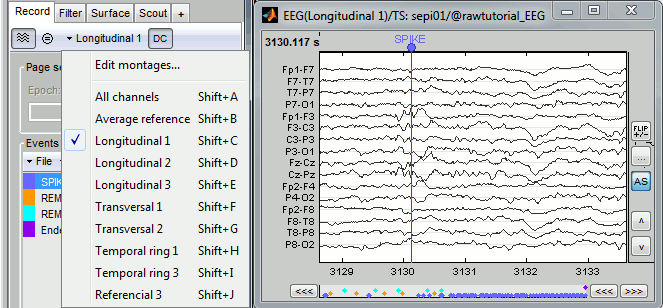
The "channel selection" menu and the "EEG average reference" button have been replaced with a more flexible interface to edit montages. Montages can be used to simply select a list of sensors, re-order them in the display or to do more complex operations. The term refers mainly to EEG, to define the referencing system used to display the values recorded on the electrodes: bipolar montages, custom reference electrodes, average reference. See tutorial: Exploring the recordings
Some EEG montages recommended by the American Clinical Neurophysiology Society have been added to the distribution: longitudinal bipolar, transversal bipolar and referential. They are saved in .mon files in the folder brainstorm3/toolbox/sensors/private.
Average reference: SEEG and ECoG
The average reference is now offered in the the list of available montages for EEG, SEEG and ECoG recordings. By default, the average is calculated from all the electrodes and the same value is subtracted everywhere. In some cases, you may be interested in calculating different averages from different subgroups of electrodes: multiple cortical grids or electrodes stripes. To do this, you have two options:
Create a montage manually that defines exactly what are the operations to perform. For instance, if you have 4 electrodes E1..E4 you want to group together, enter four lines, one for each electrode, with this structure: E1: 0.75*E1, -0.25*E2, -0.25*E3, -0.25*E4
The main problem with this approach is that this montage is not used during the source reconstruction procedure. When possible, always consider the second option.Set the comment of the electrodes to define the groups. Right-click on the channel file > Edit channel file. Select the electrodes of group #1, right-click > Set channel comment. The electrodes with the same comment would be averaged together.

Signal viewer improvements
Flip +/- button: Exchange the direction of the Y axis, useful in clinical EEG
Clone figure: Right-click on the figure > Figure > Clone figure, or open twice the same data file from the popup menu in the database explorer. You can set different montages on the cloned figures, so you can look at the same information in different ways simultaneously.
Shortcut: Go to the next/previous half page (F4 / Shift+F4)
Setting manually time and amplitude resolutions: right-click > Figure > Set axis resolution
- Optimized scrolling time
Desktop management
Dealing with multiple figures can be annoying when you review lots of recordings.
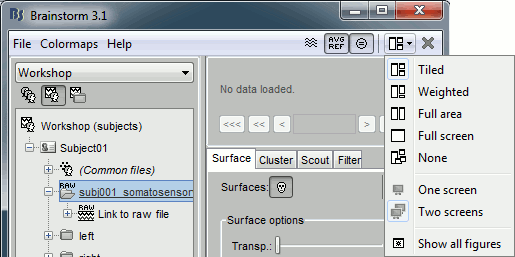
The menu "Window layout options" can help you organize all the opened figures in an efficient way. There are four options for the automatic placement of the figures on the screen, and you can also save your own specific working environment with the new menu User setups.
See tutorial: Exploring the recordings
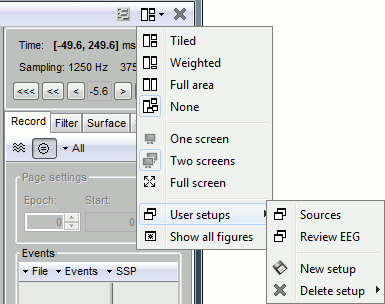
Colormaps
The management of the colormaps has been revamped to include non-symmetrical colormaps. You can now set independently the minimum and the maximum of the figure colorbar. A white marker has also been added to the colorbar when displaying source maps, to indicate the level of the amplitude threshold.
See tutorial: Exploring the recordings
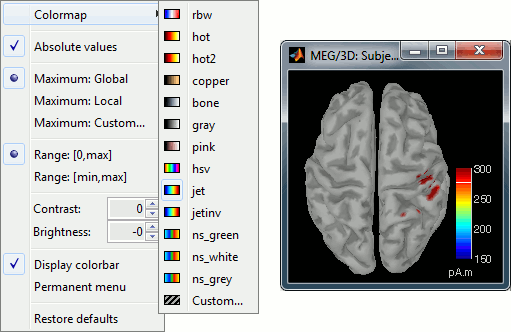
December 2013
Filter files by name or comment
A new filter text box can help you select easily files in the Process1 and Process2 tabs.
See tutorial: Selecting files in the database.
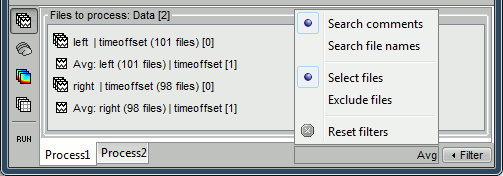
New supported file formats
- EEG: Deltamed Coherence-Neurofile (.bin/.txt)
Electrophysiology: NeuroScope / Klusters (.eeg/.dat)
Other improvements
- Re-organization of the tabs: now they can be added and removed on demand
- Scouts: Remove a vertex from a scout by holding the shift key while clicking
- OpenMEEG: Help menu to make it easier to install or update
November 2013
New processes
Simulate > Auto-regressive and custom signals
Simulate > Simulate recordings from scouts (transform matrix files into source files)
Extract > Apply statistic threshold (export stat file with a specific static threshold)
Extract > Unconstrained to flat map (convert unconstrained sources to flat cortical maps)
File > Add tag
File > Select files with tag
Events > Detect analog triggers
- Sort event groups by name/by time (Record tab, menu Events)
October 2013
New tutorial: How to write your own plugins
Brainstorm offers a flexible plug-in structure. If you are interested in running your own code from the Brainstorm interface and benefit from the powerful database and visualization systems, the best option is probably for you to create your own process functions.
You would be able to exchange code easily with your collaborators and the methods you develop could immediately reach thousands of users. Once your functions are stable, we can integrate them in the main Brainstorm distribution and maintain the code for you to ensure it stays compatible with the future releases of the software.
Tutorial: How to write your own process
September 2013
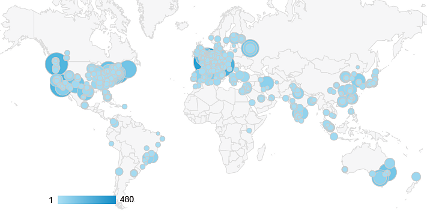
Find Brainstorm users next to you
Brainstorm and SPM
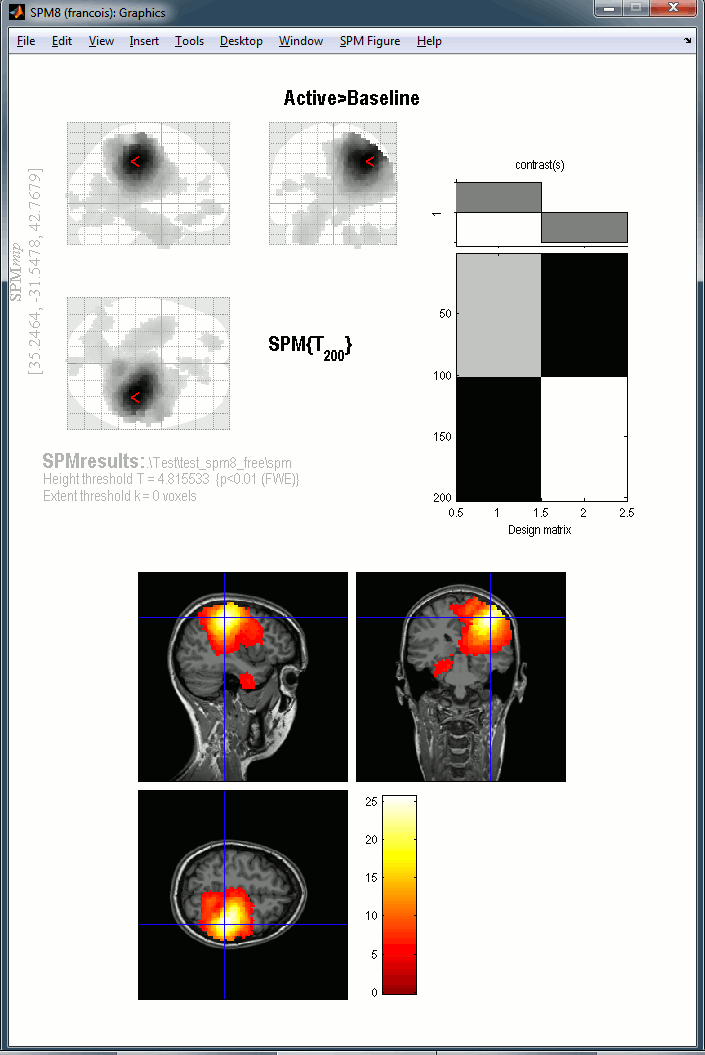
It is now very easy to pre-process your recordings and estimate sources in Brainstorm, and do you statistics in SPM8 and SPM12. This powerful combination is illustrated in the following tutorials:
Export volume source maps to SPM8
Export surface source maps to SPM8/SPM12.
August 2013
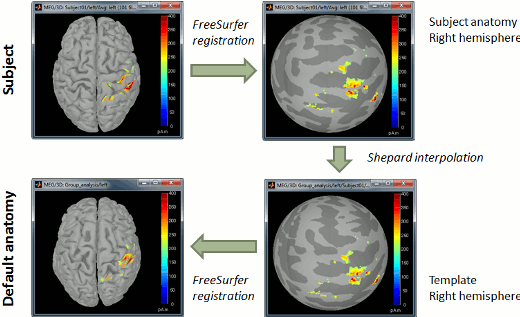
Using FreeSurfer for the subject coregistration
The FreeSurfer software registers all the subjects to the FSAverage atlas using a spherical representation of the cortex. Each hemisphere of the subject's brain is inflated to a sphere, which is then deformed to match the curvature map of the equivalent sphere in the FSAverage subject.
In the case of a group study, those results are now used by default in Brainstorm to register all the subjects on the same default anatomy. For more information, read the group analysis tutorial.
July 2013
FreeSurfer subcortical atlas and cortical maps
Many news on the FreeSurfer import side. Now Brainstorm imports the subcortical atlas aseg.mgz as a set of surfaces. The cortical thickness results can also be saved in the database and explored easily. More information on the FreeSurfer tutorial page.
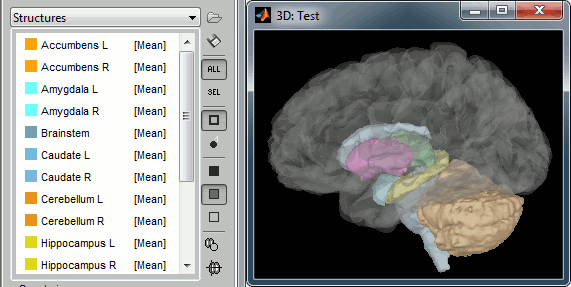
New anatomy templates
New models are available to replace the previous Colin27 default anatomy in your Brainstorm protocols. Right-click on (Default anatomy) > Use template. If a package is not available on your system, it will be downloaded from the Brainstorm website and saved in $HOME/.brainstorm/templates. The options available in this menu are:
Colin27: Average of 27 scans of the same head, processed with FreeSurfer 5.3: more information
Colin27_2012: Previous version of the default anatomy distributed with Brainstorm
ICBM152: Non-linear average of 152 subjects, processed with FreeSurfer 5.3: more information
FSAverage: Average of 40 subjects using a spherical averaging described in (Fischl et al. 1999)

MRI segmentation: CIVET
The results of the CIVET anatomical segmentation pipeline, developed at the MNI, can be automatically imported in Brainstorm (surfaces and cortical thickness maps). Right-click on a subject > Import anatomy folder > Select "CIVET folder".
More information: CIVET website and CIVET tutorial.
Join the Brainstorm user community
A new section of the website dedicated to usage statistics and exchange between users: User community.
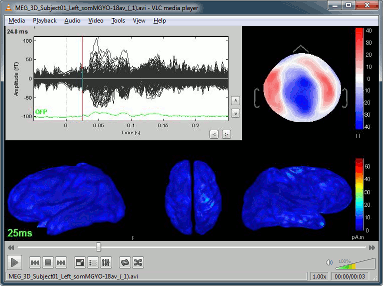
Brainstorm movie studio
A new fantastic feature to create movies: the "Snapshop > Movie (time): All figures" that you can find on all the 2D and 3D figures. Instead of capturing one figure only, it captures them all and create a movie showing what you see on the screen. Arrange your figures the way you want and create a movie of all your workspace at once.
May 2013
MRI segmentation: BrainSuite support
The results of the BrainSuite anatomical segmentation can be automatically imported in Brainstorm (surfaces and atlases). See: BrainSuite website and BrainSuite tutorial.
New processes
Standardize > Concatenate recordings
Test>StudentT-test: Now available on time-frequency maps
Standardize>Uniform row names: Re-order the signals in a set of files to make them compatible.
Average>Average rows: Average the different signals in a time-frequency file.
Pre-process>Band-pass filter: Now available on source maps
Standardize>Event related perturbation
Events > Add time offset
April 2013
Event markers in the imported recordings
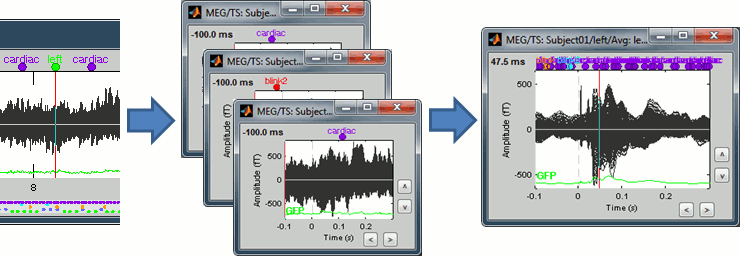
All the time markers available in the continuous recordings are now preserved when importing epochs in the database. It is also possible to add new markers to segment of recordings imported in the database, and to generate new epochs based on them.
A new option of the averaging process allows all the events from all the individual epochs to be combined. It can be a quick way to check that an event of interest (for instance the eye blinks) is not time-locked to the stimulus.
Dynamic Z-score
The Z-score operation, ie. the normalization of the signals by the level of noise calculated over a baseline, now exists in two forms. The process previously called "Compute Z-score" is now available as "Standardize > Z-score (static)".
The new process "Standardize > Z-score (dynamic)" produces the exact same results in terms of display, but calculated in an optimized way. Instead of re-writing the full file with the normalized values, we save only the mean and the standard deviation over the baseline for each signal, and apply the normalization on-the-fly when the file is loaded in memory.
This has almost no impact for the sensor data, but is a great improvement for the source files for which only the inversion kernel is saved. The static Z-score process would rebuild and save the full source matrix [Nsources x Ntime], while the dynamic version can keep the compact formulation of the linear inverse operator [Nsources x Nsensors]. The resulting files are much smaller and faster to open and review.
March 2013
Phase-amplitude coupling
The process "Frequency > Phase-amplitude coupling" offers a new way to explore the interactions between different frequencies. Phase-amplitude coupling (PAC) refers to the modulation of the amplitude of high-frequency oscillations by the phase of low-frequency oscillations. This process identifies in any type of signal the couple of low/high frequencies that maximizes the PAC metric introduced in [Canolty, 2006]:
Canolty RT, Edwards E, Dalal SS, Soltani M, Nagarajan SS, Kirsch HE, Berger MS, Barbaro NM, Knight RT,
"High gamma power is phase-locked to theta oscillations in human neocortex", Science, 313(5793):1626-8.
The process "Frequency > Simulate PAC signals" proposes a model for generating signals with a strong phase-amplitude coupling, for simulation purposes.

Multiple MRI volumes
Two or more MRI volumes can be imported for the same subject, if they have the same size and are properly co-registered. Only the first volume is used as a reference for placing the fiducial points, the additional ones are there for visualization purpose only. This feature can be useful for grouping different sequences (T1/T2), pre-op and post-op scans, regions of interest from fMRI results, or volume-based anatomical atlases.

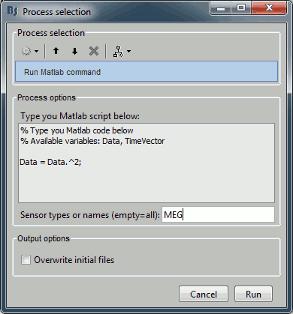
Process: Run Matlab command
The process "Pre-process > Run Matlab command" is very simple but very powerful. It loads the files in input and run the signals through a piece of Matlab code that you can edit freely. It can extend a lot the flexibility of the Brainstorm pipeline manager, providing an easy access to any Matlab function or script.
CTF/Neuromag dipole estimation
Dipoles localizations from the CTF DipoleFit and Neuromag Xfit software can be imported in the Brainstorm database and displayed on the same figures as cortical maps. See tutorial: ?Import and visualize dipoles.
February 2013
Intra-cranial EEG
The last version of the OpenMEEG software includes the ability to calculate forward models for cortical grids and intra-cortical electrodes. We integrated those changes to allow the calculation of sources for those two types of implanted electrodes. To be available in the forward and inverse model options, you need to change manually the type of the channels to respectively "SEEG" and "ECOG" (right-click on the channel file > Edit channel file). More tools are coming to visualize the amplitudes and select the position of the electrodes in the MRI viewer. If you are using these features, please cite both Brainstorm and OpenMEEG in your publications (see How to cite Brainstorm and OpenMEEG BEM head model).
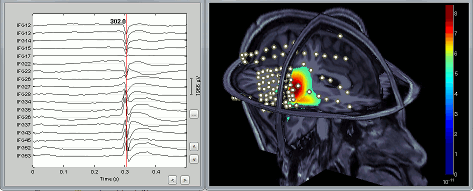
Yokogawa/KIT MEG recordings
The Yokogawa/KIT MEG recordings are now supported. They can be visualized, processed and epoched easily, such as any other file format. The reading function is based on the Yokogawa MEG Reader toolbox in Matlab, version 1.4. Supported extensions: .sqd, .con, .mrk, .ave. Some features will be improved shortly, such as the reading of the channel names, the events and the MEG/MRI registration, but the first prototype is fully working.
The events have to be processed manually: link the continuous file to your subject, then run the process "Events > read from channel" on the "Link to raw file". Select the options TTL or RTTL, and type the names of the channels to use as stim channels (example: " null045, null046").

Figure layouts
We are adding some more flexibility to the way the figures are arranged automatically on the screen. You can explore the different options available in the Layout menu. More features to come, including the ability to save custom layouts for the different types of figures.
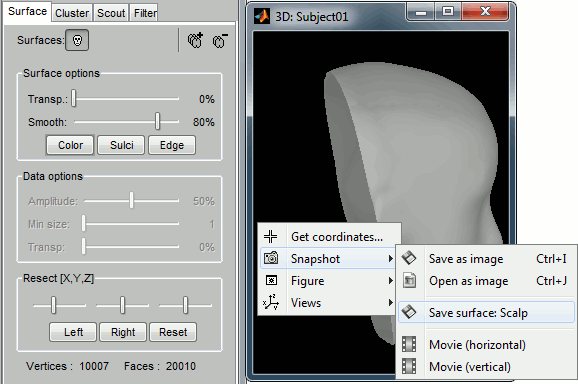
Save surface snapshot
You can now create a new surface from the one that is displayed in a 3D figure. The exported surface would include all the current modifications: smoothness and resections. Right click on the figure > Snapshot > Save surface.
January 2013
Documentation
Many new step-by-step tutorials are now available, covering the processing and epoching of continuous files, the artifact rejection and the graphical scripting:
Report viewer: reload a pipeline
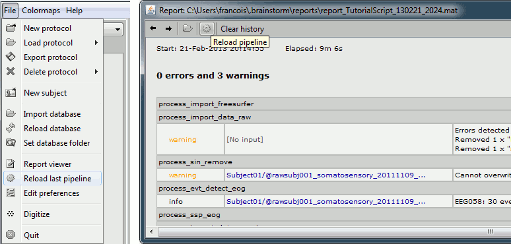
A report is generated each time an operation is executed from the Process1 or Process2 tabs, and saved automatically in the user folder ($HOME/.brainstorm/reports). You can browse through all the previous reports for the current protocol using the Report Viewer (File > Report viewer).
The reports can be reloaded easily: the menu "File > Reload last pipeline" selects again all the files that were selected previously, and opens the Pipeline Editor window and selects all the previous processes. The new button "Reload pipeline" in the toolbar of the Report Viewer allows you to reload any of the previously executed operations.
Processing continuous FIF files
Some important pre-processing operations are now available directly on continuous recordings in FIF format (usually Elekta-Neuromag MEG/EEG recordings). The new available processes include: the band-pass filter, the sinusoid removal (notch filter) and the baseline correction.
To process a continuous FIF file: link it to the Brainstorm database (right-click on the subject > Review RAW file), then drag and drop the "Link to raw file" in the Process1 box. Select a process in the Pre-process category. In output, it would create a new native continuous FIF file in the same folder, and also link it into the Brainstorm database. This feature is also available for CTF recordings, and is one of the key elements of our recommended pre-processing pipeline, as illustrated in the tutorial ?Detect and remove artifacts.
Copy of the noise covariance
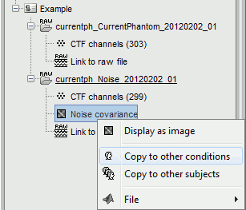
As explained in the tutorial ?Noise covariance, the best way to estimate the sensors noise for MEG source reconstruction is to use empty room measurements. This implies that you have to import the noise measurements, calculate the noise covariance matrix, and copy it to the other acquisition runs or subjects.
You can use the popup menus "Copy to other conditions" or "Copy to other subjects", directly copy the file to the target condition using File>Copy/Paste, or use the equivalent keyboard shortcuts Ctrl+C / Ctrl+V. All three operations would automatically re-arrange the noise covariance matrix in case the order/number of channels is different for the noise and the target recordings.
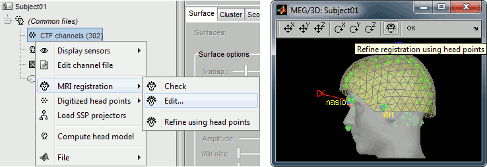
MRI registration: joining interactive and automatic methods
The co-registration of the MEG/Polhemus positions with the anatomy of the subject (MRI+surfaces) is not an easy task. We offer three approaches that should be combined to get the best possible results: a first approximation based on three fiducial points (NAS/LPA/RPA), the automatic fit of the Polhemus head shape on the head surface from the MRI, and an rich interface for refining the results manually. The problem of the automatic method is its strong dependance to the initial conditions.
The new button "Refine using head points" in the edition window allows you to fix iteratively the registration: change the position manually, the run the automatic fit again. This solution can help you getting better registration results while we are working on an improved version of the automatic registration that would be less sensitive to the initial alignment.
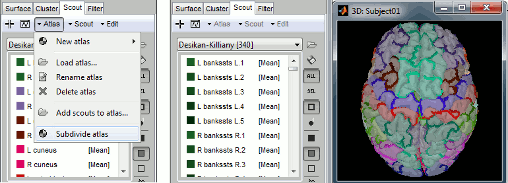
Subdivide scouts
The FreeSurfer atlases are now automatically imported in Brainstorm. They provide a good starting point for subdividing the cortex surface into anatomical regions, but the corresponding scouts can be too large for many functional applications. Averaging the time series from 600 different sources is likely to blur too much our data, we might lose the effects of interest. We are working subdividing efficiently the regions of those atlases. The first functions developed in this direction are the menus Subdivide atlas and Subdivide selected scouts in the Scout tab. They both perform a clustering of the existing scouts based on anatomical information.
December 2012
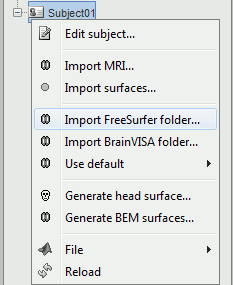
FreeSurfer and BrainVISA
Improvements were made for handling FreeSurfer and BrainVISA segmentations. Both software packages generate a tree of folders that contain all the intermediate steps of the reconstruction, the top folder being the subject name or id. It is now possible to import the entire segmentation folders with just one click. Additionally, new menus are available to generate head surfaces from the MRI.
More details: Freesurfer and BrainVISA.
Importing MRI masks
By "MRI masks", we refer to MRI volumes that contain either only 0 and 1 (binary mask) or integer values (labelled atlas). Both type of MRI masks can be imported directly:
as surfaces: Right-click on subject > Import surfaces > Select the file type "Volume mask (all MRI files)". The tesselation is generated automatically by Brainstorm. This works well only in the case of convex envelopes, it is not recommended for complex objects
as scouts: In the Scout tab, menu Atlas > Load atlas > Select the file type "Volume mask (all MRI files)". For each label in the volume, a scout is created, containing all the vertices that are in this region.
New file types supported
- GIfTI .gii surface files, used by default in BrainVISA
- Curry event files (.cef)
November 2012
Updated topography plots
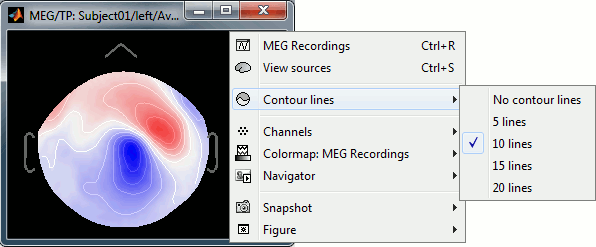
The rendering of the 2D topography plots is slightly improved, with a new option to set the number of contour lines.
New processes
Standardize > Uniform epoch time: Sets the same time vector for all the input files
Pre-process > Scale values: Multiply the values of one or several sensors by a fixed factor
Average > Average frequency bands: Average values across frequency bands
Extract > Measure from complex values: Apply a function to complex values (typically Morlet or Hilbert coefficients)
Miscelanous
- Processing of time-frequency decompositions of source files is now supported (including for the projection on a default anatomy)
- Copy-paste operations are extended to most of the files available in the database explorer
- All the keyboard shortcuts have been adapted for Mac systems
October 2012
New interface for the scouts
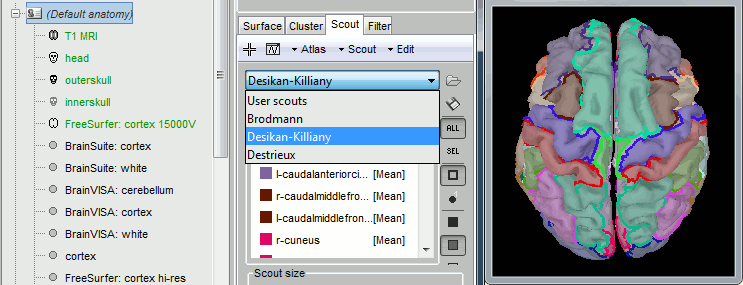
The scouts interface has been redesigned to integrated the logic of atlases, and the classification of each scout in an anatomical region. You are welcome to visit the following tutorials for more information:
?Tutorials/TutScouts
?Tutorials/LabelFreeSurfer
Project sources to an atlas
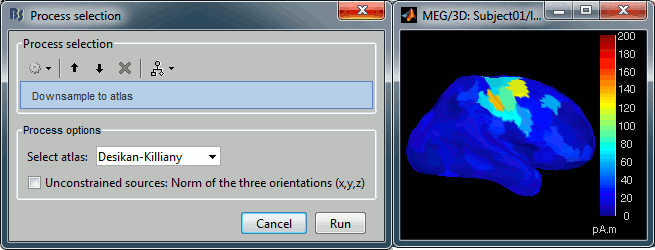
One of the main problems when dealing with source time series is the size of files. A new process lets you reduce the dimension of your sources by keeping only one value for each scout instead of one value for each vertex: Source > Downsample to atlas. It works well in the case of a set of scouts covering the entire cortex surface, either with a FreeSurfer atlas, or with a random clustering of the surface (menu Atlas>Surface clustering in the Scout tab).
September 2012
Support for Biosemi BDF files
Brainstorm can now import and review native BDF/BDF+ files from Biosemi.
Support for MANSCAN files
Brainstorm can now import and review native MANSCAN EEG files (SAM Technology, Microamp amplifiers): .mbi/.mb2
August 2012
Drive your Polhemus from Brainstorm
For accurate source localization in MEG and EEG with registration to anatomical MRI image volume and efficient head localization in MEG, a 3D digitization solution such as the Polhemus-Fastrak is required. This new, simple Brainstorm feature will help you save time and is efficient for error-checking while digitizing sensor positions and the subject's head shape. See the Digitize tutorial for more information.

June 2012
Graphical batching interface: final version
All the features available from the Brainstorm interface are now also available as "processes", including the import of the data, the artifact cleaning and the source estimation. A full analysis pipeline, starting from the raw continuous file, can be edited graphically and saved as a Matlab script, easy to read an edit. Those scripts can now run on distant servers without any user interaction.
The status of all the computations and the information messages that are generated during the execution of an batch script are now saved in detailed reports that can be reviewed as HTML pages, including screen captures of the data for quality control.
See the two tutorials: ?Processes and Automated processing.
April 2012
Matlab 2012a
The compiled version of Brainstorm is now based on Matlab 2012a. It provides more stability and fixes some issues with the Signal Processing Toolbox. However, if you were previously running the stand-alone version of Brainstorm, you may have to install a newer version of the Matlab Compiler Runtime. See the Installation page.
New processes
Events > Combine stim/response: Create new categories of events to group the markers by pairs (stimulus / response)
Standardize > Z-score with two sets of file in input:
Compute the variance s and average m of the baseline from files A,
Center on m and divide by s all the files B
March 2012
Frequency analysis
The interface for computing and displaying spectrum and time-frequency information has been largely improved. Two new types of windows are available, allowing the display of the time-frequency matrices as [time x amplitude] or [frequency x amplitude] graphs, for one given frequency or time. Four new processes are available, in the Frequency menu:
Fast Fourier Transform (FFT)
Power spectrum density (Welch)
Hilbert transform
Time-frequency (Morlet wavelets)
All those processes can run on any type of time series: recordings, sources, scouts.They all generate complex values, on which we need to apply a function to extract values that can be represented easily. This function can be changed easily after the computation, as a display parameter:
Power: Most common measure to represent the power of a signal for a given frequency bin
Magnitude: Energy of the signal for a frequency bin = sqrt(power)
Log: Convert to decibels (dB) = 10 * log10(power)
Phase: Extract the phase information for a given frequency bin = the angle of the complex value
Improvements made to the continuous viewer
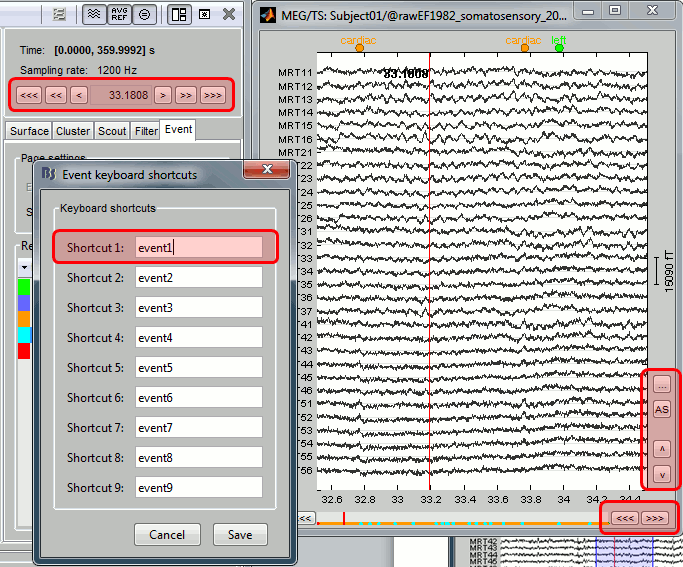
- User-defined keyboard shortcuts to create events (keys 1-9)
- New buttons and keyboard shortcuts to explore the time series
- Bug fix: Automatic positioning of the windows for MacOSX and Linux is now working
February 2012
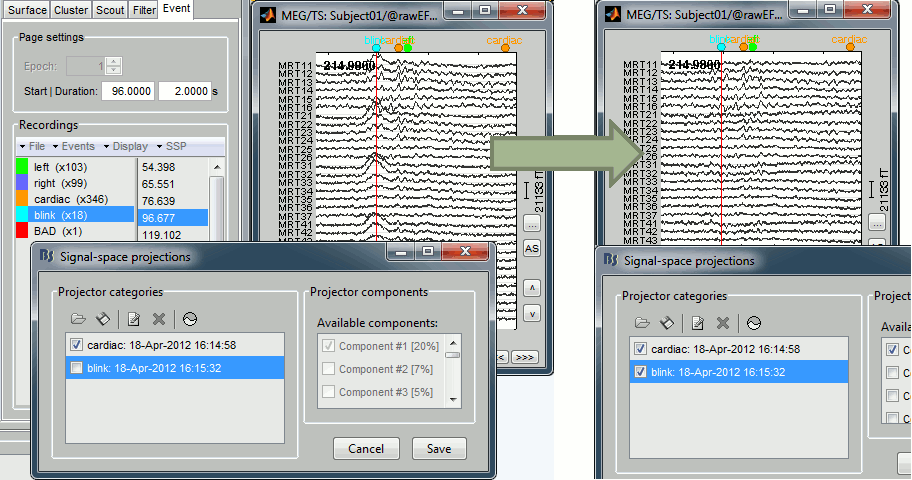
Artifact removal with SSP
The SSP projectors are now saved in a more sophisticated way, allowing a dynamic selection of the projectors to apply on the recordings.
Co-registration of MEG runs
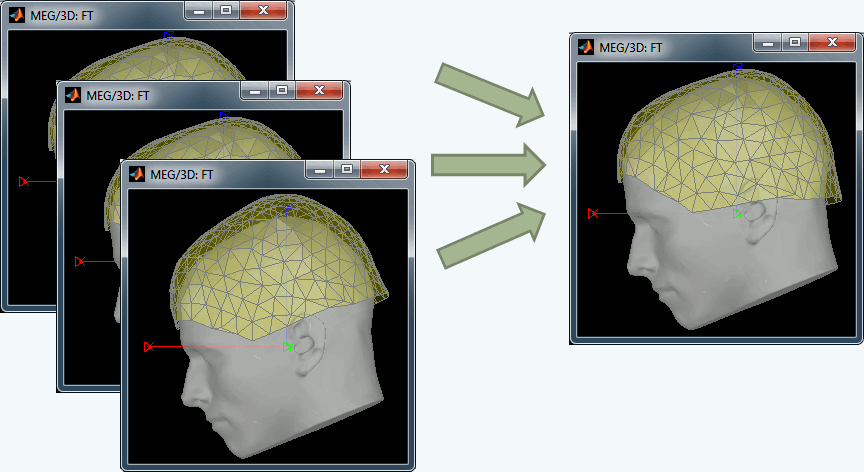
One of the problems related with the MEG analysis is that the subject's head can move with respect with the sensors during the acquisition. Hence, for the same subject, the position of a given sensor is different for two different runs or two different days of acquisition. We added a process (Standardize > Co-register MEG runs) to compensate for those head movements between acquisition runs, and register all the runs on one fixed head position. For now this process is limited to one head position per run, but we will soon work on using the continuous head localization information to compensate for the head movements at each time point.
Another issue with the data acquisition is the sensors selection: depending on the acquisition system or the day of acquisition, one may end up having lists of channels that do not match across runs or subjects. For instance: there were more auxiliary channels recorded for a few files, or different EEG amplifiers listed the electrodes in a different order. In those cases, it is very difficult to average or compare the information at the sensor level. The new process "Standardize > Uniform list of channels" fixes all those issues automatically by matching the sensors by name in the different files, and makes them compatible in terms on channel names and indices.
January 2012
Import FreeSurfer cortical parcellation
FreeSurfer is one of the many great academic software applications available to perform MRI image analysis. Brainstorm users can now use FreeSurfer to generate surface envelopes of head tissues to generate a model of MEG or EEG sources. Brainstorm now features the possibility to import the labels for regions of the cortex generated by FreeSurfer's analysis, which correspond to the regions of the Desikan-Killiany and Destrieux cortical parcellation atlases. The corresponding surface areas can subsequently be treated as scouts in Brainstorm, and therefore be used as anatomical ROIs to guide the exploration of MEG/EEG source maps.
See tutorial: Use FreeSurfer cortical parcellation
Import Nifti-compressed MRI images
We have added the possibility to import compressed Nifti MR images directly into Brainstorm's MRI Viewer and export MR volumes as Nifti.
Improved user interface for time series visualization
We have added new, convenient features to navigate through trials, time samples and files in your Brainstorm database. Buttons have been added to the main Brainstorm panel and also into the figure window that display time series: navigate through complex data structures with just a click! You can also adjust the amplitude gain using buttons now, or readily set the scale of time-series displays. As always, feedback is always welcome through our forum.
December 2011
Brainstorm on Facebook!
'Like Us' on Facebook to stay in touch: 
November 2011
New tools for artifact detection and correction
1) Specific channels can be scanned for automatic detection of ocular and cardiac artifacts from continuous recordings; this feature works best with dedicated control channels (i.e. ECG and EOG),
2) Artifact modeling and attenuation using a signal space projection (SSP) approach.
Stand-alone distribution for Linux and MacOSX
We introduced a new packaging logic for the distribution of Brainstorm executable (i.e., which does require the user to run a Matlab license). The entire set of application files (Matlab scripts and compiled executable) are now integrated in the same unique archive.
The executable is now platform (OS) independent as it has been reduced to a single .jar file created with Matlab's JavaBuilder, that runs on any platform supporting Matlab. To run the stand-alone version of Brainstorm, you just need to install the free, Matlab Compiler Runtime (version 7.16) foryour operating system.
Read more on the Installation page.
Brainstorm course in Montreal
Part of the Brainstorm development team has moved to theMcConnell Brain Imaging Center at McGill University's Montreal Neurological Institute, in Montreal, Canada. At this occasion, a full-day training session with 70 participants from across Canada has been organized for new users, back-to-back with the first MEG training workshop of the Canada MEG Consortium (see pictures here).
For more training opportunities, visit our Training pages.
May 2011
Brainstorm reference article
Publication of a special issue of the journal Computational Intelligence and Neuroscience:Academic Software Applications for Electromagnetic Brain Mapping Using MEG and EEG, co-edited bySylvain Baillet, Karl Friston & Robert Oostenveld. We encourage Brainstorm users to cite this reference in their publications featuring analyses performed using Brainstorm (see How to cite Brainstorm).
Tadel F, Baillet S, Mosher JC, Pantazis D, Leahy RM (2011) Brainstorm: A User-Friendly Application for MEG/EEG Analysis, Computational Intelligence and Neuroscience, vol. 2011, Article ID 879716, 13 pages, 2011. doi:10.1155/2011/879716,pdf]
Improvements in navigating the database
The file manager has been extended to support drag-and-drop and copy-paste operations. Users can now move or copy easily files from a condition or subject entry to another using the mouse, keyboard shortcuts [CTRL+C (copy), CTRL+X (cut) and CTRL+V (paste)], or the File section from the contextual menus from the GUI.
No MRI for your participants?
No worries: Brainstorm can adjust a template anatomy to individual scalp points (MEG) / electrode locations (EEG).
It is now possible to generate pseudo-individual anatomies from a template, for participants for whom the anatomical MRI volume is not available. This operation is possible if digitized head (scalp) points were acquired using a tracking system (e.g., Polhemus Isotrak), which is commonplace in most MEG labs. The default anatomy (volume and surface envelopes) distributed with Brainstorm (MNI/Colin27) can be transformed (warped) to match the subject's scalp points. This is a great cost-saving alternative when individual anatomy is not accessible to investigators (not recommended for accurate, local mapping of the loci of activity though).
See tutorial: Warping default anatomy.
Refine MRI/MEG registration automatically using digitized scalp points
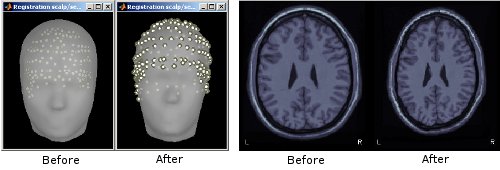
When importing MEG recordings, the registration between the MRI volume and the MEG was formerly based only on three fiducial points only (nasion, left ear, right ear). This approach is known be potentially of poor accuracy. If multiple (>60, typically) scalp points were digitized, the transformation between the MEG's and the MRI's referential can be refined by minimizing the average distance between the scalp surface obtained from MRI and the actual digitized head points. This operation is performed automatically in Brainstorm.
See tutorial: Review raw recordings.
April 2011
Realistic boundary-element-modeling (BEM) head models for EEG
A new feature has been made available for a more accurate computation of EEG forward models with realistic geometry (strongly recommended). OpenMEEG generates forward models using a symmetric boundary element method that was developed by the INRIA team ATHENA. It considers three realistic layers (scalp, inner skull, outer skull), which can all be generated from the MRI volume using Brainstorm.
See tutorial: BEM head model.

Source estimation in full brain volume
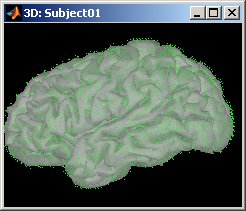
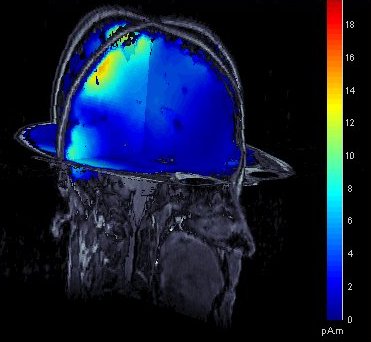
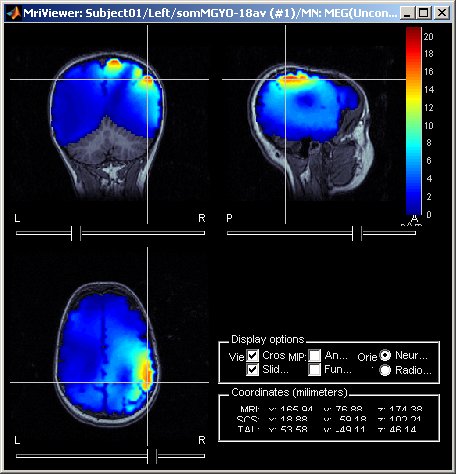
Source models computed in Brainstorm were until now restricted to the cortical surface. To extend the range of analyses made possible with Brainstorm, and to compare Brainstorm's source estimates with those obtained using other software, source models based on dipole grids sampling the entire brain volume can be obtained and reviewed, using the same efficient tools featured in Brainstorm. See tutorial: Volume source estimation.
March 2011
Combined MEG/EEG source reconstruction
The approach to combine concurrent MEG and EEG recordings to obtain a joint source model has been substantially improved.
Display of source maps in MRI volume
Added multiple options to review and visualize source maps using contact sheets and volume smoothing of activity maps. 1) source maps are spatially smoothed after interpolation in the MRI voxels. The size of the smoothing kernel can be configured: right-click on the figure > MRI display; 2) the resulting volumes can be used to create contact sheets along all viewing directions, either in time or across the volume.
See tutorial: ?Source estimation.
December 2010
Statistical inference: correction for multiple comparisons
When displaying the outcome of a t-test, there is now a new tab "stat" that is shown in the main window, which allows to adjust dynamically the type of correction applied to multiple comparisons and the p-value of the test.
Graphical batching interface
A brand new version of the "Process" tab is available. Processing pipelines can now be elaborated in a convivial way, in just a few clicks! You can also save and export your pipeline as Matlab scripts. The processes available are now written as plug-ins: you can contribute your own process and it will list automatically to your menu of available tasks that can be performed on data.
See tutorial: ?Processes.
September 2010
Continuous/RAW file viewer and event editor
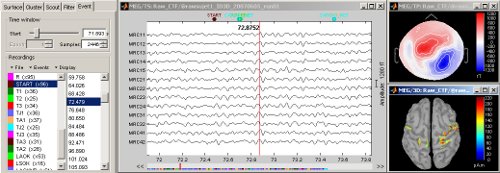
Brainstorm can now be used to visualize and process full length continuous/raw files in native format. See tutorial: ?Review raw recordings and edit markers.
Detection of bad trials / bad channels
New process available to detect bad trials or bad trials based on peak-to-peak values. The peak-to-peak threshold can be set by channel type.
Estimation of the noise covariance from continuous files
The interface that computes the noise covariance matrix can be called on continuous recordings. Right-click on link to raw file > Noise covariance.
Import/export protocols and subjects
New menus to help users exchange data easily. A full protocol can be exported as a single zip file (menu File > Export protocol), and then imported in another database (menu File > Load protocol > Load from .zip file). Same thing for a single subject: right-click on the subject > File > Export subject. The subject .zip file is actually a full protocol zip file with only the exported subject, hence it should be loaded as a protocol.
June 2010
Time-frequency
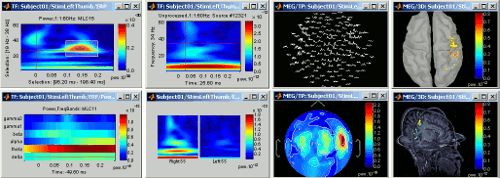
Computation and visualization of time-frequency decompositions of MEG/EEG and source signals using Morlet wavelets. See tutorial: ?Time-frequency.
Brodmann and Tzourio-Mazoyer atlases
Two lists of scouts have been created for the default anatomy (MNI/Colin27), inspired from the atlases of Tzourio-Mazoyer and Brodmann. To access those files: display the cortex surface of the default anatomy, then in the "Scout" tab click on the "Load scouts" button, on the right of the scouts list.
Recordings visualization: 2D Layout
The 2D Layout display for recordings has been re-writen to include many tools: sensors selection, interactive gain change, zoom in time and space... See tutorial: ?Exploring the recordings.
March 2010
Support for Xfit dipoles files
Dipoles localizations from the Neuromag Xfit software can be imported in Brainstorm database and displayed on the same figures as Brainstorm cortical maps. See tutorial: ?Import and visualize dipoles.
Minimum norm solution
Integration of a new minimum norm solution, with more and better tuned parameters. This algorithm is now similar to the one implemented in MNE software.
Januray 2010
Project sources on default anatomy
Any source file estimated for a given surface can be re-projected on another surface. This allows to project sources of individual subjects on the default anatomy to compare subjects. See tutorial: Project sources on default anatomy.
Display channels in columns
The time series can be displayed in columns. The displayed sensors can be edited with an interface similar to the selection editor in MNE software.
December 2009
Automatic updates
Brainstorm is now self-updating. It tests at each startup if your version is older than a month; if so, it downloads a new version. The software can also be updated manually very easily (menu Help > Update Brainstorm).

