|
Size: 12850
Comment:
|
Size: 10211
Comment:
|
| Deletions are marked like this. | Additions are marked like this. |
| Line 1: | Line 1: |
| = Tutorial 11: Detecting artifacts = ''Authors: Francois Tadel, Elizabeth Bock, John C Mosher, Sylvain Baillet'' |
= Tutorial 12: Artifact detection = ''Authors: Francois Tadel, Elizabeth Bock, Sylvain Baillet'' |
| Line 4: | Line 4: |
| The previous tutorial illustrated how to remove noise patterns occurring continuously and at specific frequencies. However, most of the events that contaminate the EEG/MEG recordings are not permanent, span over a large frequency range or overlap with the frequencies of the brain signals of interest. Frequency filters are not appropriate to correct for eye movements, breathing movements, heartbeats or other muscle activity. | The previous tutorial illustrated how to remove noise patterns occurring continuously and at specific frequencies. However, most of the events that contaminate the MEG/EEG recordings are not permanent, span over a large frequency range or overlap with the frequencies of the brain signals of interest. Frequency filters are not appropriate to correct for eye movements, breathing movements, heartbeats or other muscle activity. |
| Line 6: | Line 6: |
| Other approaches exist to correct for those artifacts, based on the spatial signature of the artifacts. If an event is very reproducible and always occurs at the same place (such as the eye blinks and heartbeats), the sensors will always record the same values when it occurs. We can identify the topographies corresponding to this artifact (ie spatial distributions of values at one time point) and remove them from the recordings. This spatial decomposition and filtering is the basic idea behind two widely used approaches: the SSP (Signal-Space Projection) and ICA (Independent Component Analysis) methods. We will describe those approaches in the next tutorial. The SSP method is based on the spatial decomposition of a selection of artifacted |
For getting rid of reproducible artifacts, one popular approach is the Signal-Space Projection (SSP). This method is based on the spatial decomposition of the MEG/EEG recordings for a selection of time samples during which the artifact is present. Therefore we need to identify when each type of artifact is occurring in the recordings. This tutorial shows how to detect automatically some well defined artifacts: the blinks and the heartbeats. |
| Line 12: | Line 10: |
| = From Walkthrough = . o Open MEG sensors, '''CTF LT''' (double-click) |
== Observation == Let's start by observing the type of contamination the blinks and heartbeats cause to the MEG recordings. |
| Line 15: | Line 13: |
| . § Add view of '''EOG''': Right-click on Link > EOG > Display time series | * '''Run #01''': Double-click on the link to show the MEG sensors. * '''Configuration''': Page of '''3 seconds''', view in columns, selection of the "'''CTF LT'''" sensors (the left-temporal sensors will be a good example to show at the same time the two types of artifacts). * '''EOG''': Right-click on the link > EOG > Display time series. Two channels are classified as EOG: * '''VEOG''': Vertical electrooculogram (two electrodes placed below and above one eye) * '''HEOG''': Horizontal electrooculogram (two electrodes placed on the temples of the subject) * On those traces, there is not much happening for most of the recordings except for a few bumps. This subject is sitting very still and not blinking much. We can expect MEG recordings of a very good quality. * '''ECG''': Right-click on the link > ECG > Display time series.<<BR>>The electrocardiogram was recorded with a bipolar montage of electrodes across the chest. You can recognize the typical shape of the electric activity of the heart (P, QRS and T waves). * '''Find a blink''': Scroll through the recordings using the '''F3''' shortcut until you see a large blink. * Remember you can change the amplitude scale with many shortcuts (eg. right-click + move). * To keep the scale fixed between two pages: Uncheck the button [AS] (auto-scale). * For instance, you can observe a nice blink at 20.8s (red cursor in the screen capture below). * On the same page, you should be able to observe the contamination due to a few heartbeats, corresponding to the peaks of the ECG signal (eg. 19.8s, shown as a blue selection below). * The additional data channels (ECG and EOG) contain precious information that we can use for the automatic detection of the blinks and heartbeats. We strongly recommend that you always record these signals during your own experiments, it helps a lot with the data pre-processing. <<BR>><<BR>> {{attachment:observe.gif||height="271",width="662"}} |
| Line 17: | Line 27: |
| § Add view of '''ECG''': Right-click on Link > EOG > Display time series | == Detection: Heartbeats == In the Record tab, select the menu: '''"Artifacts > Detect heartbeats"'''. |
| Line 19: | Line 30: |
| o Layout menu: Alternate between Tiled and Weighted (keep ''' Weighted''') | * It opens automatically the pipeline editor, with the process "Detect heartbeats" selected. * '''Channel name''': Name of the channel that is used to perform the detection. Select "'''ECG'''". * '''Time window''': Time range that the algorithm should scan for amplitude peaks. Leave the default values to process the entire file, or check the option '''[All file]'''. * '''Event name''': Name of the event group created for saving the detected events. Enter "'''cardiac'''".<<BR>><<BR>> {{attachment:detect_ecg.gif||height="254",width="549"}} * Click on Run. After the process stops, you can see a new event category "'''cardiac'''". The 464 heartbeats for 360s of recordings indicate an average heart rate of 77bpm, everything looks normal. * You can check a few of them, to make sure the "cardiac" markers really indicate the ECG peaks, and that there are not too many peaks that are skipped.<<BR>><<BR>> {{attachment:detect_ecg_done.gif||height="127",width="517"}} |
| Line 21: | Line 37: |
| o Scrolling for blinks: '''__20.8s__''' (In this window, observe cardiac and ocular artifacts) | == Detection: Blinks == Now do the same thing for the blinks: Menu "'''Artifacts > Detect eye blinks'''". |
| Line 23: | Line 40: |
| o SSP > Detect heartbeats > ECG | * Channel name: '''VEOG''' * Time window: '''All file''' * Event name: '''Blink''' <<BR>><<BR>> {{attachment:detect_eog.gif||height="257",width="550"}} * Run, then look quickly at the 15 detected blinks (shortcut: Shift+Right arrow). <<BR>><<BR>> {{attachment:detect_eog_done.gif||height="130",width="535"}} |
| Line 25: | Line 45: |
| o SSP > Detect eye blinks > VEOG | == Remove simultaneous blinks/heartbeats == We will use these event markers as the input to our SSP cleaning method. This technique works well if each artifact is defined precisely and as independently as possible from the other artifacts. This means that we should try to avoid having two different artifacts marked at the same time. |
| Line 27: | Line 48: |
| o SSP > Remove simultaneous > cardiac / blink / 250ms | Because the heart beats every second or so, there is a high chance that when the subject blinks there is a heartbeat not too far away in the recordings. We cannot remove all the blinks that are contaminated with a heartbeat because we would have no data left. But we have a lot of heartbeats, so can do the contrary: remove the markers "cardiac" that are occurring during a blink. |
| Line 29: | Line 50: |
| o SSP > Compute SSP: Heartbeats ('''Do __not__ use existing SSP''') § Display 2D topography for the first spatial component (clearly a heartbeat) § Select component #1: It is clearly a cardiac component § Show the influence of the projector on the sensors LT | In the Record tab, select the menu "'''Artifacts > Remove ''''''simultaneous'''". Set the options: |
| Line 31: | Line 52: |
| o SSP > Compute SSP: Eye blinks ('''Do __not__ use existing SSP''') § Display the 2D topography for the first spatial component (clearly a blink) § Show the influence of the projector on the sensors LT | * Remove events named: "'''cardiac'''" * When too close to events: "'''blink'''" * Minimum delay between events: '''250ms''' <<BR>><<BR>> {{attachment:detect_simult.gif||height="257",width="550"}} |
| Line 33: | Line 56: |
| o Load additional bad segments: File > Add events from file > '''events_bad_01.mat<<BR>> '''> File format: Brainstorm (events*.mat) o Close all, save modifications | After executing this process, the number of "cardiac" events goes from '''464''' to '''455'''. The deleted heartbeats were all less than 250ms away from a blink. |
| Line 35: | Line 58: |
| = From Auditory = Restore view: 3s, CTF LT |
== Run #02: Running from a script == Let's perform the same detection operations on '''Run #02''', using this time the '''Process1''' box. |
| Line 38: | Line 61: |
| == Heartbeats and eye blinks == * Select the two AEF runs in the Process1 box. * Select successively the following processes, then click on [Run]: * '''Events > Detect heartbeats:''' Select channel '''ECG''', check "All file", event name "cardiac". * '''Events > Detect eye blinks:''' Select channel '''VEOG''', check "All file", event name "blink". * '''Events > Remove simultaneous''': Remove "'''cardiac'''", too close to "'''blink'''", delay '''250ms'''. |
* Close everything with the [X] button at the top-right corner of the Brainstorm window. * Select the run '''AEF #02''' in the Process1 box, then select the following processes: * '''Events > Detect heartbeats:''' Select channel '''ECG''', check "All file", event name "cardiac". * '''Events > Detect eye blinks:''' Select channel '''VEOG''', check "All file", event name "blink". * '''Events > Remove simultaneous''': Remove "'''cardiac'''", too close to "'''blink'''", delay '''250ms'''.<<BR>><<BR>> {{attachment:detect_script.gif||height="286",width="506"}} * Open the Run#02 recordings (MEG+EOG+ECG) and verify that the detection worked as expected. You should get '''472 cardiac''' events and '''19 blink''' events. |
| Line 45: | Line 68: |
| = From continuous = == Identify the artifacts == The first step is to identify several repetitions of the artifact (the vectors '''b'''<<HTML(<sub>)>>''1''<<HTML(</sub>)>>...'''b'''<<HTML(<sub>)>>''m''<<HTML(</sub>)>>). We need to set markers in the recordings that indicate when the events that we want to correct for occur. To help with this task, it is recommended to always record with bipolar electrodes the activity of the eyes (electro-oculogram or EOG, vertical and horizontal), the heart (electro-cardiogram or ECG), and possibly other sources of muscular contaminations (electromyogram or EMG). In this example, we are going to use the ECG and vertical EOG traces to mark the cardiac activity and the eye blinks. Two methods can be used, manual or automatic. |
<<TAG(Advanced)>> |
| Line 49: | Line 70: |
| === EOG/ECG channels === * Select the protocol '''TutorialRaw''' created in the previous tutorial, and select the "Functional data" view (second button in the toolbar on top of the database explorer). * Double-click on the '''clean''' continuous recordings ("'''Raw | notch(60Hz 120Hz 180Hz)'''") to open the MEG recordings. * Set the length of the reviewed time window to '''3 seconds''' (in the Record tab, text box "Duration") * Right-click on the continuous recordings again > '''Misc > Display time series'''. |
== Custom detection == Those two processes "Detect heartbeats" and "Detect eye blinks" are in reality shortcuts for a generic process "'''Detect custom events'''". This process can be used for detecting any kind of event based on the signal power in a specific frequency band. We are not going to use it here, but you may have to use it if the standard parameters do not work well, or for detecting other types of events. |
| Line 55: | Line 73: |
| . {{http://neuroimage.usc.edu/brainstorm/Tutorials/TutRawSsp?action=AttachFile&do=get&target=tsMisc.gif|tsMisc.gif|height="148",width="577",class="attachment"}} * In this file the channel type "'''Misc'''" groups the two channels '''EEG057 '''('''ECG''', in green) and '''EEG058 '''('''vertical EOG''', in red). This configuration depends on the acquisition setup, and can be redefined afterwards in Brainstorm (right-click on the channel file > Edit channel file, and then change manually the string in the column Type for any channel). * Use the shortcuts introduced in the previous tutorial to adjust the vertical scale of this display: Shift+mouse wheel, +/- keys, or the buttons on the right side of the figure. * Then go further in time to see what is happening on those channels over the time: use the "'''>>>'''" buttons, or the associated shortcuts (read the tooltips of the button) * '''ECG''': On the green trace, you can recognize the very typical shape of the electric activity of the heart (P, QRS and T waves). This is a very good example, the signal is not always that clean. * '''EOG''': On the red trace, there is not much happening for most of the recordings except for a few bumps, typical of eye blinks, eg. at 33.590s. This subject is sitting very still and not blinking much. We can expect MEG recordings of a very good quality. * You can observe the contamination from a blink on the left-frontal sensors: move to '''33.590s''' (you can use the text boxes in the time panel, the Record tab, or the scrollbar in the figure), and select a subset of sensors (Shift+B, or right-click on the figure > Display setup > CTF LF) |
* The signal to analyze is read from the continuous file (options "Channel name" and "Time window"). * '''Frequency band''': The signal is filtered in a frequency band where the artifact is easy to detect. For EOG: 1.5-15Hz ; for ECG: 10-40Hz. * '''Threshold''': An event of interest is detected if the absolute value of the filtered signal value goes over a given number of times the standard deviation. For EOG: 2xStd, for ECG: 4xStd * '''Minimum duration between two events''': If the filtered signal crosses the threshold several times in relation with the same artifact (like it would be the case for muscular activity recordings on an EMG channel), we don't want to trigger several events but just one at the beginning of the activity. This parameter would indicate the algorithm to take only the maximum value over the given time window; it also prevents from detecting other events immediately after a successful detection. For the ECG, this value is set to 500ms, because it is very unlikely that the heart rate of the subject goes over 120 beats per minute. * '''Ignore the noisy segments''': If this option is selected, the detection is not performed on the segments that are much noisier than the rest of the recordings. * '''Enable classification''': If this option is selected, the events are classified by shape in different categories, based on correlation measure. In the end, only the categories that have more than 5 occurrences are kept, all the other successful detections are ignored. <<BR>><<BR>> {{attachment:detect_custom.gif||height="435",width="313"}} |
| Line 63: | Line 80: |
| . {{http://neuroimage.usc.edu/brainstorm/Tutorials/TutRawSsp?action=AttachFile&do=get&target=megEog.gif|megEog.gif|height="265",width="475",class="attachment"}} | <<TAG(Advanced)>> |
| Line 65: | Line 82: |
| === Manual marking === Create a new category of markers "'''blink_manual'''", using the menu Events > Add group. Select this new group. Review the file, and mark the peaks you observe on the vertical EOG trace, using the '''Ctrl+E''' keyboard shortcut. Do that for a few eye blinks. |
== In case of failure == If the signals are not as clean as in this sample dataset, the automatic detection of the heartbeats and blinks may fail with the standard parameters. You may have to use the process "Detect custom events" and adjust some parameters. For instance: |
| Line 68: | Line 85: |
| {{http://neuroimage.usc.edu/brainstorm/Tutorials/TutRawSsp?action=AttachFile&do=get&target=markEog.gif|markEog.gif|height="174",width="496",class="attachment"}} | * If nothing is detected: decrease the amplitude threshold, or try to adjust the frequency band. * If too many events are detected: increase the amplitude threshold or the minimum duration between two events. * If too many categories of events are generated, and you have a very little number of events in the end: disable the classification. * To find the optimal frequency band for an artifact, you can open the recordings and play with the online band-pass filters in the Filter tab. Keep the band that shows the highest amplitude peaks. |
| Line 70: | Line 90: |
| You could repeat the same operation for all the blinks, then for all the ECG peaks and jump to the next chapter of the tutorial and compute the SSP. It would be uselessly time consuming, as there is a process that does it for you automatically. However, it is good to remember how to do it manually because you may face some cases where you don't have clean ECG/EOG, or if you want to correct for another type of artifact. | If you cannot get your artifacts to be detected automatically, you can browse through the recordings and mark all the artifacts manually, as explained in the tutorial [[Tutorials/EventMarkers|Event markers]]. |
| Line 72: | Line 92: |
| === Automatic detection: EOG === In the Record tab, select the menu: '''SSP > Detect eye blinks'''. It opens automatically the pipeline editor, with the process "Detect eye blinks" selected: |
== Additional documentation == * Related tutorial: [[Tutorials/MovementDetect|Detect subject movements]] |
| Line 75: | Line 95: |
| * '''Channel name''': Name of the channel that is used to perform the detection. Select or type "'''EEG058'''" as it is the name of the EOG channel * '''Time window''': Time range that the algorithm should scan for the selected artifact. Leave the default values to process the entire file. * '''Event name''': Name of the event group that is created for saving all the detected events. Leave the default "blink". {{http://neuroimage.usc.edu/brainstorm/Tutorials/TutRawSsp?action=AttachFile&do=get&target=sspMenu.gif|sspMenu.gif|class="attachment"}} {{http://neuroimage.usc.edu/brainstorm/Tutorials/TutRawSsp?action=AttachFile&do=get&target=detectEog.gif|detectEog.gif|height="232",width="334",class="attachment"}} Click on Run. After the process stops, you can see two new event categories "'''blink'''" and "'''blink2'''" in the Record tab. You can review a few of them, to make sure that they really indicate the EOG events. In the Record tab, click on the "blink" event category, then on a time occurrence to jump to it in the MEG and Misc time series figures. Two types of events are created because this algorithm not only detects specific events in a signal, it also classifies them by shape. If you go through all the events that were detected in the two categories, you would see that the "blink" are all round bumps, typical of the '''eye blinks'''. In the category "blink2", the morphologies don't look as uniform; it mixes small blinks, and ramps or step functions followed by sharp drops that could indicate '''eye saccades'''. The saccades can be observed on the vertical EOG, but if you want a better characterization of them you should also record the horizontal EOG. The detection of the saccades should be performed with a different set of parameters, using the process "Detect custom events", introduced later in this chapter. {{http://neuroimage.usc.edu/brainstorm/Tutorials/TutRawSsp?action=AttachFile&do=get&target=detectEogDone.gif|detectEogDone.gif|class="attachment"}} === Automatic detection: ECG === Now do the same thing for the heartbeats. In the Record tab, select the menu "'''SSP > Detect heartbeats'''". Configure the process to use the channel '''EEG057''' (name of the ECG channel), and leave the other options to the default values. {{http://neuroimage.usc.edu/brainstorm/Tutorials/TutRawSsp?action=AttachFile&do=get&target=sspMenu1.gif|sspMenu1.gif|class="attachment"}} {{http://neuroimage.usc.edu/brainstorm/Tutorials/TutRawSsp?action=AttachFile&do=get&target=detectEcg.gif|detectEcg.gif|height="228",width="330",class="attachment"}} Click on Run. After the process stops, you can see a new event category "'''cardiac'''" in the Record tab, with 346 occurrences. You can check a few of them, to make sure that the "cardiac" markers really indicate the ECG peaks, and that there are not too many peaks that are skipped. {{http://neuroimage.usc.edu/brainstorm/Tutorials/TutRawSsp?action=AttachFile&do=get&target=detectEcgDone.gif|detectEcgDone.gif|class="attachment"}} === Automatic detection: Custom === Those two previous processes are shortcuts for a generic process "'''Detect custom events'''". We are not going to use it here, but it is interesting to introduce it to understand how the blinks and heartbeats detection work. The logic is the following: * The channel to analyze is read from the continuous file, for a given time window. * '''Frequency band''': The signal is filtered in a frequency band where the artifact is easy to detect. For EOG: 1.5-15Hz ; for ECG: 10-40Hz. * '''Threshold''': An event of interest is detected if the absolute value of the filtered signal value goes over a given number of times the standard deviation. For EOG: 2xStd, for ECG: 4xStd * '''Minimum duration between two events''': If the filtered signal crosses the threshold several times in relation with the same artifact (like it would be the case for muscular activity recordings on an EMG channel), we don't want to trigger several events but just one at the beginning of the activity. This parameter would indicate the algorithm to take only the maximum value over the given time window; it also prevents from detecting other events immediately after a successful detection. For the ECG, this value is set to 500ms, because it is very unlikely that the heart rate of the subject goes over 120 beats per minute. * '''Ignore the noisy segments''': If this option is selected, the detection is not performed on the segments that are much noisier than the rest of the recordings. * '''Enable classification''': If this option is selected, the events are classified by shape, based on correlation measure. In the end, only the categories that have more than 5 occurrences are kept, all the other successful detections are ignored. {{http://neuroimage.usc.edu/brainstorm/Tutorials/TutRawSsp?action=AttachFile&do=get&target=detectCustom.gif|detectCustom.gif|height="459",width="329",class="attachment"}} == Additional information == * Elekta: jumps in the sensors * McGill guidelines * SSP cookbook <<EmbedContent("http://neuroimage.usc.edu/bst/get_prevnext.php?prev=Tutorials/ArtifactsFilter&next=Tutorials/ArtifactsSsp")>> |
<<EmbedContent("http://neuroimage.usc.edu/bst/get_prevnext.php?prev=Tutorials/BadChannels&next=Tutorials/ArtifactsSsp")>> |
Tutorial 12: Artifact detection
Authors: Francois Tadel, Elizabeth Bock, Sylvain Baillet
The previous tutorial illustrated how to remove noise patterns occurring continuously and at specific frequencies. However, most of the events that contaminate the MEG/EEG recordings are not permanent, span over a large frequency range or overlap with the frequencies of the brain signals of interest. Frequency filters are not appropriate to correct for eye movements, breathing movements, heartbeats or other muscle activity.
For getting rid of reproducible artifacts, one popular approach is the Signal-Space Projection (SSP). This method is based on the spatial decomposition of the MEG/EEG recordings for a selection of time samples during which the artifact is present. Therefore we need to identify when each type of artifact is occurring in the recordings. This tutorial shows how to detect automatically some well defined artifacts: the blinks and the heartbeats.
Contents
Observation
Let's start by observing the type of contamination the blinks and heartbeats cause to the MEG recordings.
Run #01: Double-click on the link to show the MEG sensors.
Configuration: Page of 3 seconds, view in columns, selection of the "CTF LT" sensors (the left-temporal sensors will be a good example to show at the same time the two types of artifacts).
EOG: Right-click on the link > EOG > Display time series. Two channels are classified as EOG:
VEOG: Vertical electrooculogram (two electrodes placed below and above one eye)
HEOG: Horizontal electrooculogram (two electrodes placed on the temples of the subject)
- On those traces, there is not much happening for most of the recordings except for a few bumps. This subject is sitting very still and not blinking much. We can expect MEG recordings of a very good quality.
ECG: Right-click on the link > ECG > Display time series.
The electrocardiogram was recorded with a bipolar montage of electrodes across the chest. You can recognize the typical shape of the electric activity of the heart (P, QRS and T waves).Find a blink: Scroll through the recordings using the F3 shortcut until you see a large blink.
- Remember you can change the amplitude scale with many shortcuts (eg. right-click + move).
- To keep the scale fixed between two pages: Uncheck the button [AS] (auto-scale).
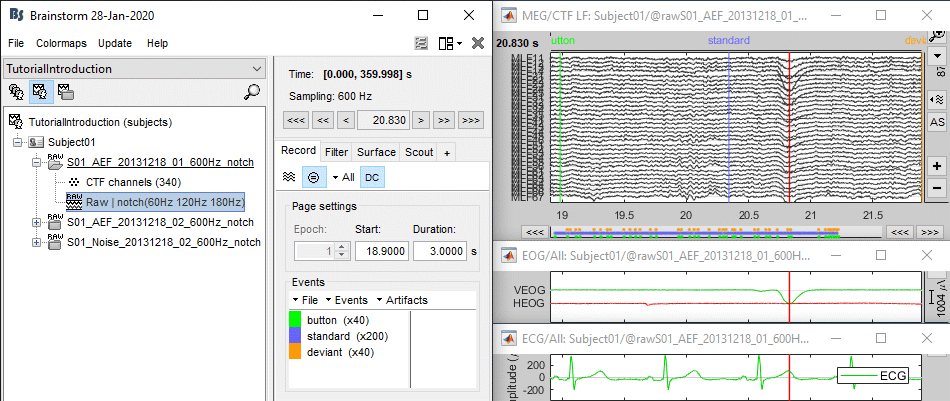
- For instance, you can observe a nice blink at 20.8s (red cursor in the screen capture below).
- On the same page, you should be able to observe the contamination due to a few heartbeats, corresponding to the peaks of the ECG signal (eg. 19.8s, shown as a blue selection below).
The additional data channels (ECG and EOG) contain precious information that we can use for the automatic detection of the blinks and heartbeats. We strongly recommend that you always record these signals during your own experiments, it helps a lot with the data pre-processing.
Detection: Heartbeats
In the Record tab, select the menu: "Artifacts > Detect heartbeats".
- It opens automatically the pipeline editor, with the process "Detect heartbeats" selected.
Channel name: Name of the channel that is used to perform the detection. Select "ECG".
Time window: Time range that the algorithm should scan for amplitude peaks. Leave the default values to process the entire file, or check the option [All file].
Event name: Name of the event group created for saving the detected events. Enter "cardiac".
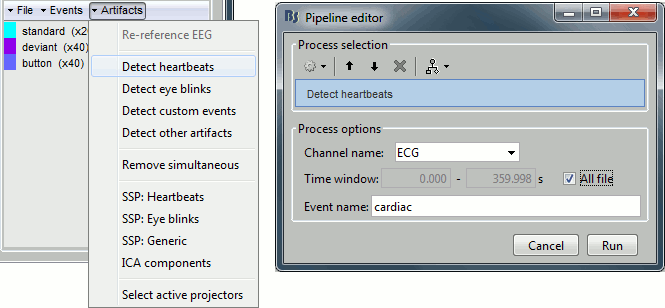
Click on Run. After the process stops, you can see a new event category "cardiac". The 464 heartbeats for 360s of recordings indicate an average heart rate of 77bpm, everything looks normal.
You can check a few of them, to make sure the "cardiac" markers really indicate the ECG peaks, and that there are not too many peaks that are skipped.

Detection: Blinks
Now do the same thing for the blinks: Menu "Artifacts > Detect eye blinks".
Channel name: VEOG
Time window: All file
Event name: Blink
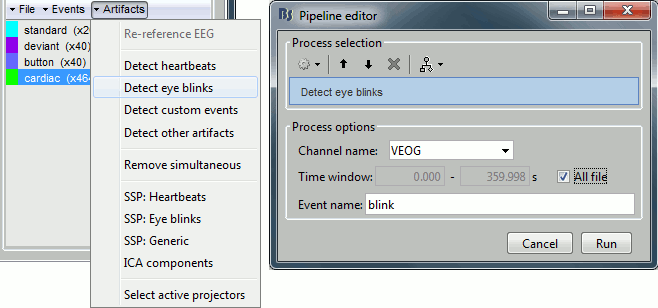
Run, then look quickly at the 15 detected blinks (shortcut: Shift+Right arrow).

Remove simultaneous blinks/heartbeats
We will use these event markers as the input to our SSP cleaning method. This technique works well if each artifact is defined precisely and as independently as possible from the other artifacts. This means that we should try to avoid having two different artifacts marked at the same time.
Because the heart beats every second or so, there is a high chance that when the subject blinks there is a heartbeat not too far away in the recordings. We cannot remove all the blinks that are contaminated with a heartbeat because we would have no data left. But we have a lot of heartbeats, so can do the contrary: remove the markers "cardiac" that are occurring during a blink.
In the Record tab, select the menu "Artifacts > Remove simultaneous". Set the options:
Remove events named: "cardiac"
When too close to events: "blink"
Minimum delay between events: 250ms
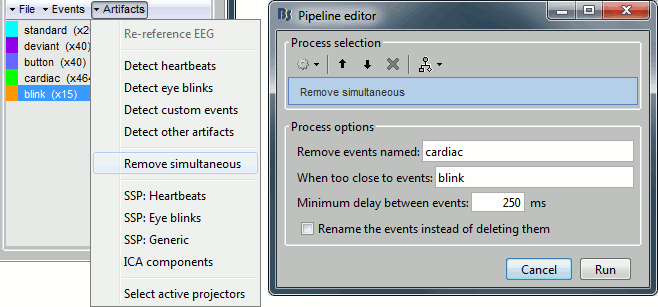
After executing this process, the number of "cardiac" events goes from 464 to 455. The deleted heartbeats were all less than 250ms away from a blink.
Run #02: Running from a script
Let's perform the same detection operations on Run #02, using this time the Process1 box.
- Close everything with the [X] button at the top-right corner of the Brainstorm window.
Select the run AEF #02 in the Process1 box, then select the following processes:
Events > Detect heartbeats: Select channel ECG, check "All file", event name "cardiac".
Events > Detect eye blinks: Select channel VEOG, check "All file", event name "blink".
Events > Remove simultaneous: Remove "cardiac", too close to "blink", delay 250ms.
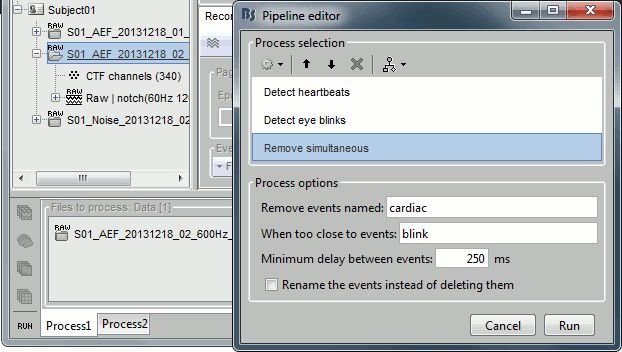
Open the Run#02 recordings (MEG+EOG+ECG) and verify that the detection worked as expected. You should get 472 cardiac events and 19 blink events.
Custom detection
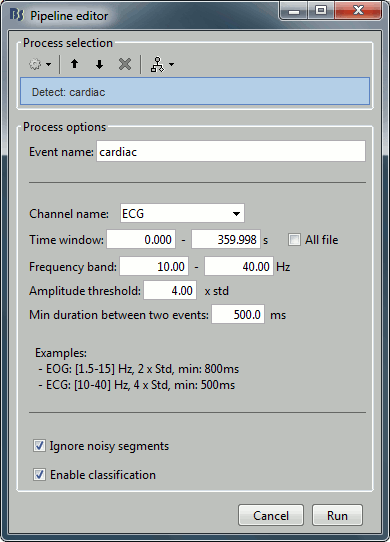
Those two processes "Detect heartbeats" and "Detect eye blinks" are in reality shortcuts for a generic process "Detect custom events". This process can be used for detecting any kind of event based on the signal power in a specific frequency band. We are not going to use it here, but you may have to use it if the standard parameters do not work well, or for detecting other types of events.
- The signal to analyze is read from the continuous file (options "Channel name" and "Time window").
Frequency band: The signal is filtered in a frequency band where the artifact is easy to detect. For EOG: 1.5-15Hz ; for ECG: 10-40Hz.
Threshold: An event of interest is detected if the absolute value of the filtered signal value goes over a given number of times the standard deviation. For EOG: 2xStd, for ECG: 4xStd
Minimum duration between two events: If the filtered signal crosses the threshold several times in relation with the same artifact (like it would be the case for muscular activity recordings on an EMG channel), we don't want to trigger several events but just one at the beginning of the activity. This parameter would indicate the algorithm to take only the maximum value over the given time window; it also prevents from detecting other events immediately after a successful detection. For the ECG, this value is set to 500ms, because it is very unlikely that the heart rate of the subject goes over 120 beats per minute.
Ignore the noisy segments: If this option is selected, the detection is not performed on the segments that are much noisier than the rest of the recordings.
Enable classification: If this option is selected, the events are classified by shape in different categories, based on correlation measure. In the end, only the categories that have more than 5 occurrences are kept, all the other successful detections are ignored.
In case of failure
If the signals are not as clean as in this sample dataset, the automatic detection of the heartbeats and blinks may fail with the standard parameters. You may have to use the process "Detect custom events" and adjust some parameters. For instance:
- If nothing is detected: decrease the amplitude threshold, or try to adjust the frequency band.
- If too many events are detected: increase the amplitude threshold or the minimum duration between two events.
- If too many categories of events are generated, and you have a very little number of events in the end: disable the classification.
- To find the optimal frequency band for an artifact, you can open the recordings and play with the online band-pass filters in the Filter tab. Keep the band that shows the highest amplitude peaks.
If you cannot get your artifacts to be detected automatically, you can browse through the recordings and mark all the artifacts manually, as explained in the tutorial Event markers.
Additional documentation
Related tutorial: Detect subject movements
